Anonymous coins were the shining stars of 2025, but 2026 is proving to be a tough year. Many former leaders have experienced sharp corrections, while newer coins are volatile. As February begins, crypto whales are no longer betting blindly.
Instead, they selectively buy and sell these three anonymous coins, based on momentum changes, early reversal signals, and chart structure that can determine the next trend (whether upward or downward).
Zcash (ZEC)
Zcash was one of the strongest anonymous coins last year, but its momentum has weakened considerably as we head into 2026. In just the last month, the price of ZEC has dropped nearly 26%, reflecting risk aversion in the market. However, this weakness is beginning to change as February approaches.
Over the past 24 hours, crypto whales have been aggressively involved. The regular Zcash whale group has increased Token holdings by 45.19%, pushing their total to approximately 14,500 ZEC.
At the same time, the top 100 addresses also increased their holdings by an additional 14.6%, bringing the group's total ZEC to 43,722 ZEC.
In total, the whales accumulated approximately 6,500 ZEC, equivalent to about $2.5 million at current prices. Balances on exchanges also decreased during this period, further indicating that this buying was an accumulation trend, not a selling trend.
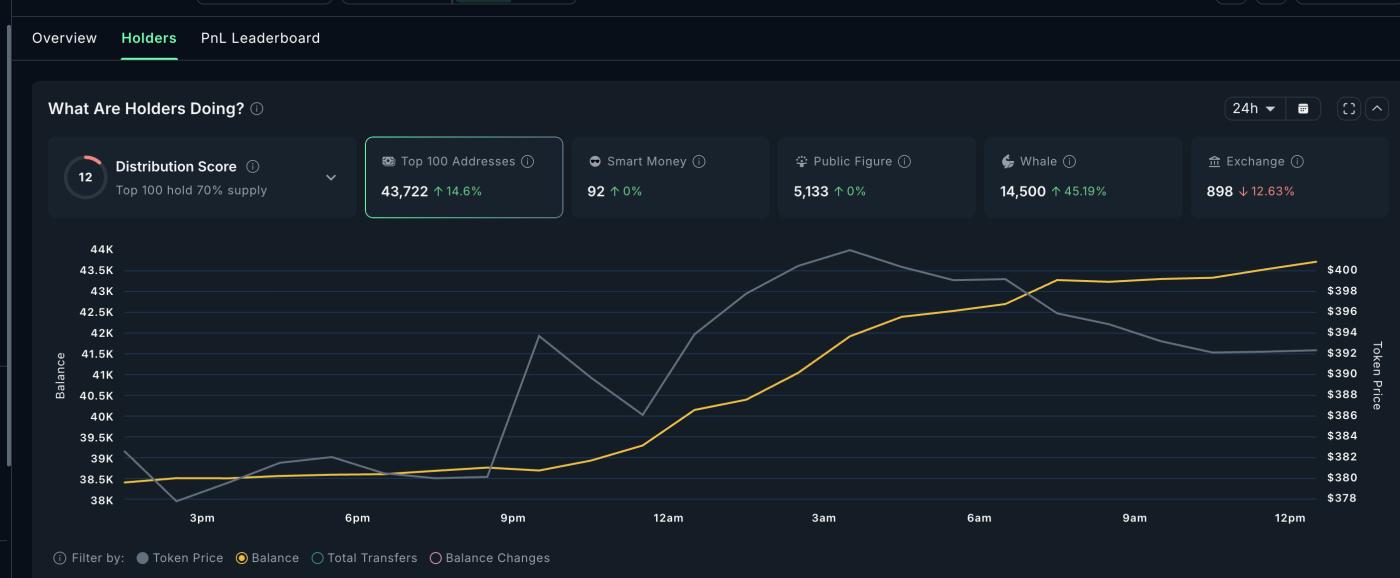 ZEC Whales: Nansen
Want more analysis on similar Token ? Sign up for editor Harsh Notariya's Daily Crypto newsletter here .
The chart below explains why the whales are acting aggressively at this time . Since the end of December, ZEC has been moving within a bear flag pattern – a price pattern indicating a continuation of a downtrend, with the potential for a further decline of approximately 42%.
However, this risk is being challenged. Zcash is beginning to rise above the top trendline of the bear flag pattern, weakening the bearish structure.
Momentum indicators also confirm this shift. From October 30th to January 25th, the price of ZEC formed progressively higher Dip , while the Relative Strength Index (RSI) formed lower Dip .
The RSI measures momentum, and the fact that these two indicators are moving in opposite directions suggests a hidden bullish divergence, meaning underlying selling pressure has weakened. Since this signal appeared, ZEC has risen by approximately 24%.
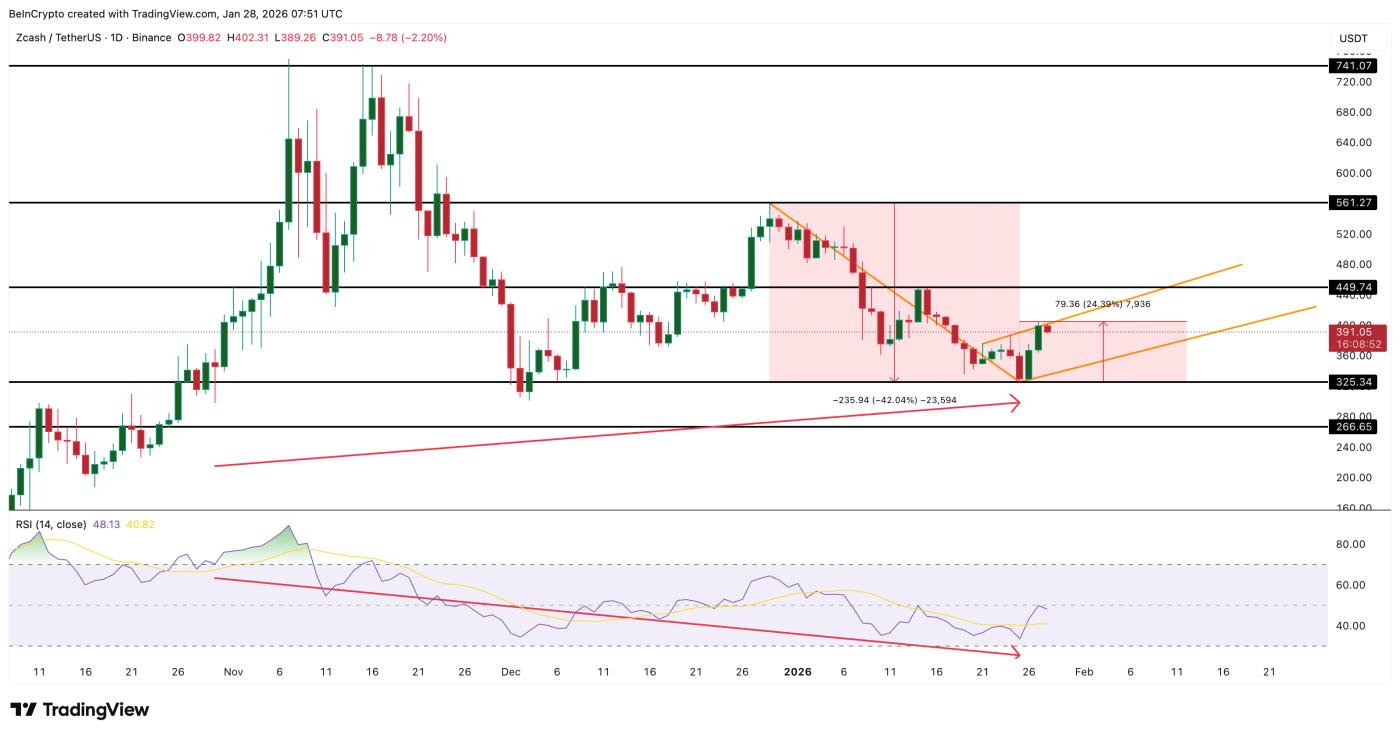 Zcash Price Analysis: TradingView
The next key price level is $449. If ZEC completely breaks through this mark, the bear flag pattern will be invalidated, opening up room for an increase to around $561, where the bearish structure is completely broken.
Conversely, if the $325 threshold is breached, the risk of a breakdown will return, and the argument for a price increase driven by whales will be eliminated.
Dusk
Among anonymous cryptocurrencies, Dusk Network stands out for the following reason: the conflicting actions of whales. DUSK has still increased by nearly 200% in the past 30 days, possibly due to the FOMO effect of investors after missing the DASH and XMR rally . However, this coin has just corrected by more than 38% in the last 7 days, showing a clear divergence among holding groups as February approaches.
on-chain data shows that smaller whales are reducing their holdings of Token, while larger players are buying during price corrections over the past 7 days.
Regular whale wallets reduced their holdings by 7.22% during this price drop. Conversely, the top 100 addresses increased their purchases by 13.88%, bringing their total DUSK holdings to 464.44 million Token.
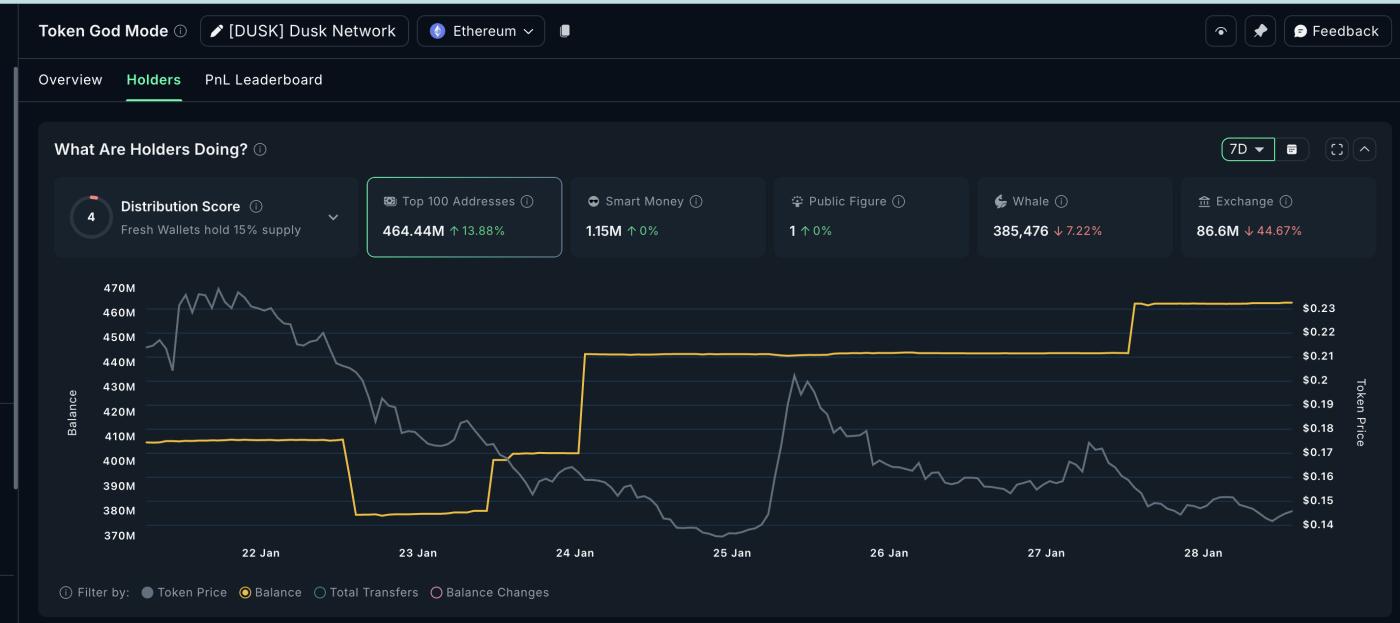 DUSK Whales: Nansen
This suggests that large investors accumulated approximately 56.6 million DUSK during the correction, worth roughly $8.2 million at current prices.
This differentiation becomes more logical when looking at the technical chart.
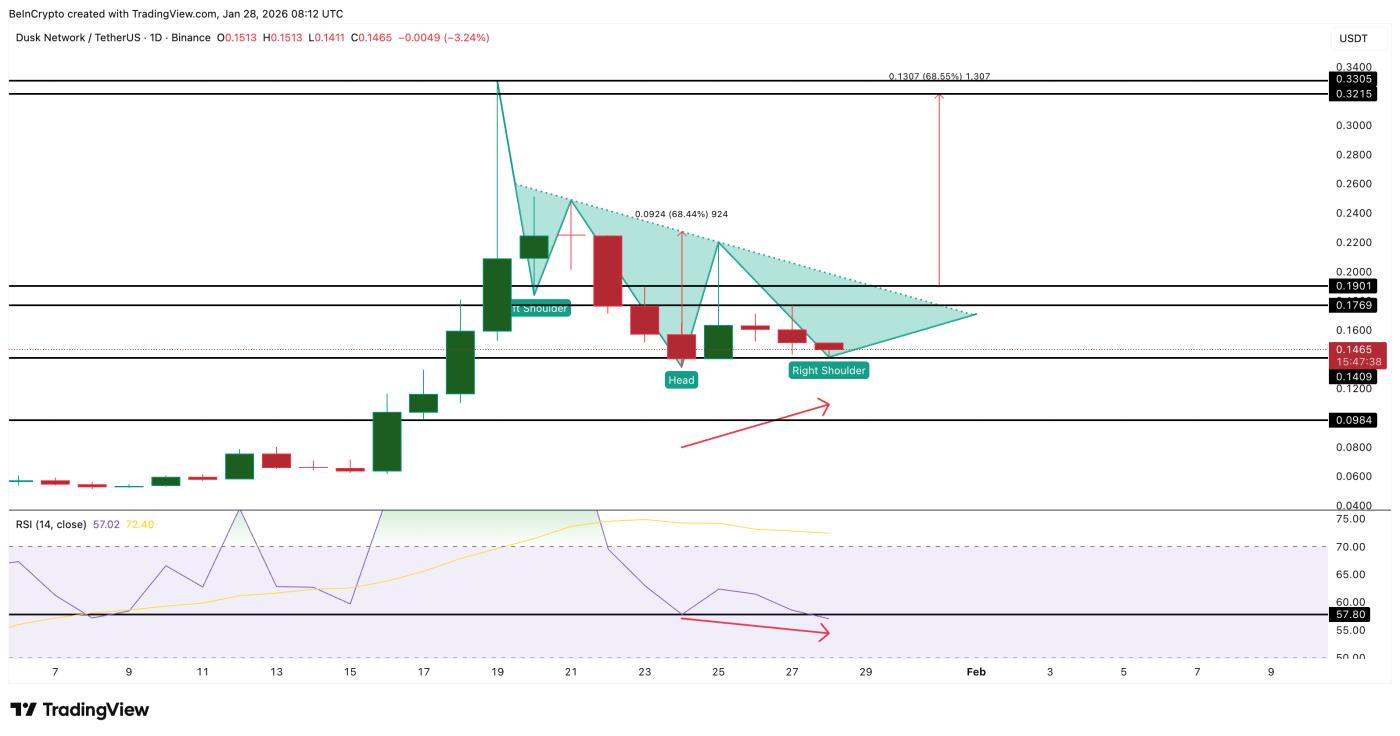
DUSK is forming a potential "inverse Vai- and-Vai reversal" pattern; however, the neckline is sloping downwards, making a strong breakout more difficult.
The decisive resistance zone lies between $0.176 and $0.190. If the daily candle closes above $0.190, the pattern will be confirmed, opening up upside potential of approximately 68%, targeting the $0.321–$0.330 range.
New momentum signals have just emerged but are gradually improving. Between January 24th and 28th, the DUSK price attempted to form a higher Dip , while the RSI index formed a lower Dip , signaling a hidden bullish divergence.
However, this signal is only valid if the DUSK price remains above $0.140. If it breaks below this level, the bullish divergence is broken and the risk of the price falling to the $0.098 region will be higher.
 DUSK price analysis: TradingView
In summary, whales holding private Token are currently divided on DUSK. Retail investors are reducing risk after the sharp price drop. Meanwhile, large whales are taking advantage of the price dip to accumulate, possibly preparing for a breakout above the short-term neckline.
Until DUSK regains the $0.190 mark, this remains a high-risk scenario with Unconfirmed .
COTI
Among anonymous cryptocurrencies, COTI has quietly entered a correction phase . The Token has fallen approximately 22% in the past month and 14% in the last seven days alone, indicating continued selling pressure as the price enters a descending channel. While weak, data suggests that whale behavior is changing and the sell-off may have slowed down.
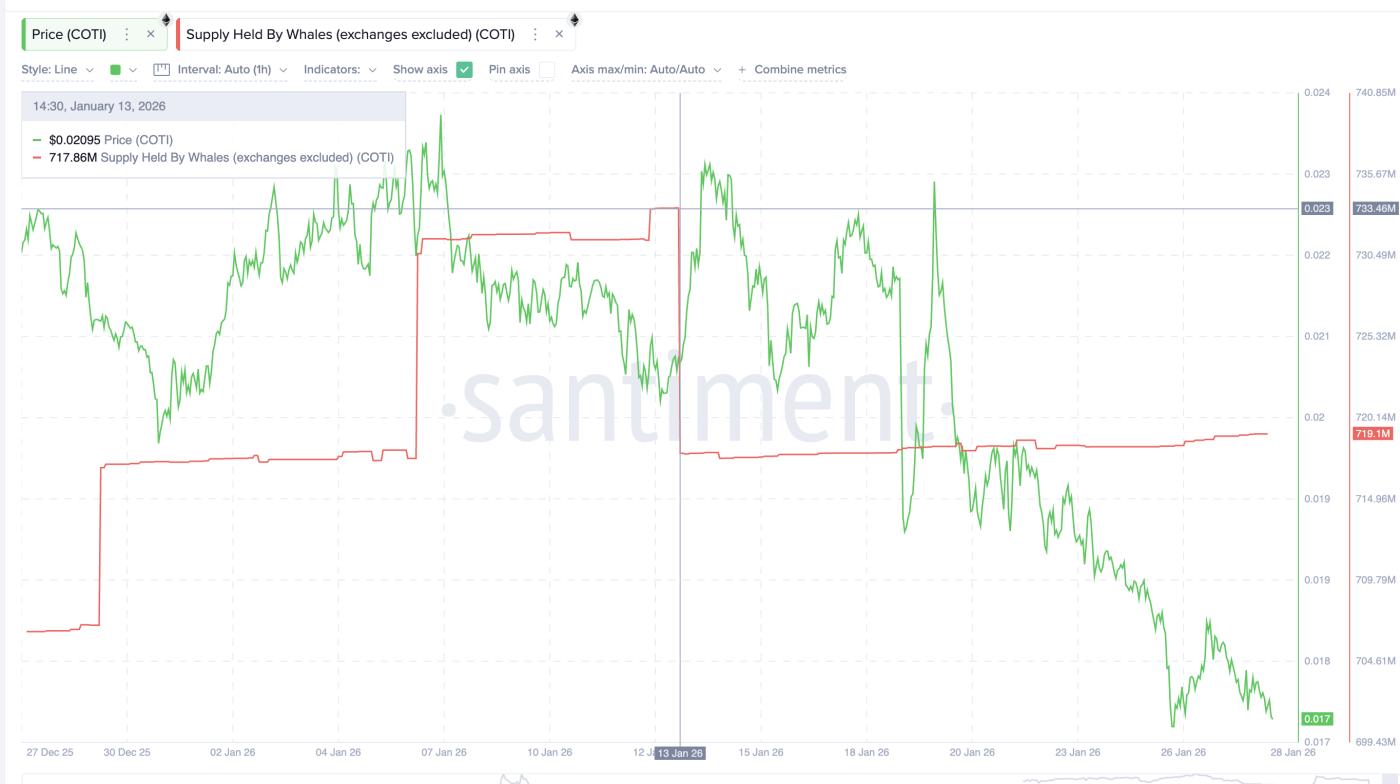
on-chain data has revealed a significant change. After January 13, 2024, COTI whales began selling off their holdings en masse , causing their Token holdings to drop from 733.46 million COTI to 718.17 million.
This Dump off coincided with the risk of a breakout from the downtrend channel, explaining why COTI prices remained weak throughout the beginning to middle of January 2024. However, this trend has shown signs of changing recently.
 Sharks sold in COTI: Santiment
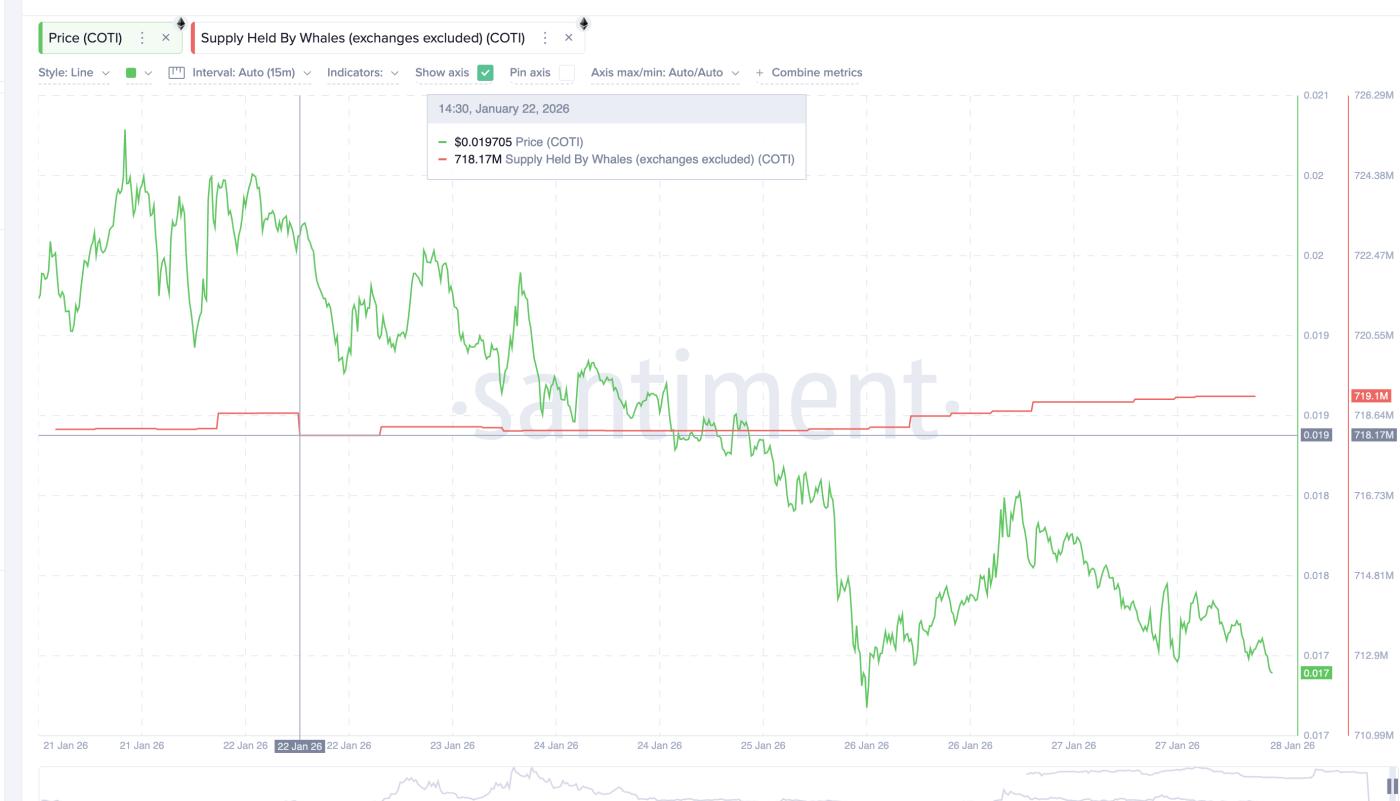
Since January 22, 2024, large investors have returned to buying, increasing their holdings from 718.17 million to 719.1 million COTI. This represents an increase of approximately 930,000 COTI.
 Shark acquired: Santiment
However, this buying pressure was still modest compared to the previous selling volume. This suggests that the whales were only just probing their positions and were not yet fully confident about the upcoming upward trend.
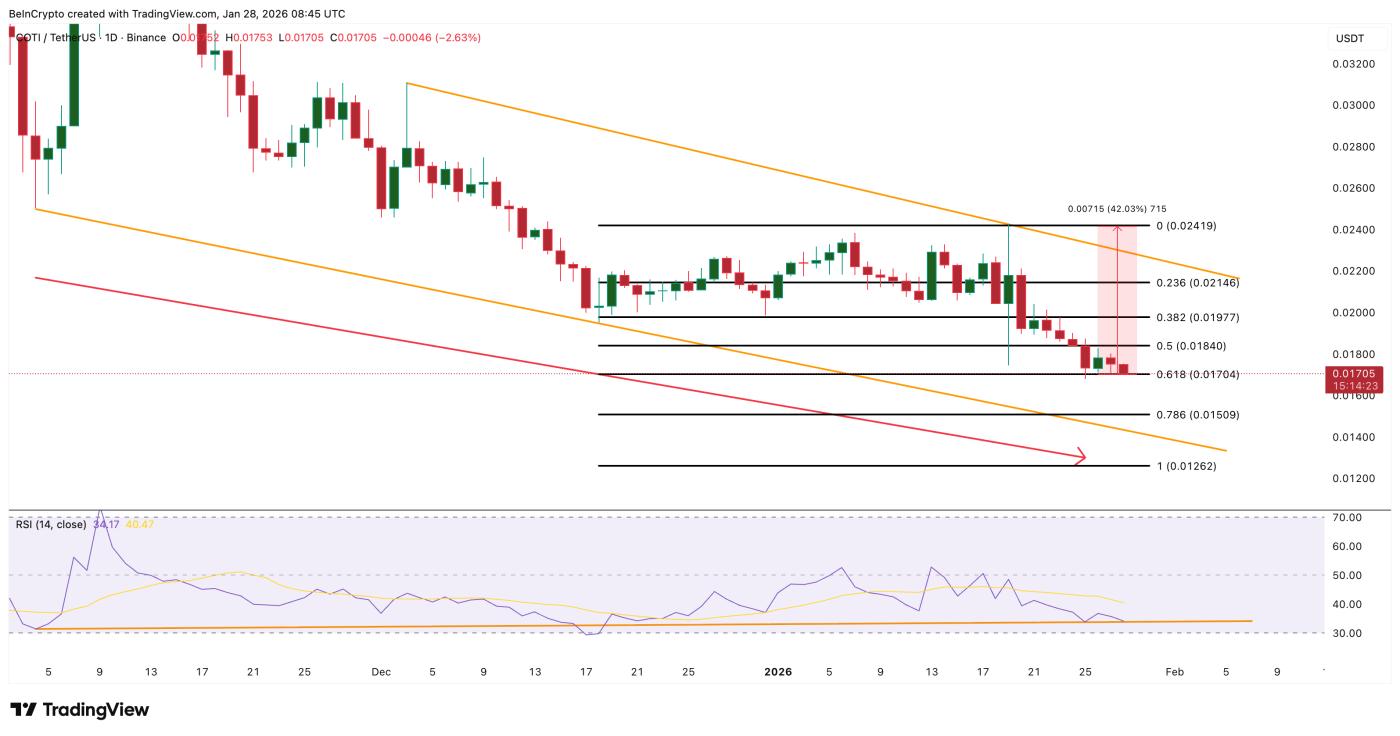
The COTI price chart explains why whales are cautious but still interested. COTI remains within a descending price channel, but momentum has shifted.
From November 4, 2023 to January 25, 2024, the price of COTI formed a new Dip , while the RSI index formed a higher Dip . Such bullish divergence usually signals that selling pressure is gradually weakening, even though the price remains sideways. This is also a sign that could foreshadow a trend reversal.
 COTI price analysis: TradingView
However, for the trend reversal to be confirmed, the price needs to break through key levels. A daily close above $0.019 would be the first test. If successful, the price could head towards $0.024, representing an increase of approximately 40% and eliminating the previous bearish structure.
Before these levels are broken, the downside risk remains quite high. If the $0.015 threshold is breached, the trend divergence will continue, and the price could fall even further.