The Ethereum network is currently experiencing its most active phase ever. However, this doesn't necessarily mean a sharp price increase. Recent on-chain data shows Ethereum just reached a significant milestone with the number of Token transfers hitting an All-Time-High. Even so, history shows that signals like this don't always lead to price increases.
In addition, the surge in ETH inflows into exchanges has raised concerns that selling pressure may not be over yet.
How does the current state of Ethereum differ from that of 2018 and 2021?
Entering February 2024, data from CryptoQuant shows that Ethereum Transfer Count —the total number of Token transfers—calculated as a 14-day moving Medium , reached a record high of 1.1 million.
At first glance, this number seems like a positive sign. It shows that the network is growing rapidly and Ethereum is being used more and more.
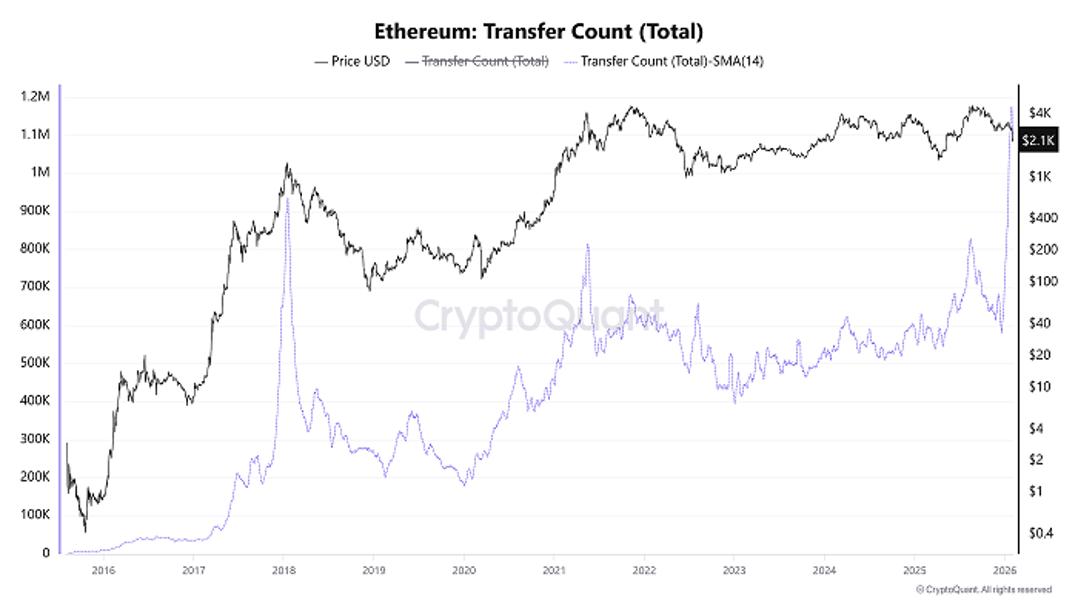 Ethereum transfer volume. Source: CryptoQuant .
However, a closer analysis reveals that this may not be the positive signal many people expect. On the contrary, this sign could indicate a cyclical correction or even a price peak, considering historical data.
CryptoQuant's CryptoOnchain expert points out that there have been two instances of Ethereum network activity spikes that served as warning signs of a market "peak".
- On January 18, 2018, during the ICO boom, the number of Ethereum transactions surged. Shortly afterward, ETH plummeted from around $1,400 to below $100 by the end of the year. This decline also plunged the entire cryptocurrency market into a two-year "crypto winter."
- On May 19, 2021, amidst the strong growth wave of DeFi and Non-Fungible Token , this index once again set a record. Shortly after, the market reversed sharply, with ETH plummeting from over $4,000 to below $2,000.
The reason is quite clear. When ETH transfers increase, it's usually a sign that many investors are moving funds from their wallets to exchanges in large quantities. This action could indicate they are preparing to sell because they no longer have positive expectations for the near future.
“The current situation has many similarities to the scenarios of 2018 and 2021. Although the macroeconomic context has changed, on-chain behavior of network members shows that Ethereum is entering a high-risk zone,” CryptoOnchain emphasized .
This assessment was further reinforced when the Ethereum Exchange Inflow Index (Top 10) surged, coinciding with ETH falling below $2,300 in early February 2024.
Ethereum Exchange Inflow (Top 10) is an indicator measuring the total amount of coins deposited into exchanges from the 10 largest transactions in a day. A high index signals that investors, especially whales, are transferring large amounts of ETH to exchanges simultaneously. This is often XEM as a sign of increasing selling pressure and a potential risk of further price declines.
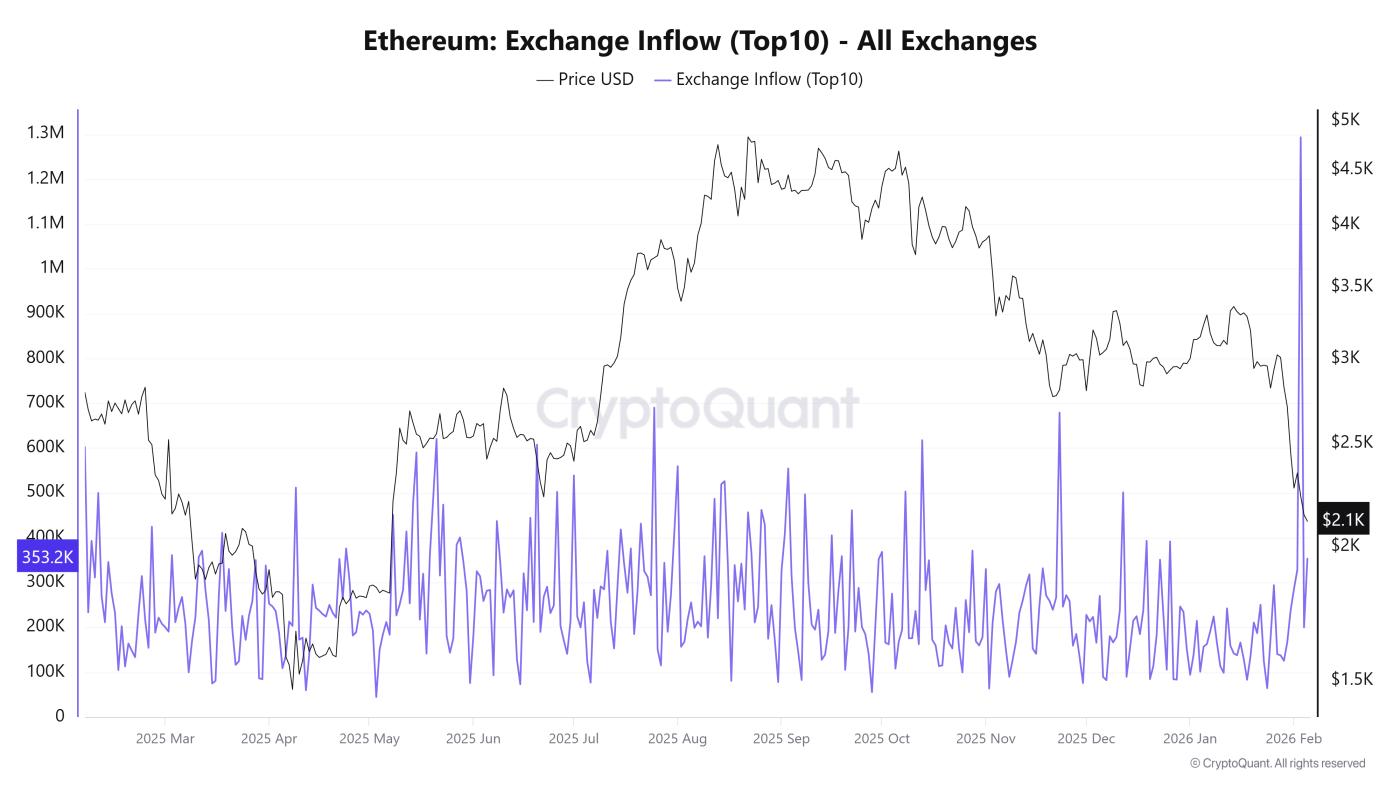 Amount of ETH deposited on exchanges (Top 10). Source: CryptoQuant .
On February 3, 2024, this index surged to 1.3 million—its highest level in a year. Two days later, ETH plummeted from $2,230 to below $2,100.
According to BeInCrypto's analysis, Ethereum needs to recover to at least $3,000 to confirm a trend reversal. However, in the short term, ETH is likely to fall further to the $2,000 support zone as selling pressure remains unabated.