MSTR's price has fallen nearly 22% in the past month, closely mirroring Bitcoin's approximately 23% drop over the same period. As Bitcoin continues to weaken, pressure is also mounting on MicroStrategy's massive BTC holdings. Recent estimates suggest the company is currently losing over $3.5 billion on paper with its Bitcoin holdings.
This sharp decline has prompted several Wall Street firms to revise down their price targets, with one major analyst cutting theirs by as much as 60%. However, technical charts and cash flow data suggest that MicroStrategy's long-term resilience hasn't been completely broken. Here's what the charts are actually showing.
The rising wedge pattern and the upward trend of the CMF indicator suggest that large investors are still buying.
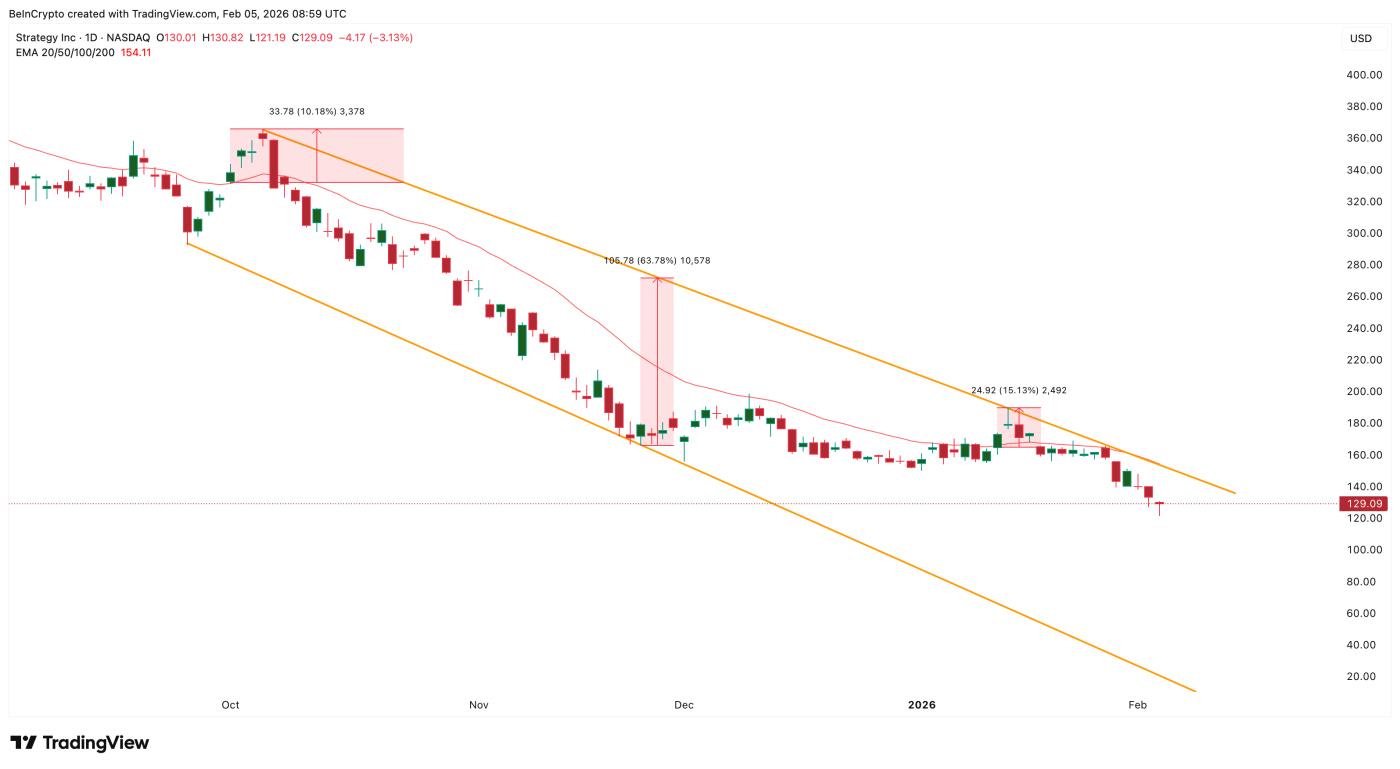
Despite recent losses, MicroStrategy's daily chart is still moving within a Falling Wedge wedge pattern. This pattern typically indicates weakening selling pressure and the potential for a rebound if the price breaks through the resistance zone. Currently, the upper resistance line also coincides with the 20-day Medium .
In fact, this model has proven effective with MSTR. In early October and mid-January, the stock rose 10% to 15% after breaking above the 20-day EMA. This is a trend line that reacts quickly to price fluctuations.
 Bullish pattern : TradingView
As mentioned, the 20-day EMA is currently quite close to the upper edge of the Falling Wedge. This means a breakout could happen quickly if buying pressure increases again.
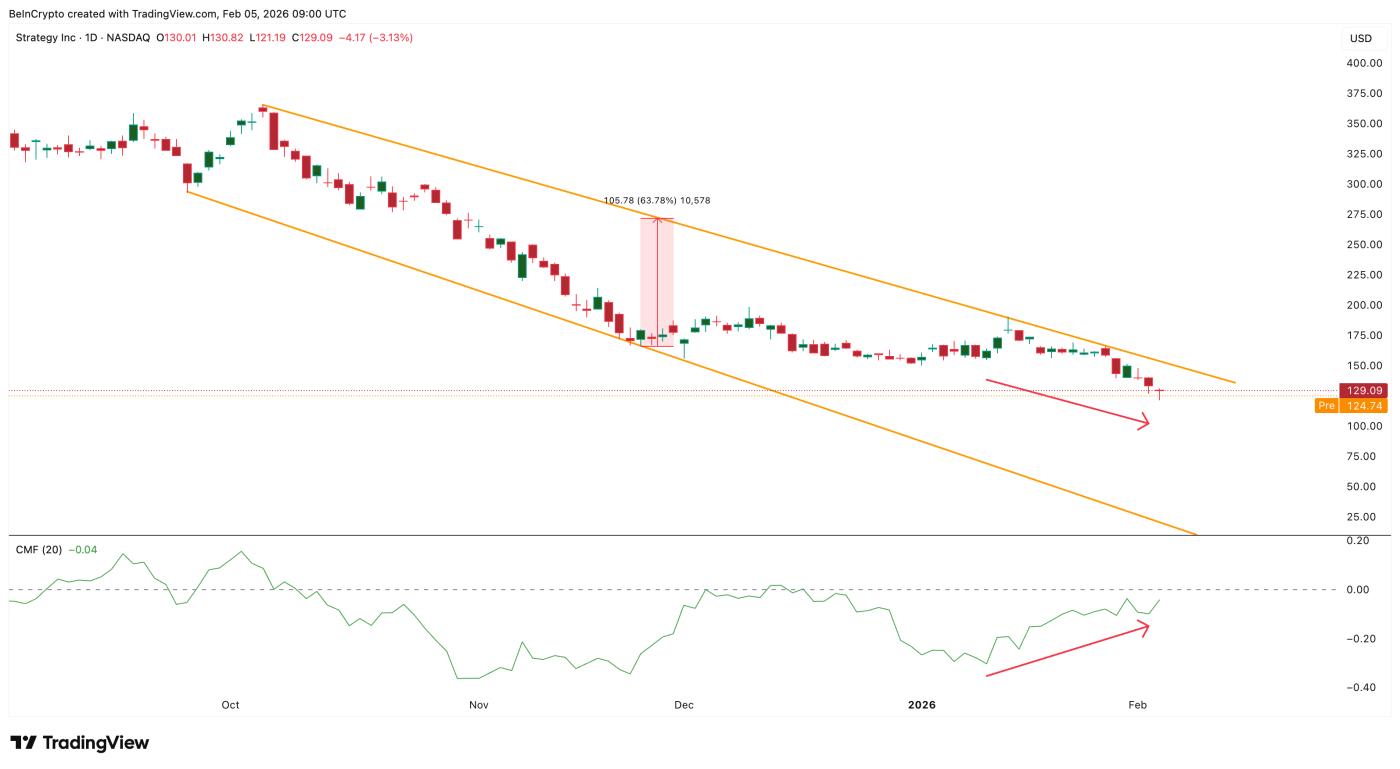
Another important indicator comes from the Chaikin Money Flow (CMF) indicator. The CMF measures XEM institutional investors are injecting or withdrawing money from assets based on price and volume data. Since January 12, 2024, the CMF has tended to increase even when stock prices are falling.
 Large amounts of money are flowing in: TradingView
This creates a "bullish divergence" phenomenon. Prices fall, but large amounts of money flow tend to increase.
This also aligns with recent reports indicating that MicroStrategy's Bitcoin position is down more than $3.5 billion (on paper). However, large investors haven't yet sold off. Instead, Capital continues to quietly flow in.
Want to stay up-to-date on more Token information like this? Sign up for Editor-in-Chief Harsh Notariya's daily Crypto Newsletter here .
The combination of a Falling Wedge pattern and a rising CMF suggests that institutional investors are still betting on the possibility of a stock market recovery and haven't abandoned the trend yet.
Analysts lowered their targets as the MFI showed weak buying pressure from retail investors.
Although large amounts of capital continue to support Michael Saylor's strategy , sentiment among Wall Street financiers has weakened significantly.
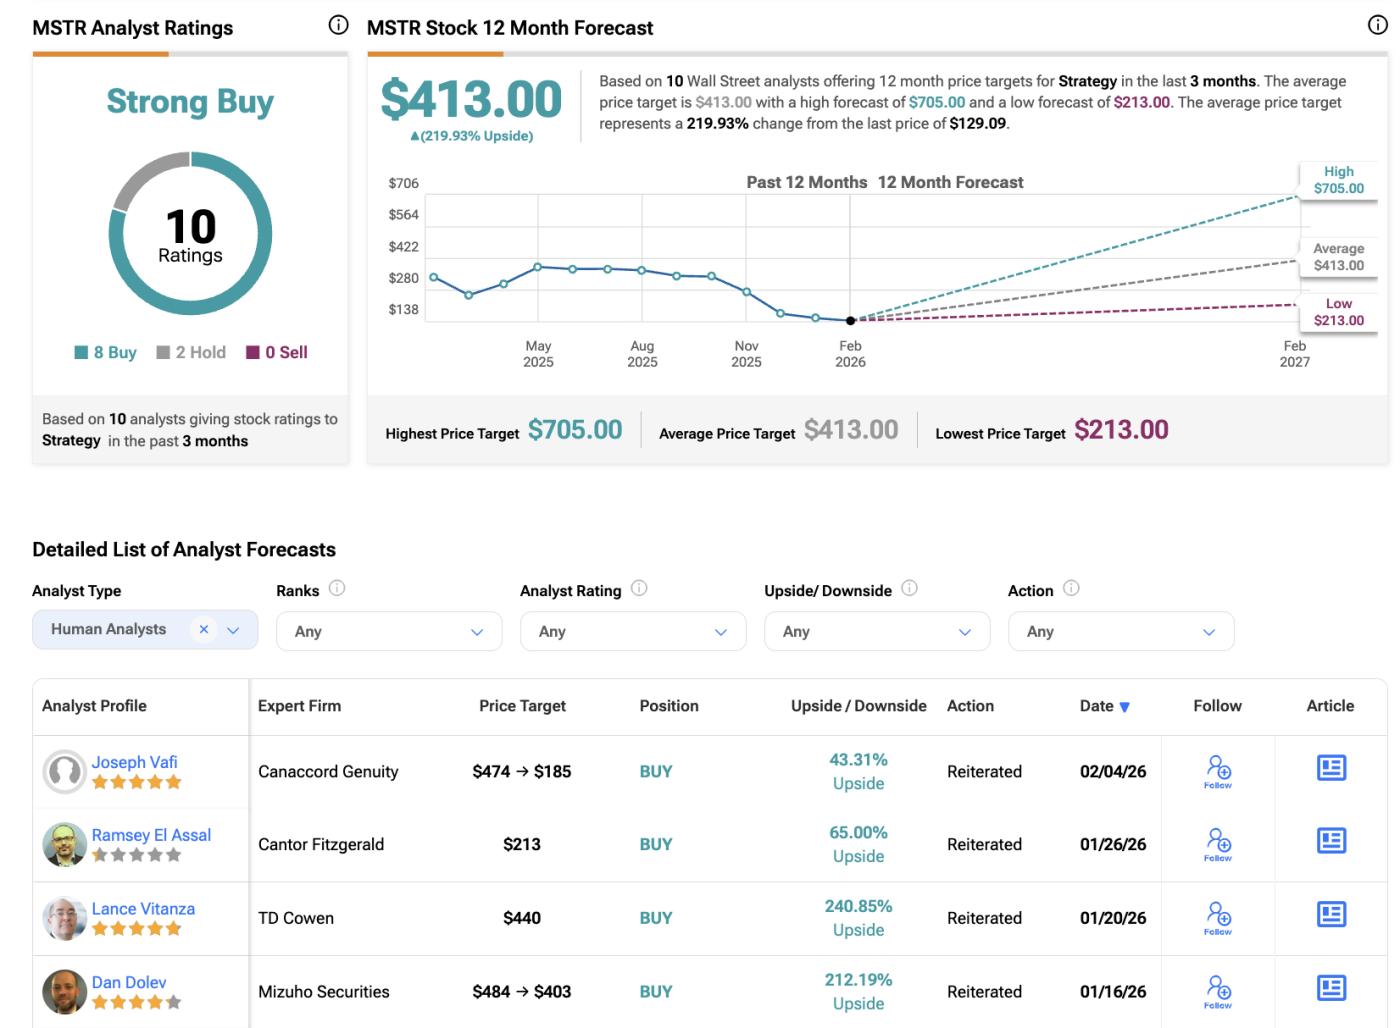
Canaccord Genuity – a financial services company – has just lowered its price target for MicroStrategy stock from $474 to $185, a drop of approximately 60%. This could be due to the decline in Bitcoin and the risks associated with the company's leveraged trading strategy.
At the same time, several other firms maintain a "buy" rating for the stock, keeping their Medium price targets significantly higher than the current price. This creates a clear Chia in expectations.
 MSTR Price Target: TipRanks
The reason for this difference becomes clearer when looking at the Money Flow Index (MFI) indicator.
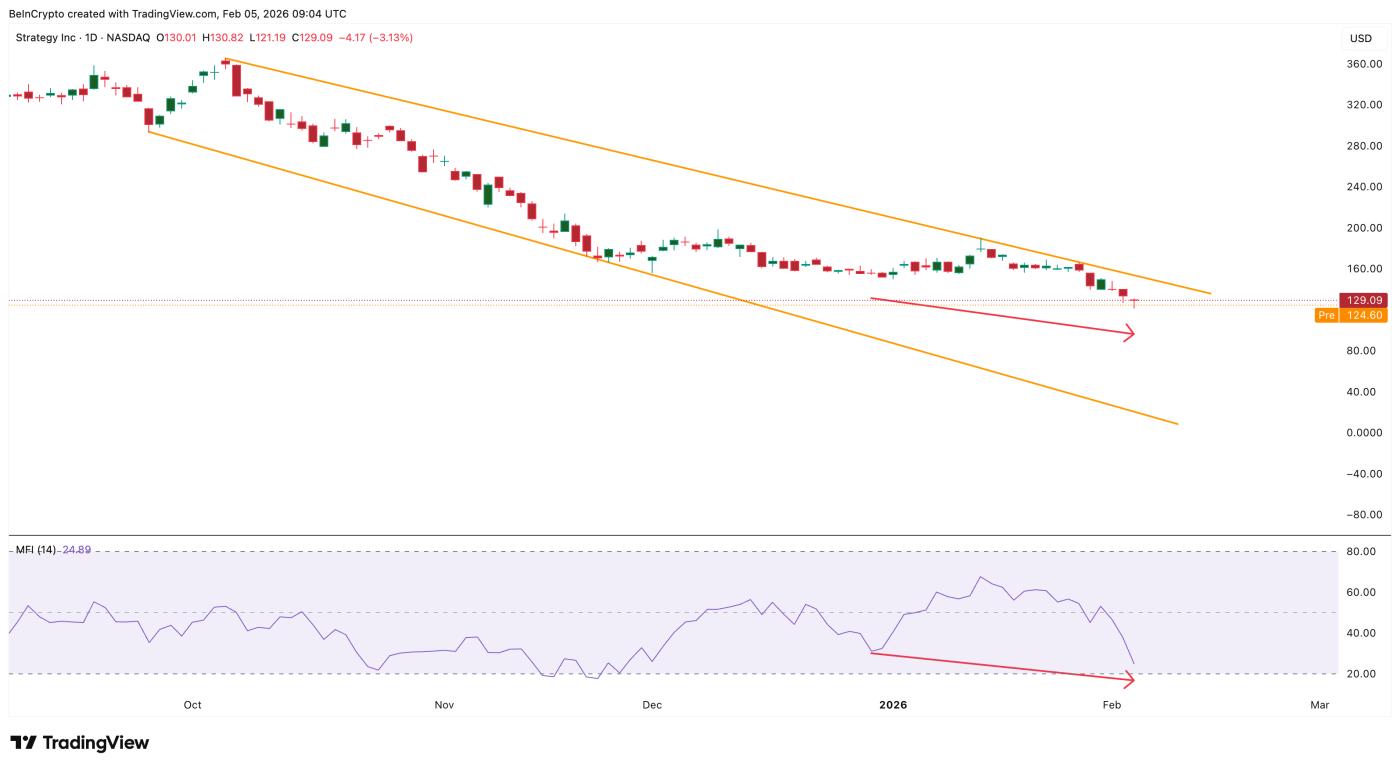
The MFI tracks buying and selling pressure based on both price and volume. This indicator is used to assess whether retail investors are boldly "buying the Dip" or maintaining a cautious attitude.
Between January 30, 2024 and February 4, 2024, MicroStrategy's stock price decreased, and MFI also declined. There was no clear bullish divergence. This means that retail investors have not yet aggressively bought at the Dip . Simply put, large investors are still accumulating, while retail investors remain cautious.
 Retail investors remain on the sidelines: TradingView
This contrast is crucial. A sustainable recovery typically requires both institutional investor participation and strong retail buying. Currently, only one side is clearly involved.
This uncertainty also explains why some experts have lowered their price targets while others remain optimistic.
Key MSTR price levels that retail investors should watch right now.
The final Shard of the puzzle comes from the price structure and support levels.
For MicroStrategy to regain technical strength , the price first needs to break above the $140 level. This area Vai as both psychological resistance and a trend confirmation signal. If the price clearly closes above $140 on the daily chart, it will be closer to the breakout of the wedge pattern and near the 20-day EMA.
If a breakout occurs, the next major target will be near the $189 mark. This level is important for three reasons:
First, this area is located at a key Fibonacci retracement level. Fibonacci levels often act as strong resistance and support points, where price typically reacts. Second, it almost coincides with Canaccord's new price target of $185, indicating that analysts are also paying attention to this technical zone.
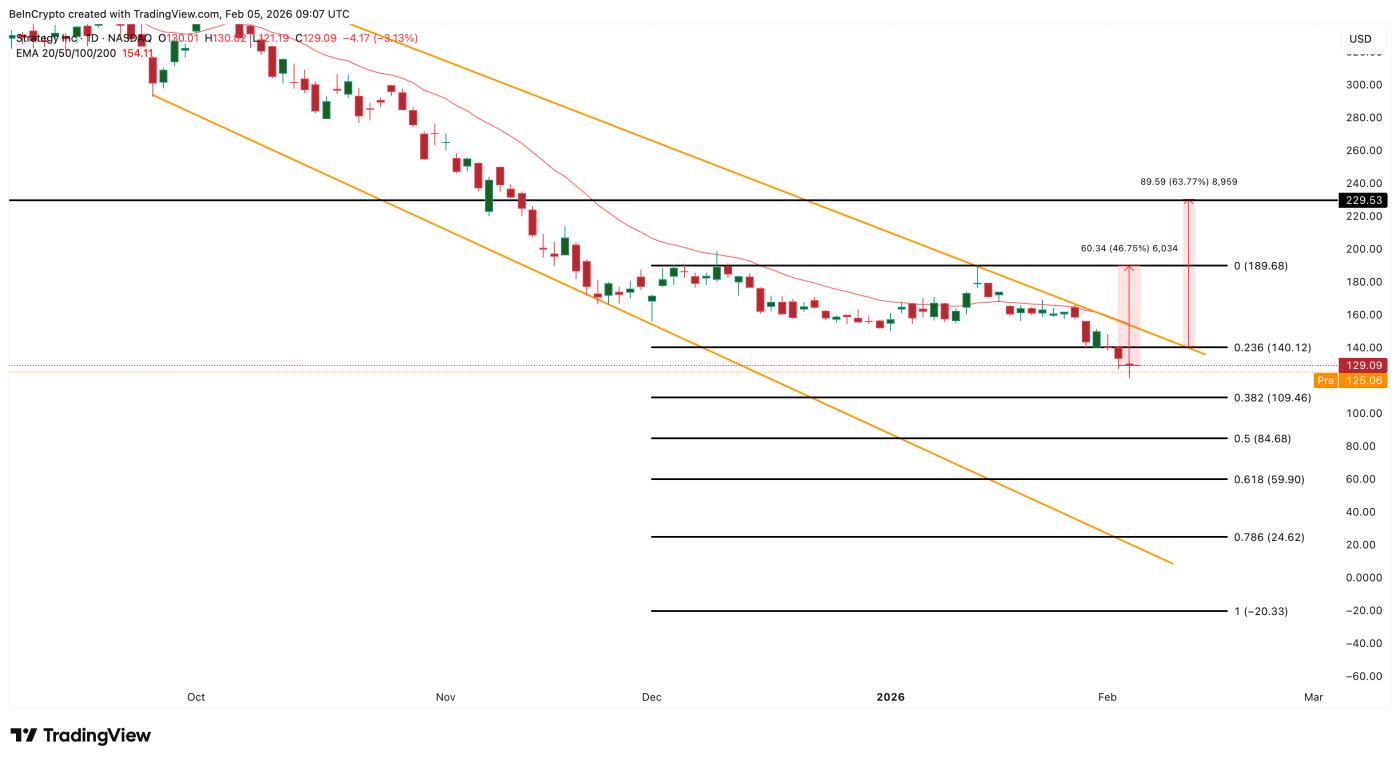 MSTR price analysis: TradingView
Thirdly, this level is near the middle of the recent sideways consolidation zone, so it will naturally attract the price towards this area. If it surpasses $189, the next target according to the Falling Wedge pattern will be the $225–$230 region, equivalent to an increase of approximately 63% from the current price. This is also the lowest price predicted by analysts.
Conversely, if it fails to break above $140, the bullish scenario will be significantly weakened. In that case, the risk of a drop to $109 will increase, especially if Bitcoin continues to correct downwards.