

Bitcoin surged from $60,000 to above $70,000 in less than 24 hours, erasing a previous drop of about 14%, but the mechanism behind the rebound reveals a deeper warning.
CryptoSlate analyst Gino Matos believes that the dramatic 12% single-day rebound and 17% recovery from the intraday low, which on the surface appears to be a clearing up of the market, is more a result of cross-asset price stabilization and forced position rebalancing than a result of large-scale spot buying. The report cites Reuters' view that this rebound is more a result of cross-asset price stabilization and forced position rebalancing than a result of large-scale spot buying.
Meanwhile, the derivatives market remains rife with put protection positions, with pricing suggesting that $70,000 may just be a temporary stop rather than a true support level.
Strong tides combined with macroeconomic headwinds
A review of the market movements on February 5th: Bitcoin opened near $73,100, briefly surged before declining steadily, closing at $62,600. CoinGlass data shows that approximately $1 billion in leveraged long positions were forcibly liquidated that day.
This figure is enough to illustrate the chain reaction triggered by the forced sell-off. More noteworthy is that CoinGlass data shows that Bitcoin futures open interest had already fallen from approximately $61 billion to $49 billion the previous week, indicating that the market had already begun to actively deleverage before the final wave of shocks.
The sell-off was not triggered by the cryptocurrency industry itself. Reuters analysis points out that the main drivers were the collective weakness in technology stocks and sharp fluctuations in precious metals—silver once plummeted 18% to around $72.21, dragging down all risk assets.
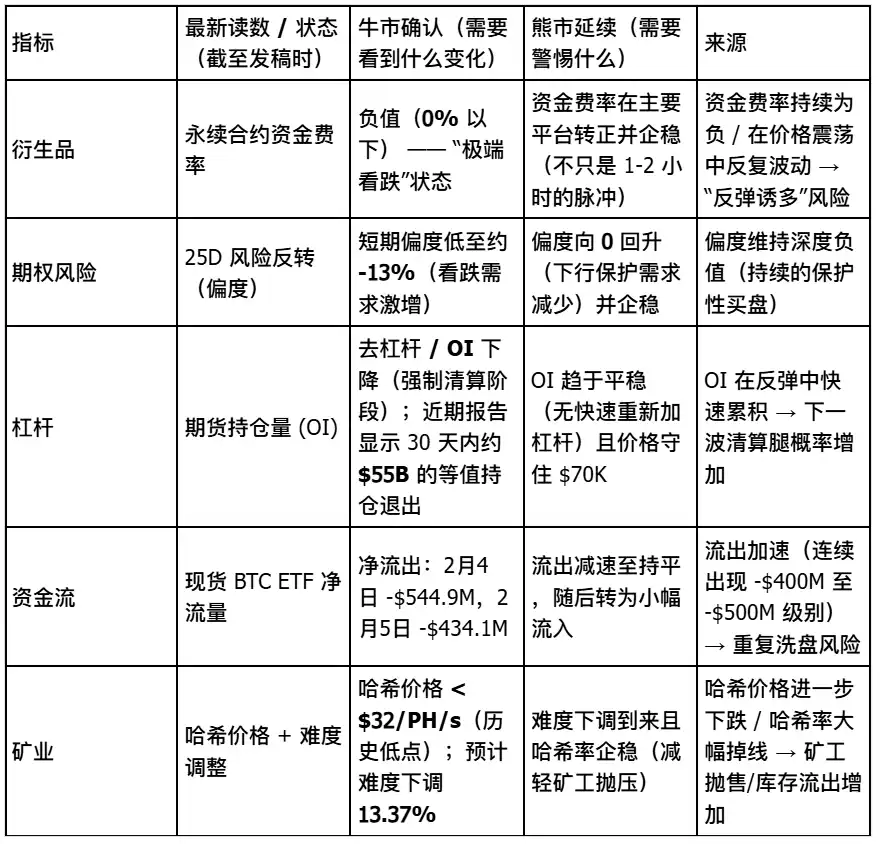
Deribit's research data further confirms this cross-market spillover effect, with derivatives market sentiment turning extremely pessimistic: funding rates have turned negative, the term structure of implied volatility has inverted, and the 25-delta risk-reversal skew has been suppressed to about -13%, exhibiting a typical state of "extreme fear".
On the policy front, the report mentioned that the market reacted strongly to President-elect Donald Trump's nomination of Kevin Warsh as Federal Reserve Chairman, with traders generally interpreting it as a signal that the balance sheet may shrink further and liquidity may tighten in the future.
Furthermore, data from TheMinerMag shows that miners' profits are under immense pressure, with the hash price falling below $32 per PH/s, and network difficulty expected to decrease by approximately 13.37% within two days. However, the report points out that this mitigation mechanism did not take effect in time before the price broke through the support level.
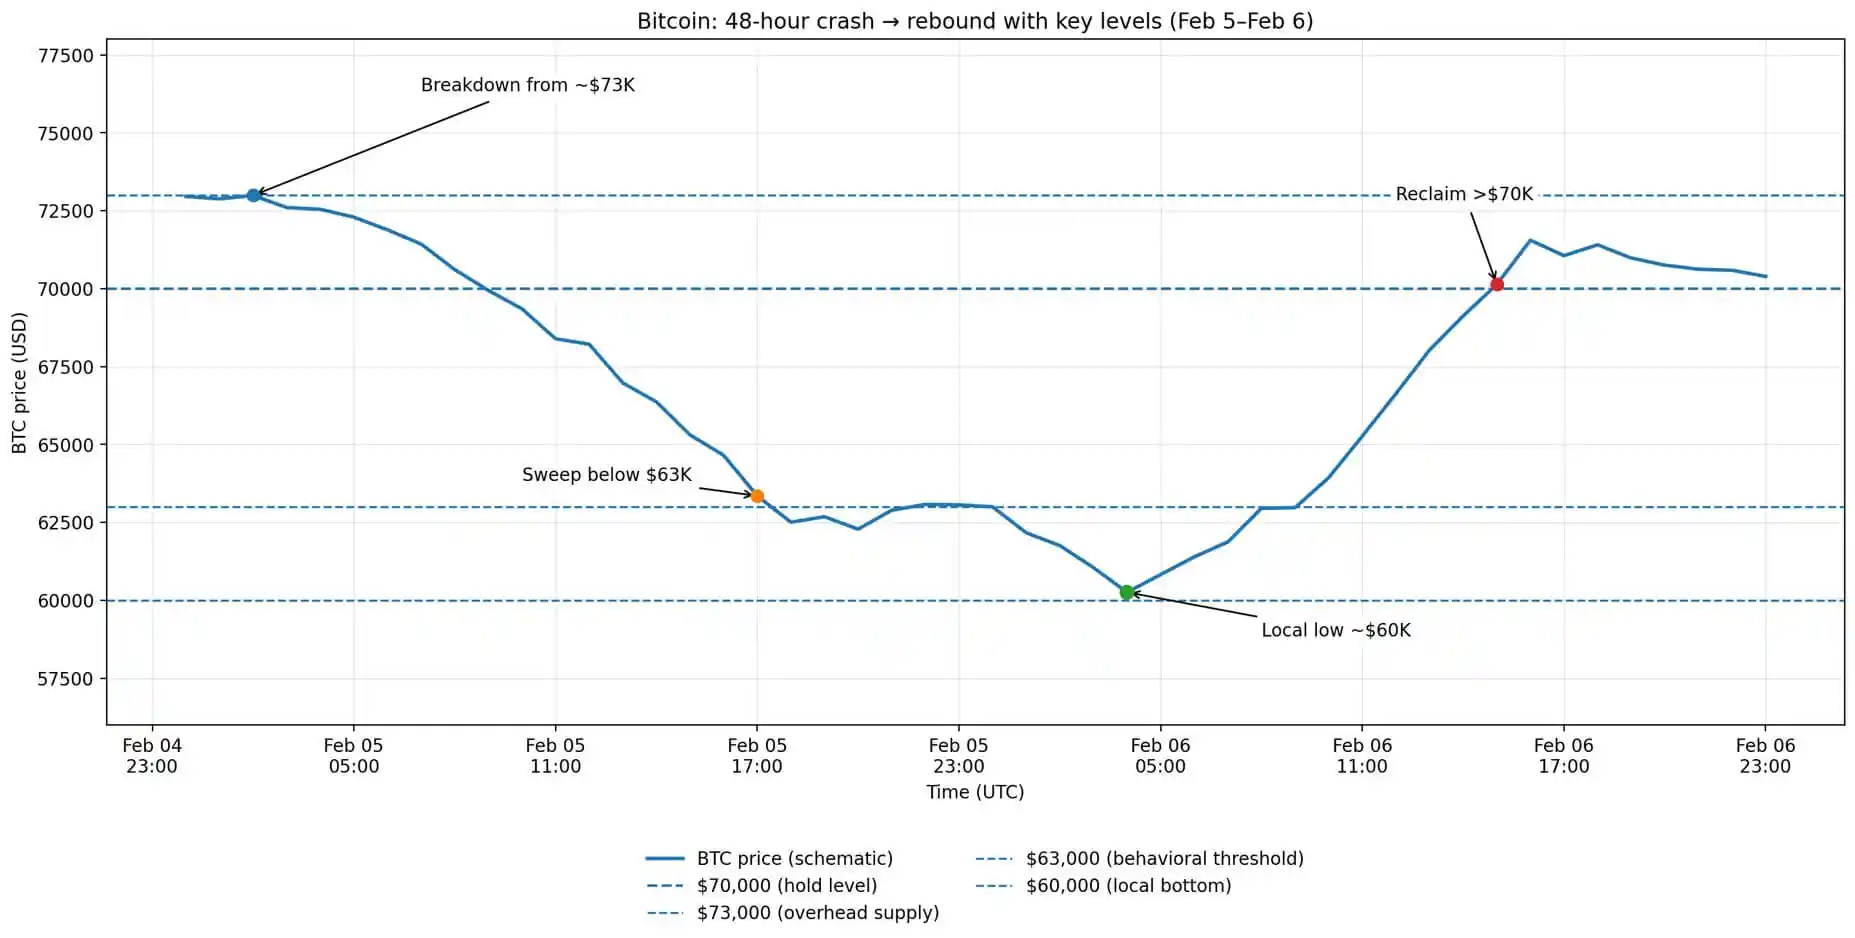
Bitcoin's price action over the past 48 hours shows a crash from $73,000, a stop-loss sell-off below $63,000, a regional bottoming out near $60,000, and a subsequent rebound back above $70,000.
Cross-asset reversal triggers short squeeze
Further analysis of the price movement on February 6th reveals that Bitcoin opened at the previous day's closing price, then fell to a daily low near $60,000, before experiencing a strong rebound, surging to a high of $71,422. After three unsuccessful attempts to break through this level, the price retreated back below $70,000.
The report, citing Reuters data, stated that the catalyst for the rebound was not internal factors within the crypto industry, but rather a rapid shift in overall risk assets. Wall Street closed higher across the board that day: the S&P 500 rose 1.97%, the Nasdaq climbed 2.18%, the Dow Jones Industrial Average surged 2.47%, and the Philadelphia Semiconductor Index (SOX) jumped 5.7%.
Commodities also rebounded sharply, with gold rising 3.9% and silver rising 8.6%, while the dollar index fell 0.2%, signaling a loosening of financial conditions.
Analysts have observed that Bitcoin's price movements are highly synchronized with these cross-asset changes, exhibiting a clear mechanical correlation—when tech stocks stabilize and metals rebound, Bitcoin is pulled up along with them through shared risk exposure.
However, the report further warned that the violence of this rebound precisely reflects the extreme positioning structure of the derivatives market. A skewness of approximately -13%, negative funding rates, and an inverted volatility curve create a unique condition— any positive change in the macroeconomy is sufficient to trigger short-covering and forced rebalancing, resulting in a severe squeeze effect.
Nevertheless, forward-looking indicators remain bearish. Data from Derive shows that open interest in put options expiring on February 27th is heavily concentrated in the $60,000 to $50,000 strike price range. Derive analyst Sean Dawson commented that the market's demand for downside protection is "extremely strong," with traders actively hedging against the risk of the next pullback after the recent rebound.
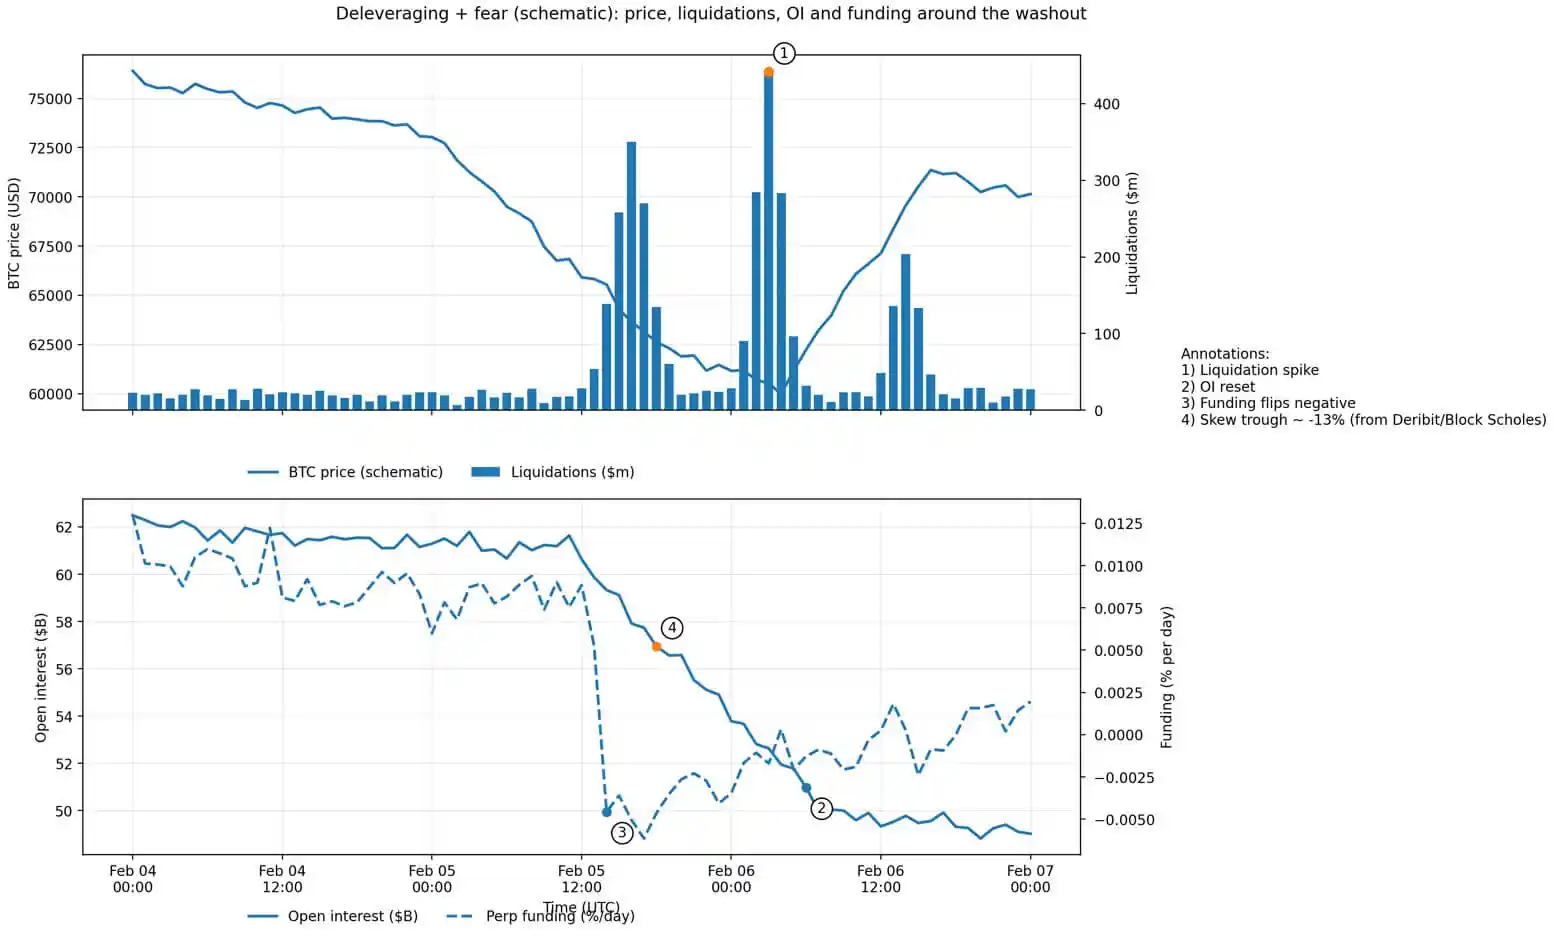
The Bitcoin deleveraging chart shows a surge in liquidations, a reset of open interest from $62 billion to $49 billion, negative funding rates, and a skewness that hit -13%.
Can $70,000 hold? Three conditions.
Analysts have proposed a framework suggesting that whether Bitcoin can hold $70,000 depends on three key conditions.
First, the macroeconomic rebound must continue—tech stocks need to stabilize, and US Treasury yields and the dollar cannot tighten again. The report emphasizes that this recovery is a clear cross-asset correlation; if US stocks weaken again, Bitcoin will find it difficult to remain unaffected.
Second, deleveraging needs to be continued without another round of forced selling. Currently, open interest in futures has decreased significantly, reducing the risk of a "vacuum-like drop."
Third, miners' pressure needs to be substantially alleviated after the difficulty adjustment takes effect. If prices can remain stable within the adjustment window, the expected 13.37% difficulty reduction will decrease marginal selling pressure and allow hashrate to gradually stabilize.
However, the report also listed three reasons supporting the possibility of the market bottoming out again:
First, the options market remains bearish. At the end of February, the largest put options were concentrated in the $60,000 to $50,000 range. This is a forward-looking signal embedded in implied probability, not a hindsight sentiment reflection.
Secondly, derivatives indicators remain fragile. Extreme skewness, frequent negative funding rates, and inverted volatility structures are more in line with the characteristics of a "relief rally" driven by fear than a genuine trend reversal.
Third, ETF funds continue to flow out. As of February 5, Bitcoin ETFs had seen a net outflow of $690 million that month. Although data for February 6 has not yet been released, current trends indicate that institutional funds have not yet shifted from "safe haven" to "re-entering the market."
On-chain data reveals key support areas
The analysis also cited Glassnode's on-chain analysis, pointing out that the $70,000 price point itself has no special significance; what is truly important is that it lies above the on-chain absorption cluster of $66,900 to $70,600 identified by Glassnode.
The report explains that the price stabilizing above this area means that the cluster has absorbed enough selling pressure to temporarily stabilize the market. However, for it to truly stabilize, several conditions need to be met simultaneously, including the return of spot buying, the closing of derivatives hedging positions, and a stabilization of institutional fund inflows.
The conclusion argues that the rebound from $60,000 is genuine, but the driving factors are crucial. If the macroeconomic environment changes, the stability across asset classes will crumble. A mechanical rebound created by forced liquidation does not necessarily translate into a sustainable upward trend.
The report points out that although Bitcoin has temporarily recovered to $70,000, forward curve and fund flow data show that market participants have not yet begun to bet on the sustainability of this rebound. $70,000 is not the end game—it is merely the baseline that will determine the outcome of the next round of bullish and bearish battles.


