- Aave price could plummet under $100 and risk new multi-year lows.
- Bears can decisively take out the psychological level and test the $75-$80 range.
- However, dips can offer a buy-the-dip opportunity before a sharp rebound.
Aave fell to around $108 as decentralised finance tokens broadly moved into negative territory.
With broader market pressures weighing on sentiment, $AAVE faces rising downside risks and is at risk of slipping below the key $100 support level.
The outlook reflects continued volatility across the sector, with a notable decline in total value locked, highlighting growing vulnerability to further price weakness.
Aave price retests $108
Aave’s $AAVE token was trading near $370 in August 2025 but has since declined sharply amid persistent bearish sentiment across the crypto market.
Prices fell steadily through late 2025 before sliding more aggressively toward the $100 zone.
A double-top pattern formed in the latter months of last year, and the subsequent drop to around $95 last week marked a significant downturn for the DeFi token.
Although $AAVE rebounded briefly to about $120, selling pressure has remained strong, with prices retesting the $108 support level.
The token is down roughly 15% over the past week and about 25% year-to-date.
It has also fallen around 67% since August 2025 and more than 80% from its all-time high above $667 in 2021.
The price weakness has coincided with a sharp decline in Aave’s total value locked, reflecting reduced liquidity and softer protocol revenues.
$AAVE price forecast: bears eye 2-year lows
Bulls are not completely out of the picture despite the recent bloodbath.
However, sentiment is battered, and momentum is with bears.
For Aave, technical indicators signal this increasing bearish momentum.
While momentum oscillators remain in neutral territory and point to the possibility of a short-term bullish shift, moving averages continue to signal strong selling pressure for Aave.
A slide toward the psychologically important $100 level, after the token fails to hold above the $112 support zone, will reinforce this bearish outlook.
As reflected on the daily chart, a breakdown similar to the pattern that has defined $AAVE’s price action since late 2025 could accelerate seller dominance and deepen near-term downside risks.
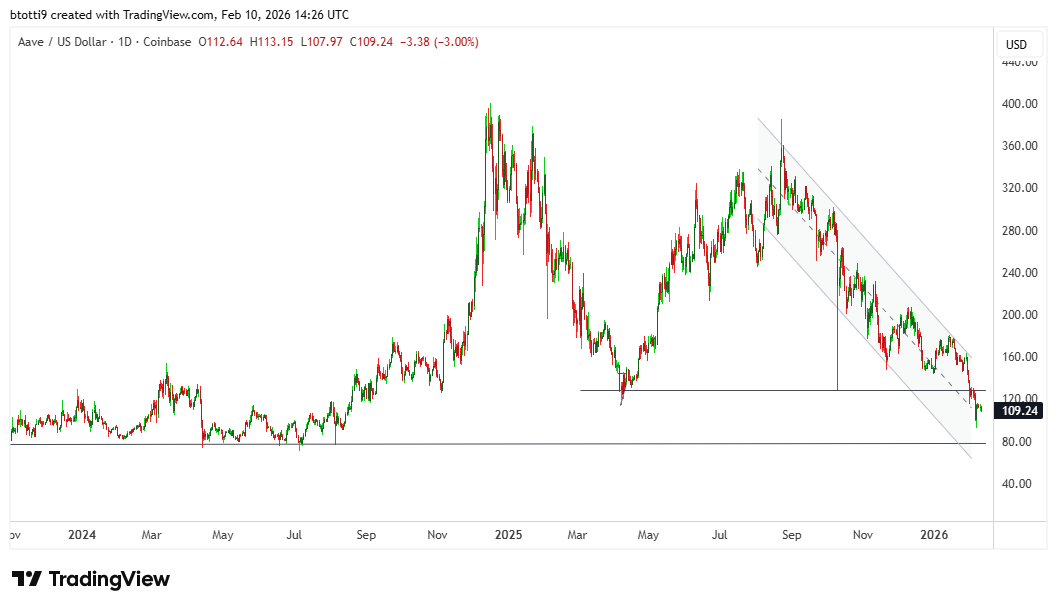
The current downturn could push the price toward the $75–$80 demand zone in the near term, an area that aligns with a key Fibonacci retracement level.
A move into this range would place Aave back at levels last seen in early 2024.
On the upside, renewed momentum would likely require a sustained weekly close above $140.
Such a move would depend on rising trading volumes, with $120 acting as initial support and $144 as a secondary resistance level before higher targets come into view.
Meanwhile, the daily Relative Strength Index is hovering near neutral territory around 34, giving sellers some room to maintain pressure.
Analysts note this setup could increase the risk of a short-term false breakout before a clearer directional move emerges.