Solana’s ($SOL) recent price action has put traders on alert once again. After sliding to multi-month lows near the lower-$80 range, $SOL staged a sharp rebound of more than 6% in a short period, briefly easing fears of an immediate breakdown.
However, the recovery has done little to settle the broader debate. Analysts now see Solana caught between fragile support and overhead resistance, with the $98–$108 zone emerging as a key upside test if momentum can hold.
Despite the bounce, market conditions remain cautious. $SOL is still trading well below former support levels that have flipped into resistance, and several technical and on-chain indicators suggest the market has not yet found a clear directional bias.
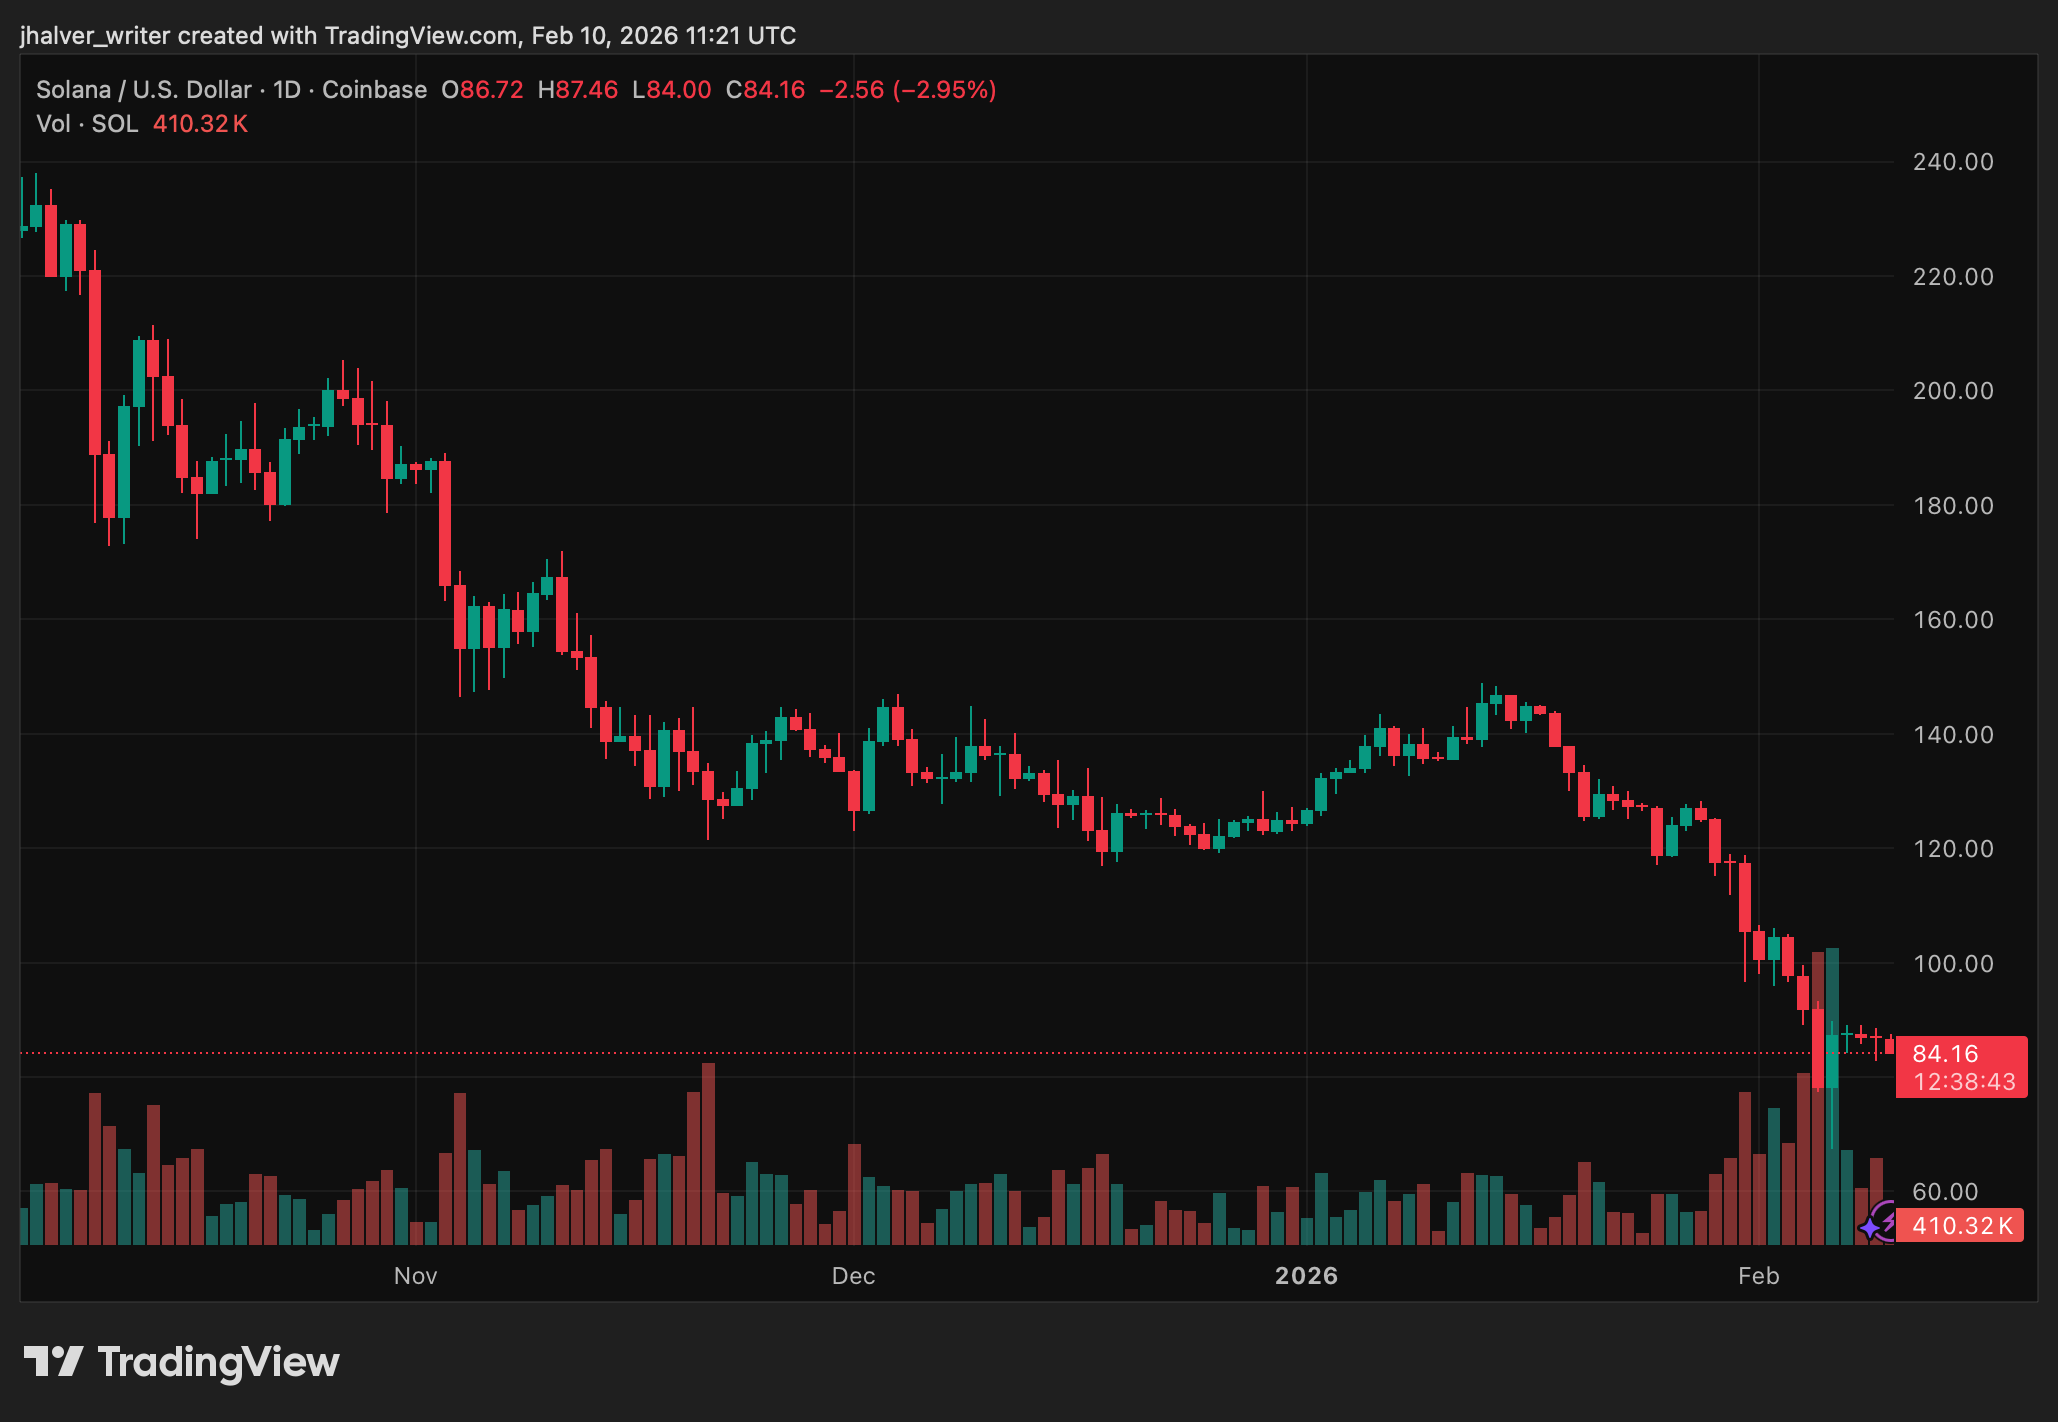
$SOL's price trends to the downside on the daily chart. Source: SOLUSD on Tradingview
Support Holds, but $SOL Trend Remains Weak
Solana is currently consolidating around the $83–$87 area, a zone many analysts view as critical short-term support.
Multiple reports highlight that $SOL has lost its prior monthly support between $98 and $100, confirming the broader downtrend remains intact. Price structure continues to show lower highs and lower lows, and $SOL is trading below key moving averages, reinforcing bearish control.
At the same time, oversold signals are beginning to appear. The Relative Strength Index on higher timeframes has dipped into levels that historically coincided with stabilization phases.
Some analysts also point to the Money Flow Index nearing extreme readings, suggesting selling pressure may be losing intensity, even if buyers have yet to step in decisively.
If the $85 area fails, downside targets cluster around $78–$80, with deeper support cited near $70. These levels align with historical demand zones observed during previous drawdowns.
Solana ETF Outflows and On-Chain Signals Add Pressure
On-chain data has added another layer of complexity. More than 1 million $SOL reportedly left centralized exchanges over a 72-hour period, a move analysts interpret as stress-driven repositioning rather than clear accumulation.
In parallel, Solana-linked ETFs recorded roughly $11.9 million in net outflows, the second-largest on record.
Historically, large ETF outflows have sometimes appeared near capitulation phases, but they also limit near-term upside by reducing institutional participation. Long-term holder data further shows accumulation slowing, removing a source of price support that has cushioned past declines.
Why $98–$108 Matters for Bulls
Looking ahead, analysts agree that any meaningful recovery must reclaim the $98–$108 region. This zone represents both former support and a psychological barrier near $100. February forecasts from several market trackers suggest $SOL could trade within this range if it stabilizes above current levels.
A sustained move above $108 could open the door to a broader trend reassessment, while repeated rejection would reinforce the prevailing bearish structure. Solana remains in a wait-and-see phase, with traders closely watching whether support holds, or whether another leg lower comes before a durable base is formed.
Cover image from ChatGPT, SOLUSD chart on Tradingview