

 Bitcoin's price continues to fall after a failed recovery since February 6, 2024. In the last 24 hours, the price of BTC has dropped nearly 3% and has fallen approximately 38% since mid-January 2024. After a rebound from $60,100 to $72,100, buying pressure has weakened and Bitcoin has reversed course and is falling again.
Technical signals warned of this early on, and current on-chain data confirms increasing selling pressure. The crucial question is: Will the $63,000 mark hold during the next decline, or will Bitcoin undergo a deeper correction?
The failed bear flag pattern and RSI divergence confirm the downtrend.
Following the sell-off in January 2024, Bitcoin has formed a bear flag pattern on the daily chart. This pattern forms when the price drops sharply and then recovers weakly within a narrow range – usually signaling a continuation of the downtrend rather than a strong recovery. From mid-January 2024, Bitcoin fell approximately 38% to nearly $60,130, then recovered to around $72,200 in early February 2024. This recovery created the flag within the bear flag pattern.
Since February 10, 2024, the price has broken through the support level below, confirming the failure of the bearish flag pattern. Momentum indicators had warned of this early on. The Relative Strength Index (RSI) measures buying and selling pressure. When the RSI rises but the price weakens, this is a potential sign of downward pressure.
From November 24, 2023 to February 8, 2024, Bitcoin consistently formed progressively lower highs, while the RSI formed slightly higher highs. 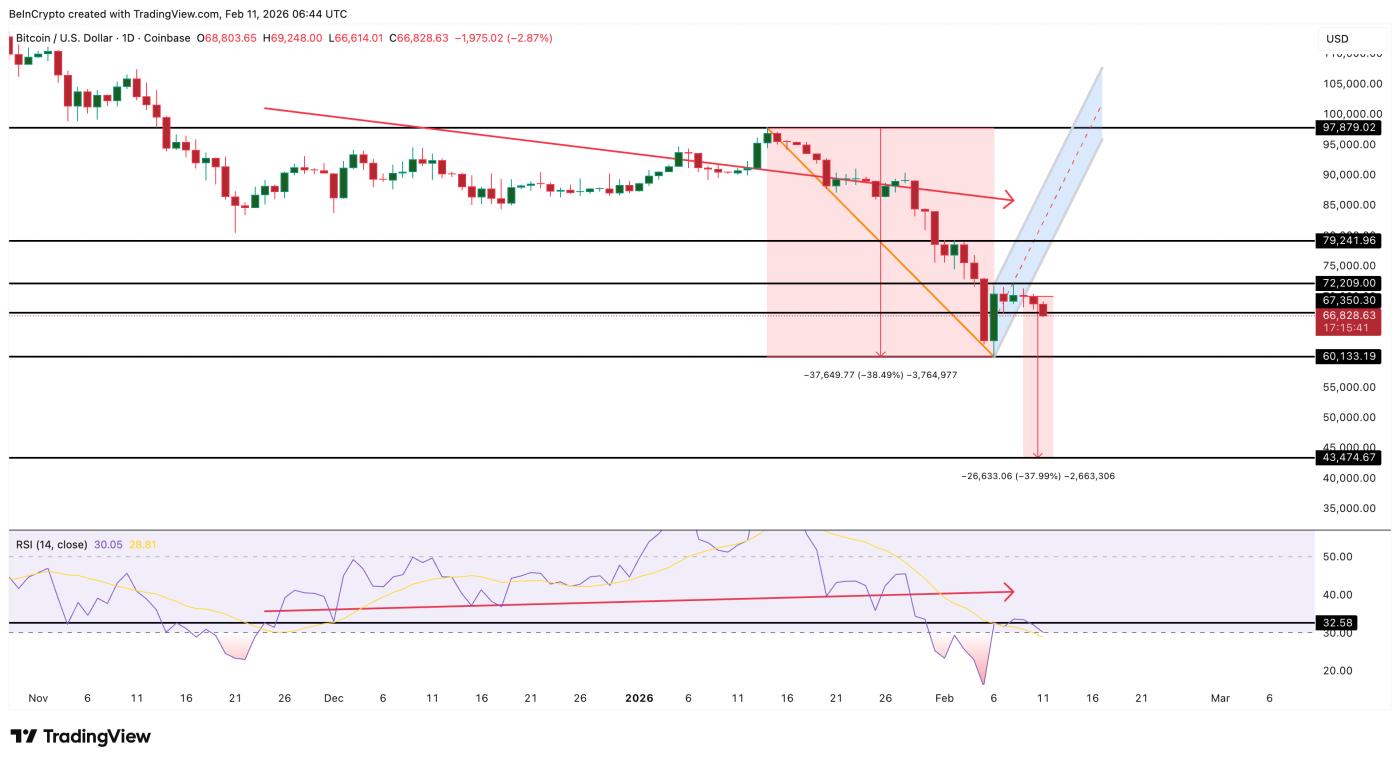 BTC chart shows a downtrend: TradingView
This is called a hidden bearish divergence, increasing the risk of a reversal after a rebound. When Bitcoin's price loses momentum, selling pressure returns to control the market. The decline occurred right when the RSI signaled divergence, leading to a pattern breakdown after the market exhausted itself. However, chart data doesn't fully reflect the situation; on-chain behavior will reveal who is driving this downward trend.
Those holding the shares sold them off when confidence weakened.
on-chain data shows that long-term investors are gradually reducing their holdings. One indicator to watch is Hodler Net Position Change, which tracks wallets holding coins for over 155 days to understand the buying/selling trends of medium-to-long-term investors over the past 30 days.
On February 9, 2024, this index was at approximately +8,142 BTC , but by February 10, 2024, it had dropped to approximately +5,292 BTC. This sharp 35% drop indicates that the buying trend in this group is slowing down and confidence is gradually waning.
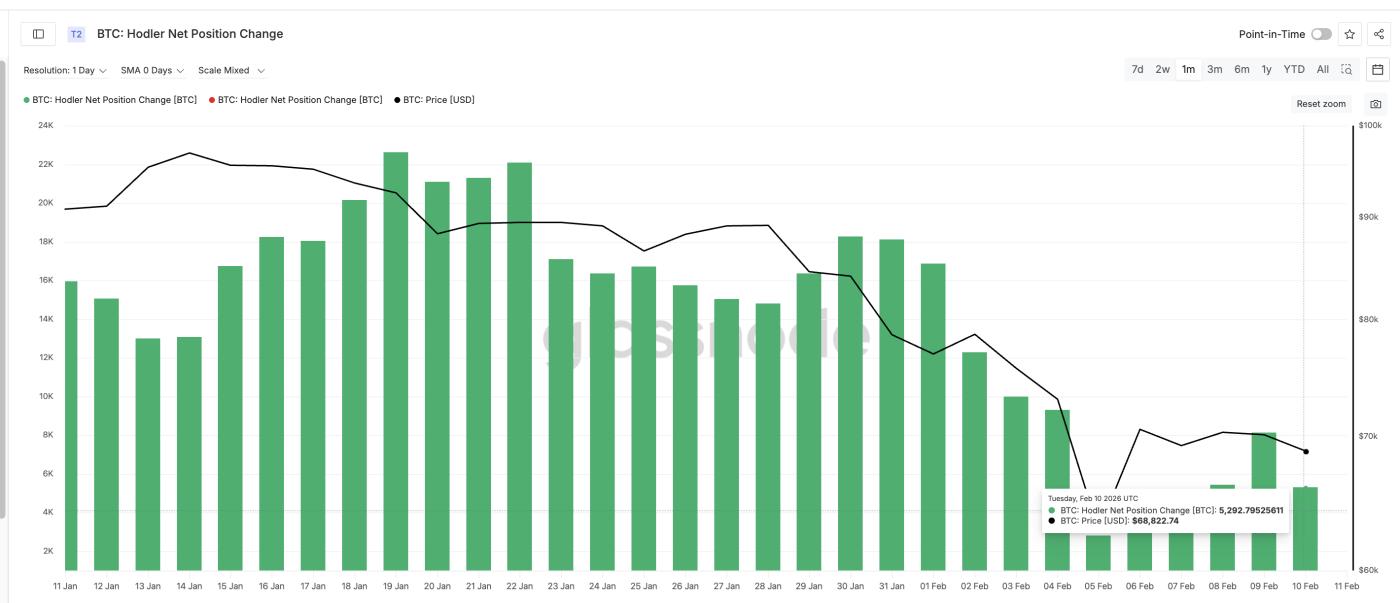 Medium-term investors reduced their buying: Glassnode
Simultaneously, selling pressure quietly increased. Another indicator is the Longing-Term Holder Net Position Change, which focuses on long-term wallets (typically holding for over a year). On February 9, 2024, this indicator was at approximately -157,757 BTC (a negative value means net selling). By February 10, 2024, this number had increased to approximately -169,186 BTC, a 7% increase. This suggests that long-term holders sold off more quickly.
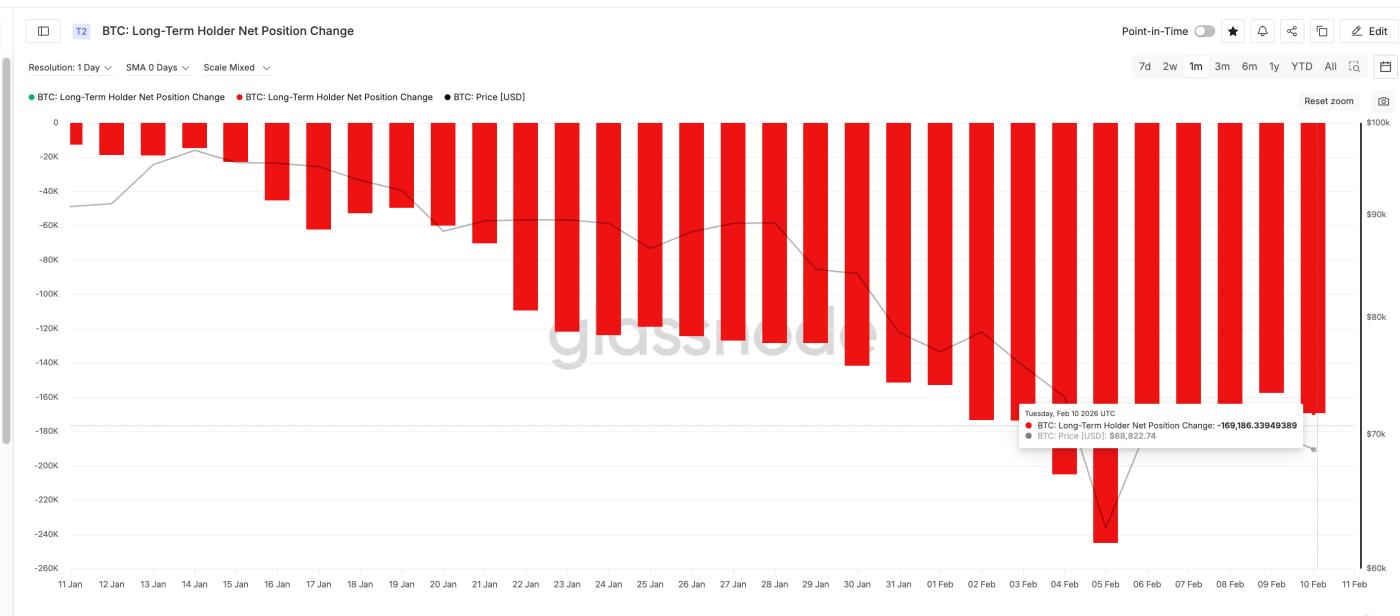 Long-term investors continue to sell: Glassnode
When both medium-term and long-term investors take profits, the downside risk increases. The HODL Waves indicator clearly shows this shift. This indicator shows how supply is allocated according to holding time. The 24-hour investor group typically consists of short-term traders who react strongly to price fluctuations.
From February 7th to 10th, 2024, the percentage of this group increased from approximately 0.72% to 1.02%. This represents a significant increase in supply, indicating a high potential for rapid turnover. This group typically sells when prices fall, making support levels more vulnerable to being broken.
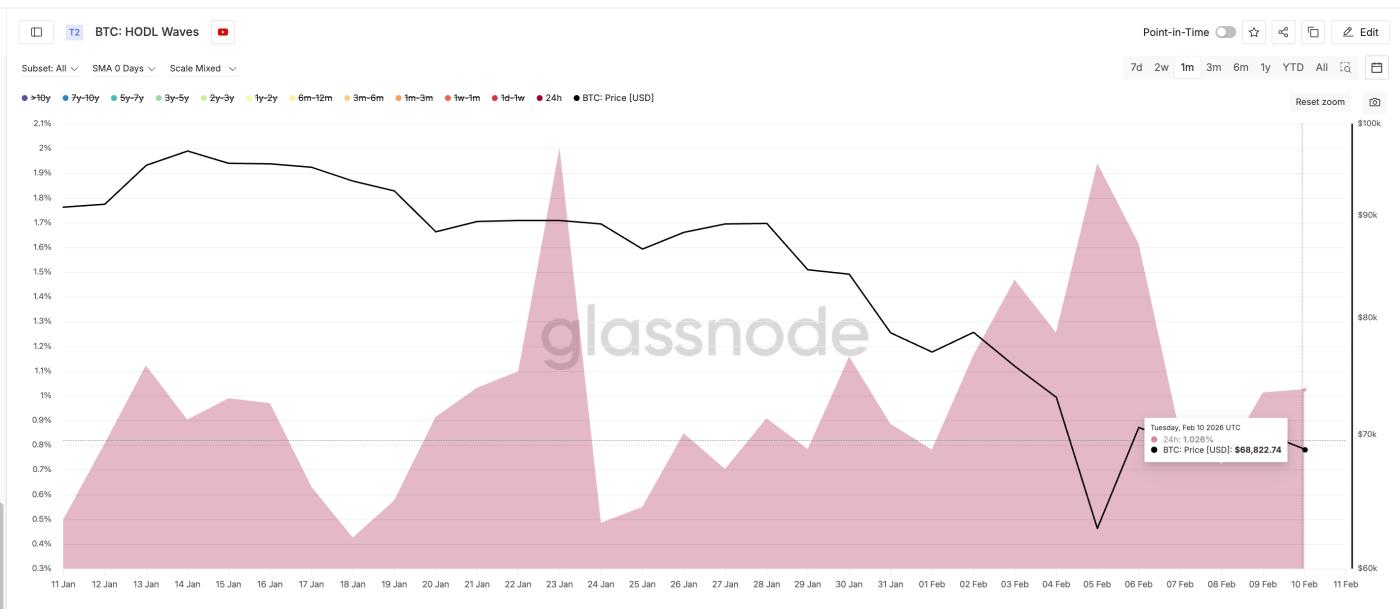 Speculative money is absorbing the supply: Glassnode
Long-term holders sell off their holdings, while short-term investors (speculative money) absorb the supply. This combination makes the market more unstable.
The $63,000 Capital level has become a crucial price zone for Bitcoin.
To identify potential support zones, traders often look at the UTXO Realized Price Distribution (URPD) indicator. This indicator shows at what price investors typically buy Bitcoin, thereby identifying areas of high buying costs – which often become support as investors defend the price they bought at.
Currently, the biggest support cluster is near the $63,100 mark. Approximately 1.3% of the total Bitcoin supply is concentrated around this price level. This makes the $63,000 area a crucial demand barrier. On the price chart, Bitcoin has lost the $67,350 mark and is gradually sliding towards this area.
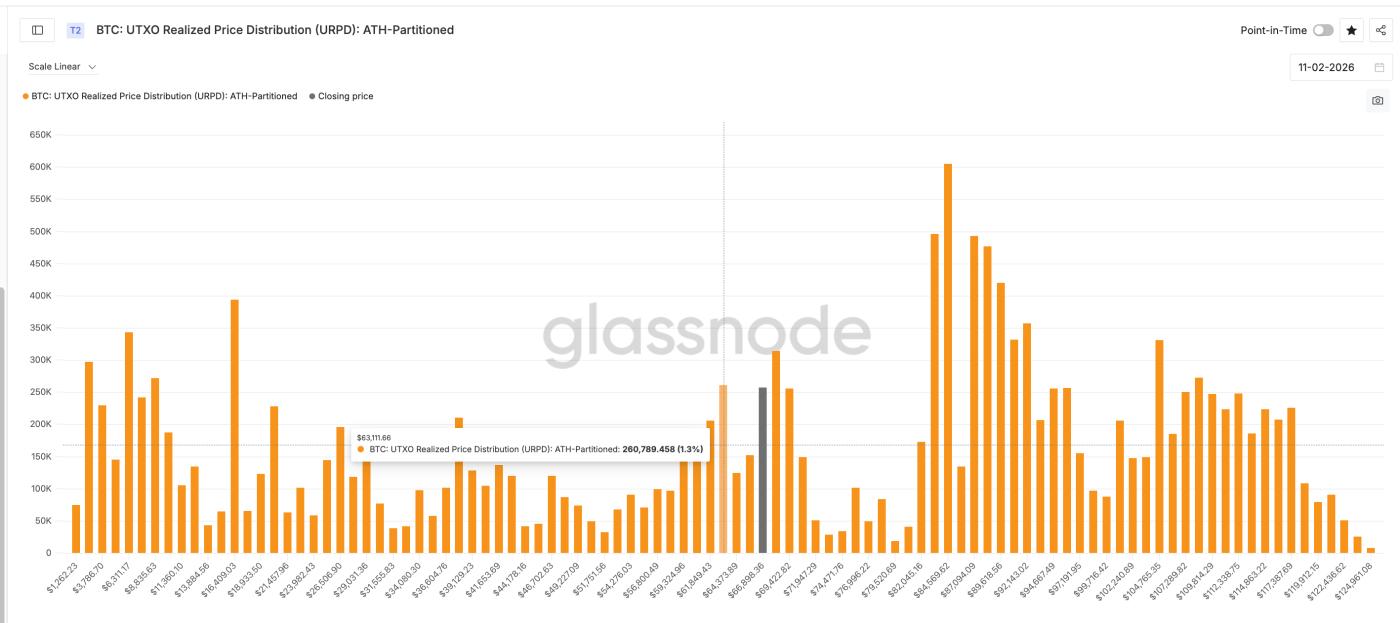 Key price ranges for BTC: Glassnode
If the $63,000 level (currently $63,240 on the chart) holds, buyers may try to stabilize the market as many retail investors are still at break- Capital. If the price breaks through this level, the risk will increase sharply. If it fails to hold, a large number of investors will suffer losses, and a massive sell-off could occur. If the $63,000 level is broken, the next major support zone is around $57,740, and if fear continues to spread, the price could retreat further to the $42,510 region.
This would completely reset the entire recent recovery momentum. Conversely, the recovery wouldn't be easy either. Bitcoin needs to break back above the $72,130 level to alleviate downward pressure. Only when the price rises above $79,290 will the short-term downtrend truly weaken. Before that happens, the price rallies are mostly technical rebounds.
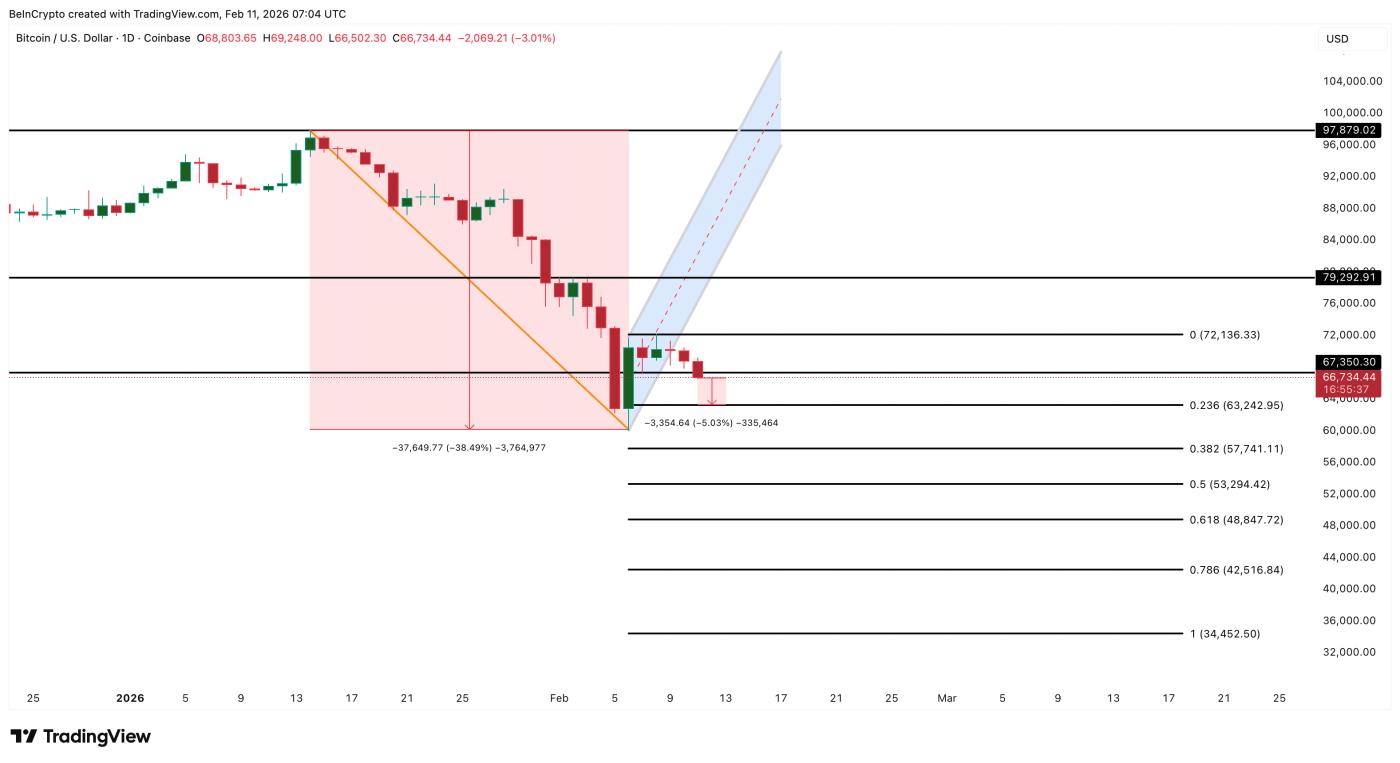 Bitcoin price analysis: TradingView
Currently, Bitcoin is caught between a lack of confidence and heightened speculation. The broken bearish flag pattern has pointed the way down, and selling by many retail investors is pushing the price further down. Now everything hinges on the $63,000 level. This is clearly the market's last line of defense.


