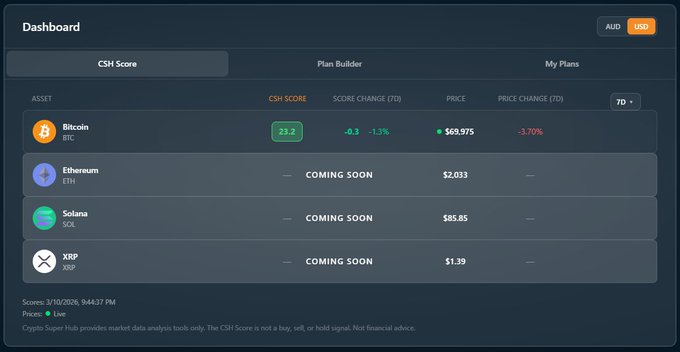
The CSH Score is sitting at 23.2 right now. For context: the score runs from 0 to 100. It measures where an asset sits relative to its long-term growth trend. Low scores mean the asset is trading well below trend. High scores mean it's overextended. 23.2 puts BTC right at the bottom of the accumulation zone, just above the 0-20 deep value threshold. Here's what that looks like alongside the sentiment data: Fear & Greed Index: 13 (Extreme Fear). That's among the lowest readings in Bitcoin's history, comparable to where the index sat during the FTX collapse. The only times it's been lower were the COVID crash in March 2020 (8) and earlier this year when it hit 5. BTC price: $69,958. Down -3.55% over 7 days BTC dominance: 59.4% ETH/BTC ratio: 0.029 In Issue #3, we flagged that BTC could see a bounce into early March based on the score positioning and historical bear market patterns. That played out almost exactly. BTC rallied from the low $60Ks to touch $74K before pulling back. The score doesn't predict price. But it gave us the context to know conditions were right for that bounce. Now it's back at 23. The last time the score sat here, it preceded one of the strongest accumulation windows of the cycle. If you have a plan active in the 0-45 range, it should be running. If you have a dynamic plan that triggers below 20, it's one bad week away from firing. This is what systems-based investing looks like in real time.
From Twitter
Disclaimer: The content above is only the author's opinion which does not represent any position of Followin, and is not intended as, and shall not be understood or construed as, investment advice from Followin.
Like
Add to Favorites
Comments
Share
Relevant content