In January of this year, gold hit a record high of $5,589. In less than two months, the price of gold fell to about $4,100, a peak retracement of 26.6%, marking the worst monthly drop in 43 years.
The direct transmission chain of this sharp decline is not complex. The US-Iran conflict entered its third week, with the Strait of Hormuz blocked, and oil prices had risen by more than 40% since the conflict began. According to data from the US Bureau of Labor Statistics, the February CPI hit a new high since last year, and coupled with the lagged effects of high tariffs, market concerns about inflation intensified sharply. The Federal Reserve, in its latest Summary of Economic Projections (SEP), narrowed its expectation of interest rate cuts in 2026 to only one, effectively signaling the end of the recent easing cycle. The US dollar index broke through the 100 mark, exerting comprehensive downward pressure on precious and non-ferrous metal prices.
But the macro narrative is only half the story. According to Finance Magnates analysis, the technical break below the 50-day moving average (approximately $4,978) triggered a massive sell-off of crowded long positions, with stop-loss and margin calls being triggered in cascading fashion. Gold had risen from $2,600 to over $5,000 in 12 months, with a large amount of leveraged capital accumulating in the long position. When the escalation of the conflict pushed up oil prices rather than gold prices, these crowded positions became the first to be sold off.
The price drop itself is not the story. The story is that this script of "geopolitical shocks driving up inflation and a concentrated clearing of leveraged trades" has played out at least three times in the past 46 years.
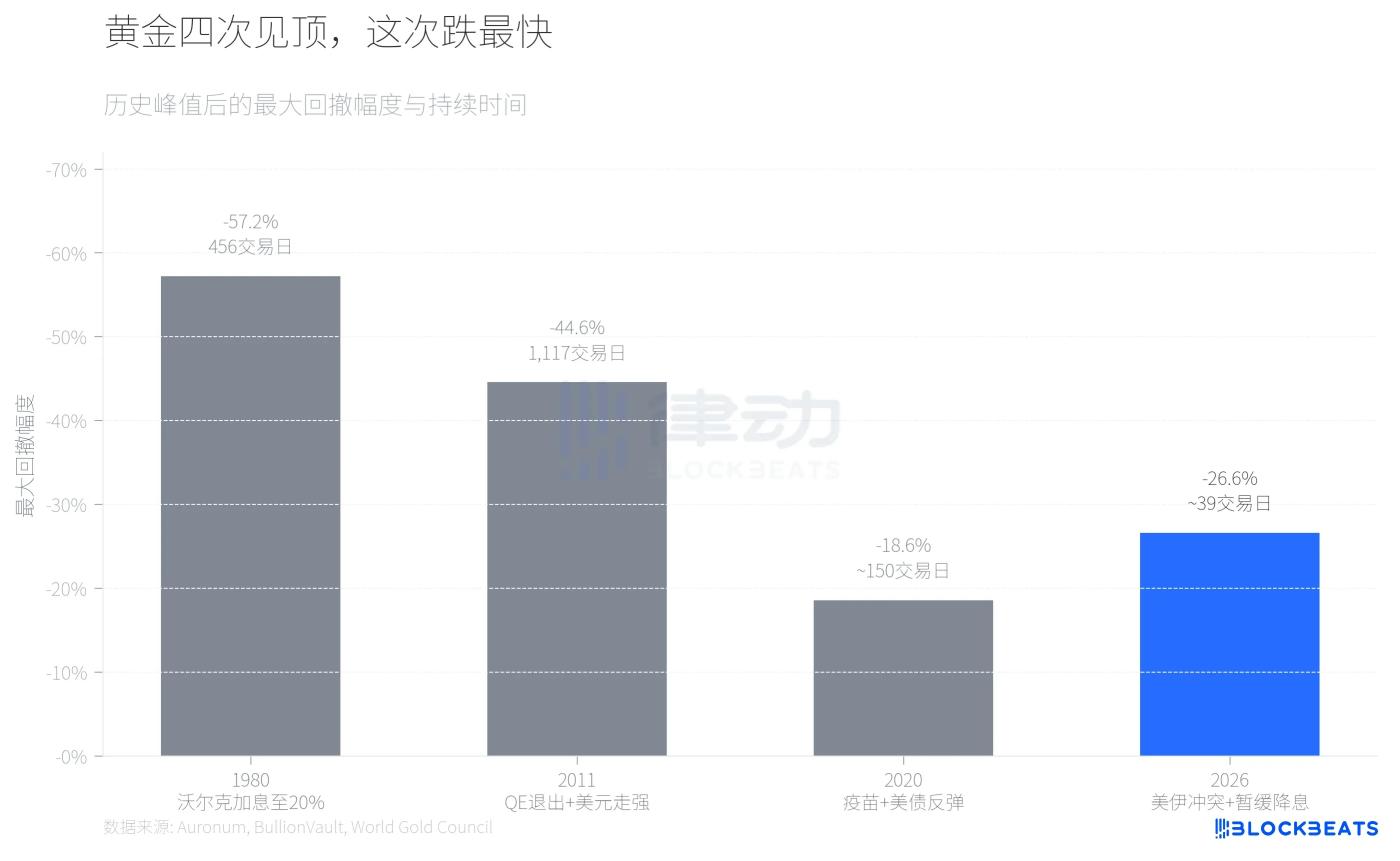
According to historical data compiled by precious metals analysis firm Auronum, in 1980, when Volcker pushed the federal funds rate to 20%, gold fell from a peak of $711 to $304, a drop of 57.2%, taking 456 trading days. In 2011, expectations of QE tapering coupled with a stronger dollar caused gold to fall from $1,999 to $1,049, a drop of 44.6%, taking more than four years. The correction in 2020 was relatively mild; the progress of vaccination and the rebound in US Treasury yields caused gold prices to fall 18.6% from a peak of $2,067, but it resumed its upward trend seven months later.
The correction in 2026 is currently down by about 27%, which has already exceeded that of 2020 and is approaching that of 2011. But in terms of speed, it is the fastest of the four.
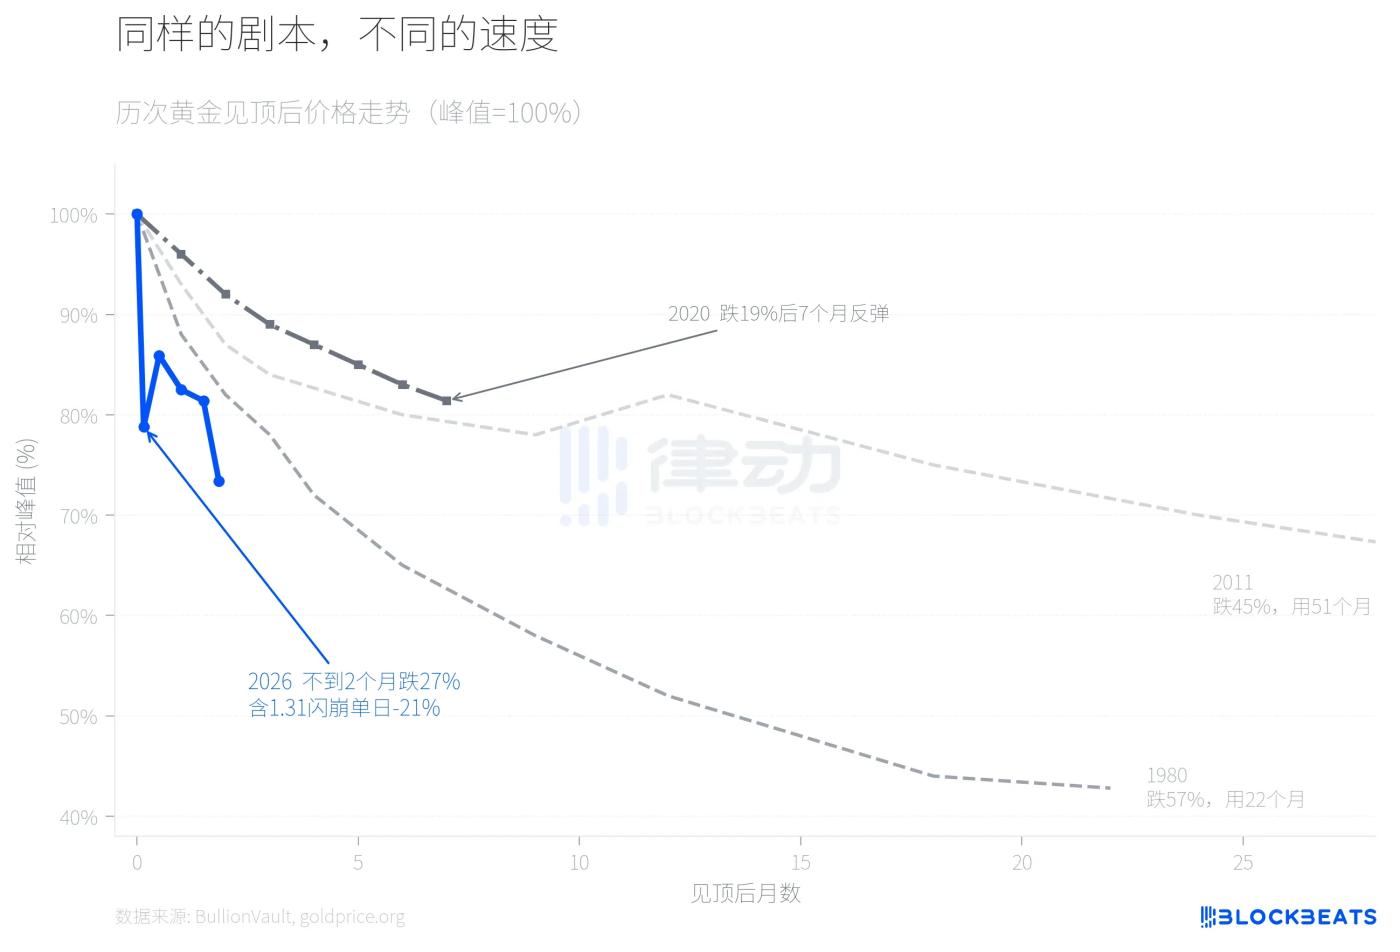
By overlaying the price movements of the four pullbacks, the differences become immediately apparent. In 1980, it took nearly two years to complete the major decline, while in 2011 it took over four years. In 2026, gold prices completed a 21% retracement on the fifth trading day after peaking, followed by a brief rebound, but then accelerated their decline again in the third week of March to around $4,100, with the cumulative drop widening to 27%. The flash crash on January 31st was the turning point. According to data from BullionVault, the world's largest precious metals trading platform, gold fell by more than 10% that day, silver plummeted 13.7%, and the iShares Silver ETF (SLV) saw a single-day trading volume exceeding $40 billion, ranking among the highest single-day trading volumes in US securities history. Bruce Ikemizu, former head of precious metals at ICBC Tokyo, commented that in his 40 years of observing the market, he had "never seen this level of volatility."
Why was the pace unusually fast this time? A key variable was the CME's change on January 13th from a fixed margin requirement to a percentage-based margin system for COMEX contracts. According to CME Group data, gold futures margins increased from 8% to 9%, and silver from 15% to 18%. In a rapidly rising market, percentage-based margins mean that the higher the price, the more margin is required, creating a self-reinforcing deleveraging mechanism. According to goldsilver.com, over 67 million ounces of silver paper contracts were forcibly liquidated within minutes of the flash crash.
The performance of silver is an aspect that has been overlooked in this round of sharp declines.
In April 2025, the gold-silver ratio once exceeded 100:1, with silver significantly lagging behind gold. Subsequently, silver began a surge, with an annual increase of 147% (compared to gold's 67% during the same period). The gold-silver ratio compressed all the way, and when silver reached a peak of $121.67 per ounce, the ratio dropped to about 46:1, the lowest level since 2013.
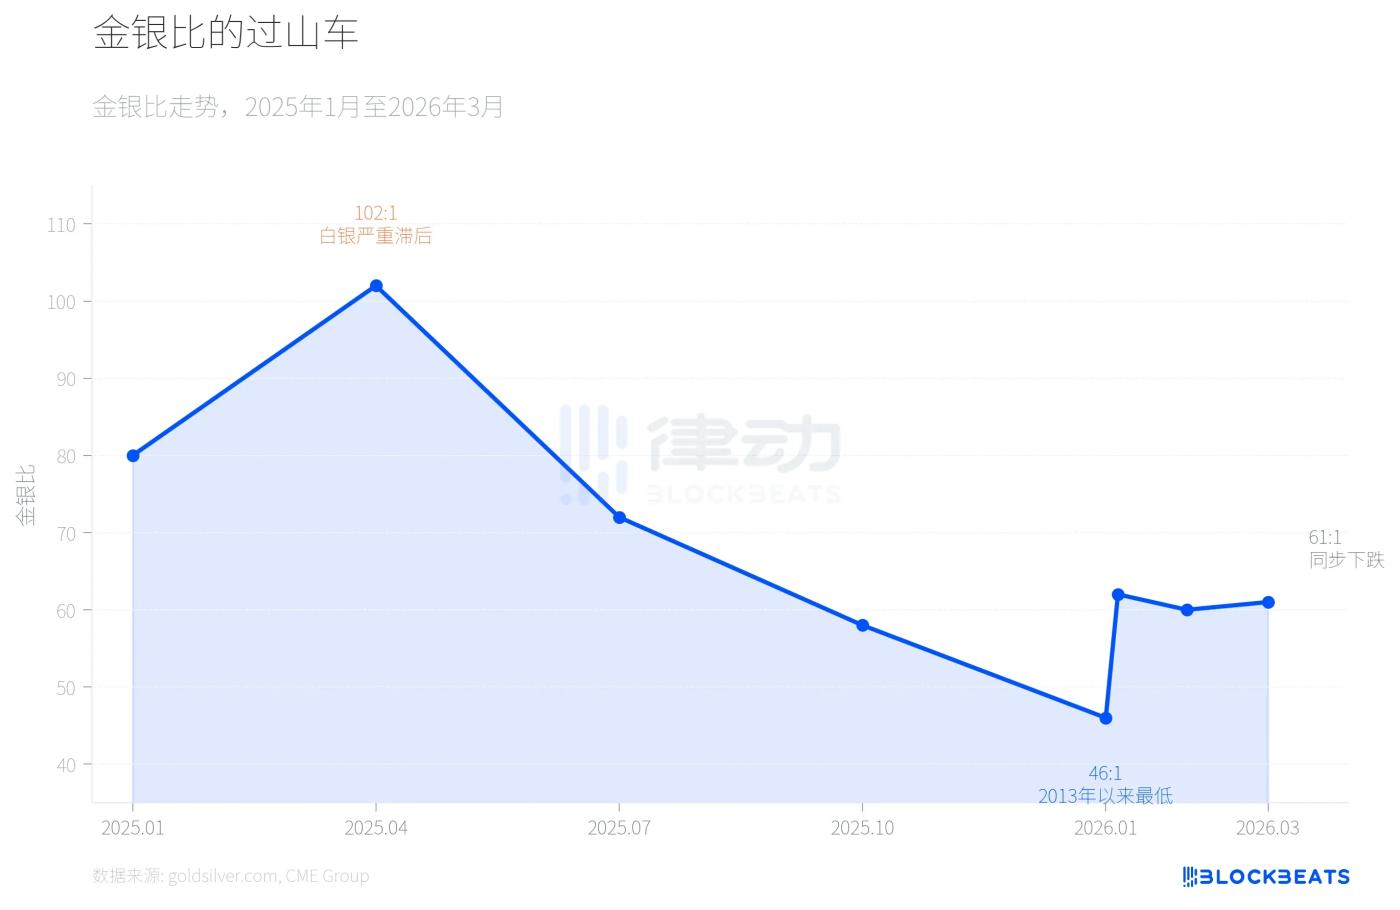
Then everything reversed on January 31st. According to the platform's data, silver plummeted 13.7% in a single day, with a cumulative drop of 41.1% from its peak of $121.67, far exceeding gold's 26.6% drop during the same period. This was a rare single-day fluctuation in precious metals since the Hunt brothers' incident in 1980 ("Silver Thursday"). As of March 23rd, silver was trading at approximately $67.4, and the gold-silver ratio had rebounded from a low of 46:1 to approximately 61:1. Silver's gains, which took nine months to accumulate, were largely wiped out in less than two months.
The core reason for this asymmetry lies in the dual nature of silver. On the one hand, according to a CME Group research report, photovoltaic panel production capacity increased by 18% year-on-year, indicating that industrial demand for silver is still structurally expanding. On the other hand, the leverage ratio in the silver market is far higher than that of gold, and the CME's increase in margin from 15% to 18% directly triggered large-scale forced liquidations. The industrial fundamentals remained unchanged, but financial leverage collapsed first.
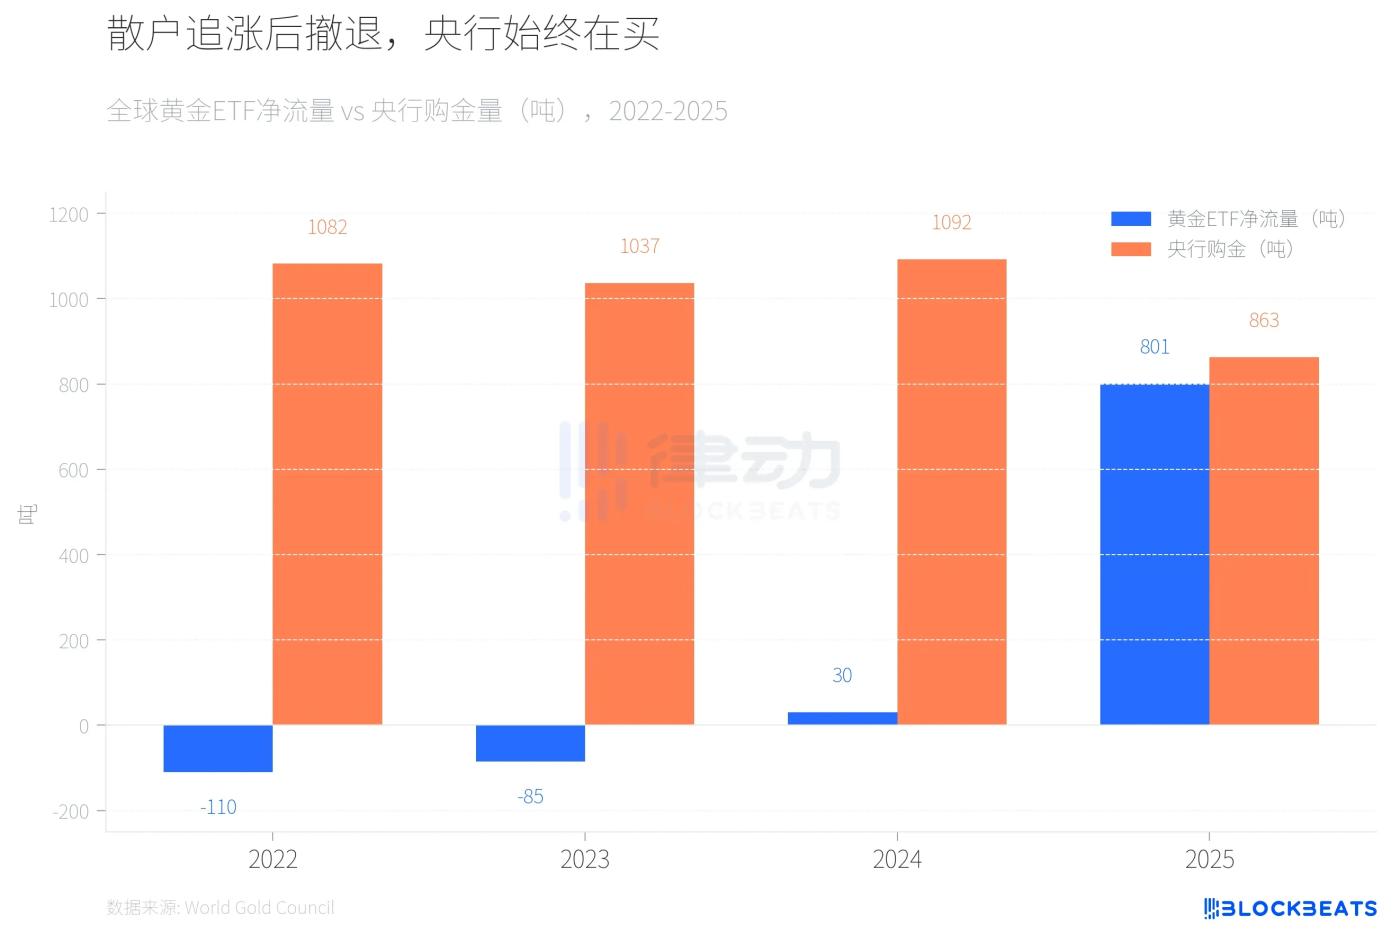
The last noteworthy signal is the divergence in capital structure.
In 2022 and 2023, global gold ETFs experienced net outflows for two consecutive years (-110 tons and -85 tons respectively), while central bank gold purchases exceeded 1,000 tons for both years. In 2024, ETF inflows turned positive, but the scale was small (30 tons), and central banks continued to buy at a high level of 1,092 tons. The situation changed dramatically in 2025. According to data from the World Gold Council, global gold ETFs saw a record net inflow of 801 tons throughout the year, doubling their assets under management to $559 billion.
Then retail investors started fleeing. According to the Canadian business media outlet *Chronicle Journal*, the SPDR Gold Trust (GLD) experienced a net outflow of $2.91 billion on March 4th, marking the largest single-day outflow since 2016, with 25 tons of gold lost in seven days. Meanwhile, according to the institution's annual report, global central banks will purchase 863 tons of gold in 2025, a 21% decrease from 2024, but still significantly higher than the 2010-2021 average (473 tons). The same report shows that the Polish central bank remains the world's largest buyer for the second consecutive year, purchasing 102 tons, followed by Kazakhstan (57 tons) and Brazil (43 tons).
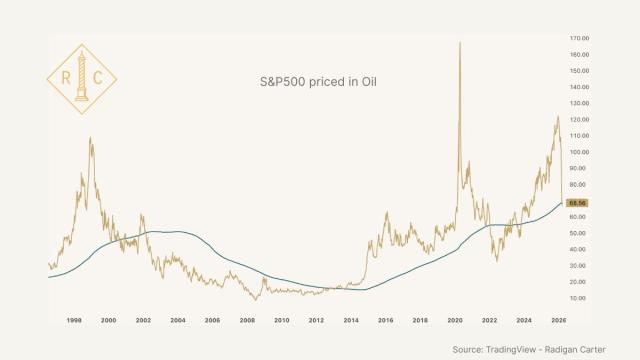
According to a March research report by JPMorgan Chase, the bank maintained its target price of $6,300 for gold by the end of 2026. However, according to the IEA's March oil market report, the closure of the Strait of Hormuz has led to a reduction in global crude oil supply of approximately 8 million barrels per day, equivalent to nearly 8% of global demand. The IEA called it "the largest supply shock in the history of the global oil market," and member countries have initiated the largest release of 400 million barrels of strategic reserves in history.
For central banks in oil-importing countries, responding to oil price shocks may be a higher priority than continuing to increase their gold holdings. During the previous three gold price peaks, global central banks were not net buyers of gold. They bought 863 tons in 2025, but the figure for 2026 is still unknown.