Crypto Expert: Bitcoin's surge and subsequent pullback to 71,000 on March 24th – Is it a buying opportunity or a bull trap? Latest market analysis and strategy.
Bitcoin is currently priced at 70,900. My private messages have been flooded with messages saying it jumped from 67,300 to 71,700, a more than 4% increase in one day. Many people have been asking me: "Academician, is this a reversal? Can we buy in?" I'll be blunt: This wave is a combination of oversold correction, short covering, and news-driven stimulus, not a trend reversal! Those who blindly chase the highs will most likely be trapped at the peak!
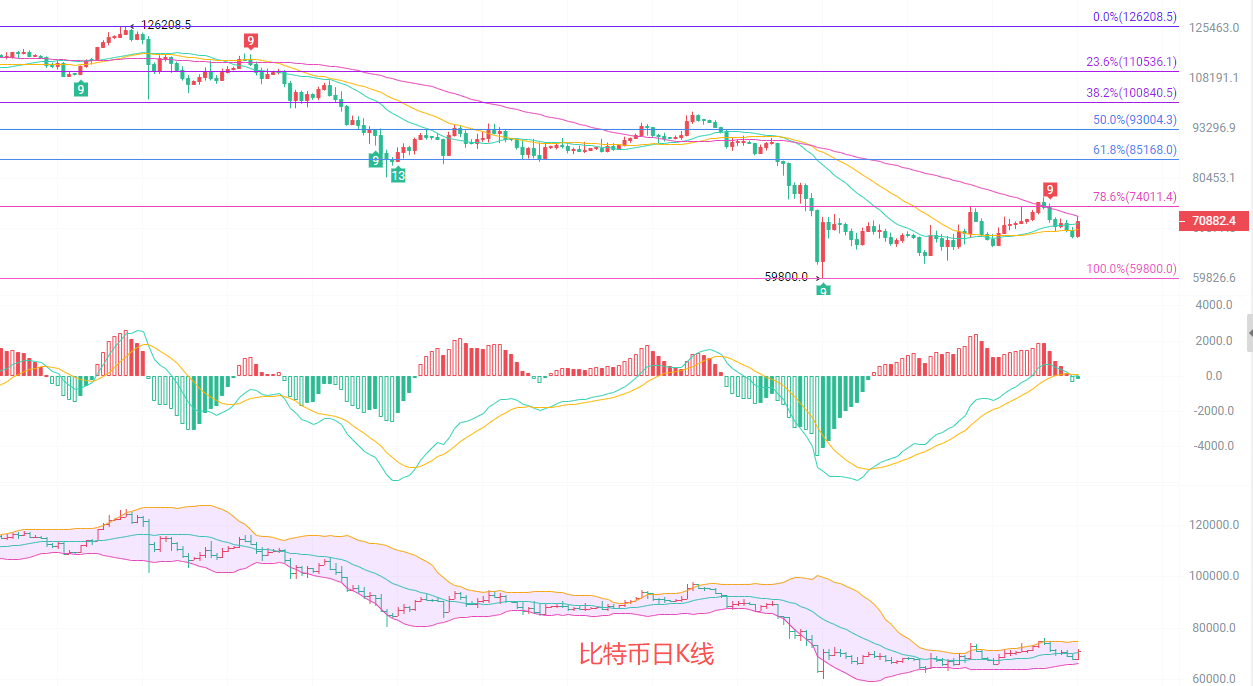
The daily chart remains within a downtrend framework, making this rebound's nature quite clear. The price rebounded from the low of 59800 and is currently touching the 0.786 Fibonacci retracement level below 74011. It hasn't broken the downtrend line since 75998, representing a technical correction after an oversold condition, and hasn't broken out of the overall downtrend framework. The MACD histogram is narrowing, with the DIF about to cross above the DEA, but still below the zero line, indicating that northbound momentum is still building and far from a strong breakout. The price has risen above the 20-day and 30-day moving averages, but the 60-day moving average at 71936 is acting as resistance. The southward trend of the moving averages hasn't been broken, and the overall trend remains southward.
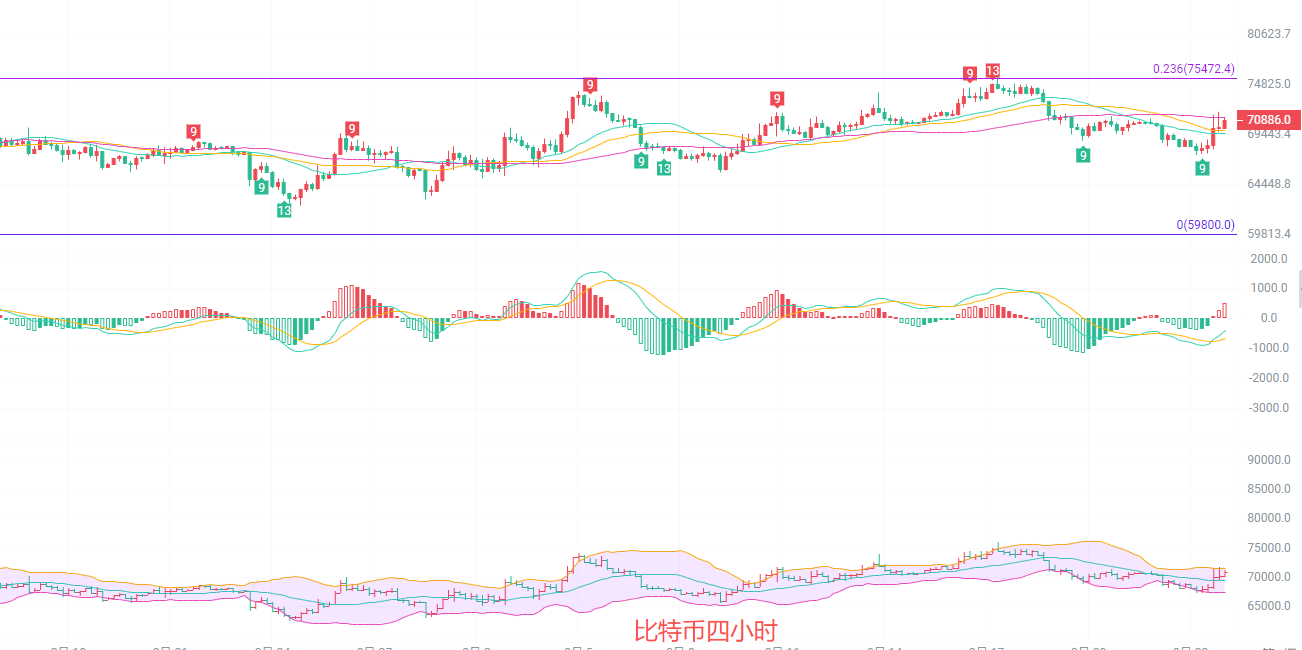
The four-hour chart shows a short-term surge, revealing underlying short-term trends. The price jumped from 67300 to 71700, breaking through the upper Bollinger Band before quickly falling back. It's currently consolidating around 71000, a typical pattern of a sharp rise followed by profit-taking at higher levels. The MACD golden cross has resulted in increasing red bars, but the DIF has just touched the zero line, indicating exhausted upward momentum and a lack of follow-through buying. A sharp drop is possible at any time. The resistance level is 72000, and the support level is 69000. The longer this range-bound movement lasts, the more severe the subsequent decline will be. Manage your risk carefully.
Short-term trading strategy: Follow the long-term trend, use small stop-loss orders, and trade quickly.
The price will move northward in batches from 69000 to 69500, with a stop loss at 68500 and a target of 71000 to 71500.
The price is expected to move south in batches from 71500 to 72000, with a stop loss at 74000. The target is 70000 to 69500. If the price breaks below 69500, the next target is 68500 to 68000.
In the crypto, those who are prescient reap the rewards, those who are slow to react get the scraps, and those who are oblivious are left holding the bag.
For specific operations, please refer to real-time market data. For more information and details, please contact the author. There may be a delay in article publication; this advice is for reference only, and you assume all risk.