
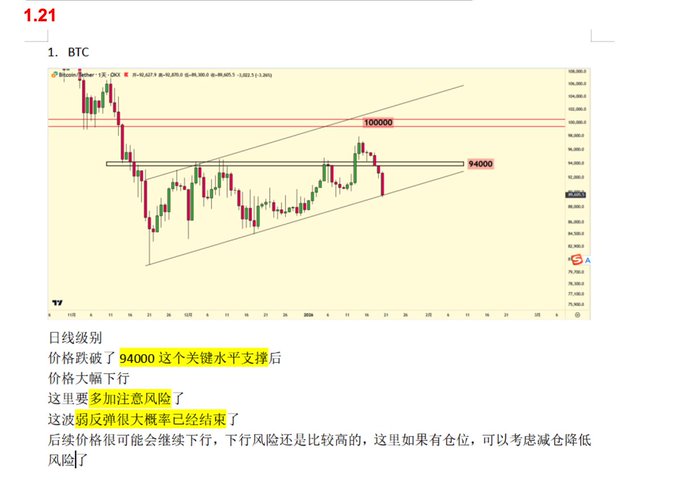
Let's elaborate on the signals from two key decisions over the past three months: 1. Regarding the sell signal after the price broke below 94,000 in January, a more comprehensive assessment suggests we actually cleared our positions around 100,000 (x.com/0xBFRuby/status/19892131...…)但是94000这里的反弹终止给后续的加速下跌指标上给了双击判断). In the early January rally, 94,000 was initially a key horizontal resistance level. After the price broke through this level, according to the principle of support and resistance interchange, 94,000 became a key horizontal support level. Around January 20th, the daily chart not only broke below this key support but also formed a small upward parallel channel during the subsequent rebound. Given the generally weak long-term trend, such a weak rebound channel is often a bearish continuation pattern. When the price broke below the lower boundary of this channel again, the rebound was confirmed to have ended, thus the system gave a clear sell signal and a bearish outlook.
This article is machine translated
Show original

Ruby
@0xBFRuby
03-26
在正式分享之前,我认为有必要先做一次完整的数据回测复盘,以帮助大家更好的理解怎么看待这些指标。技术分析的胜率与最终的账户盈亏,往往并不呈简单的正相关。 x.com/GracyBitget/st…
Sector:
From Twitter
Disclaimer: The content above is only the author's opinion which does not represent any position of Followin, and is not intended as, and shall not be understood or construed as, investment advice from Followin.
Like
Add to Favorites
Comments
Share
Relevant content


