

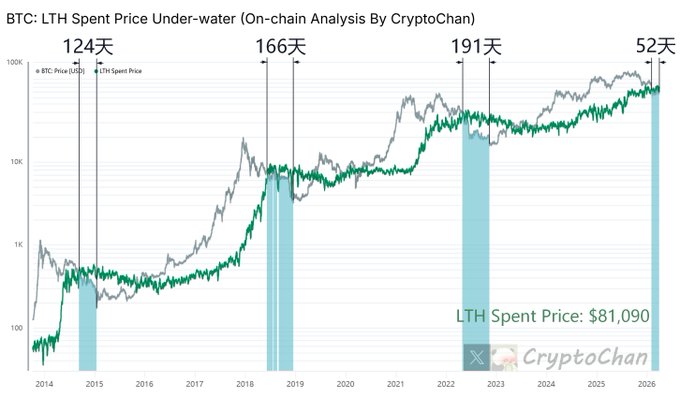
【Four-Year Cycle Series (27)】 2014 #BTC underwater for a cumulative 124 days to the bear market bottom 2018 #BTC underwater for a cumulative 166 days to the bear market bottom 2022 #BTC underwater for a cumulative 191 days to the bear market bottom This round has so far seen #BTC underwater for a cumulative total of approximately 52 days ┌── 📑 𝗗𝗲𝗲𝗽 𝗗𝗶𝘃𝗲 | Indicator Details ──┐ The gray line in the chart represents the Bitcoin price The green line in the chart represents the Bitcoin long-term holder's spending price, which is the average purchase cost of Bitcoin long-term holders selling their holdings over a period of time (e.g., 7 days) When the gray line is lower than the green line, it is defined as BTC underwater.
This article is machine translated
Show original

CryptoChan
@0xCryptoChan
03-26
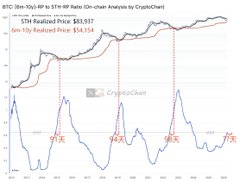
【四年周期总刻系列(26)】当前该指标升至 0.65
2014年该指标升至 0.65,91天 后黑线死叉红线
2018年该指标升至 0.65,94天 后黑线死叉红线
2022年该指标升至 0.65,98天 后黑线死叉红线
┌── 📑 𝗗𝗲𝗲𝗽 𝗗𝗶𝘃𝗲 | 指标详情 ──┐
图中上方灰线为 #BTC x.com/0xCryptoChan/s…
Sector:
From Twitter
Disclaimer: The content above is only the author's opinion which does not represent any position of Followin, and is not intended as, and shall not be understood or construed as, investment advice from Followin.
Like
Add to Favorites
Comments
Share
Relevant content


