$XRP erased more than $30 billion in market capitalization during the first three months of 2026, marking one of the most turbulent stretches for the cryptocurrency.
Its capitalization declined from $111.58 billion on January 1 to $81.12 billion by March 31, a drop of $30.46 billion. The losses also saw $XRP regularly slip in the crypto rankings, falling to the fourth spot behind BNB.
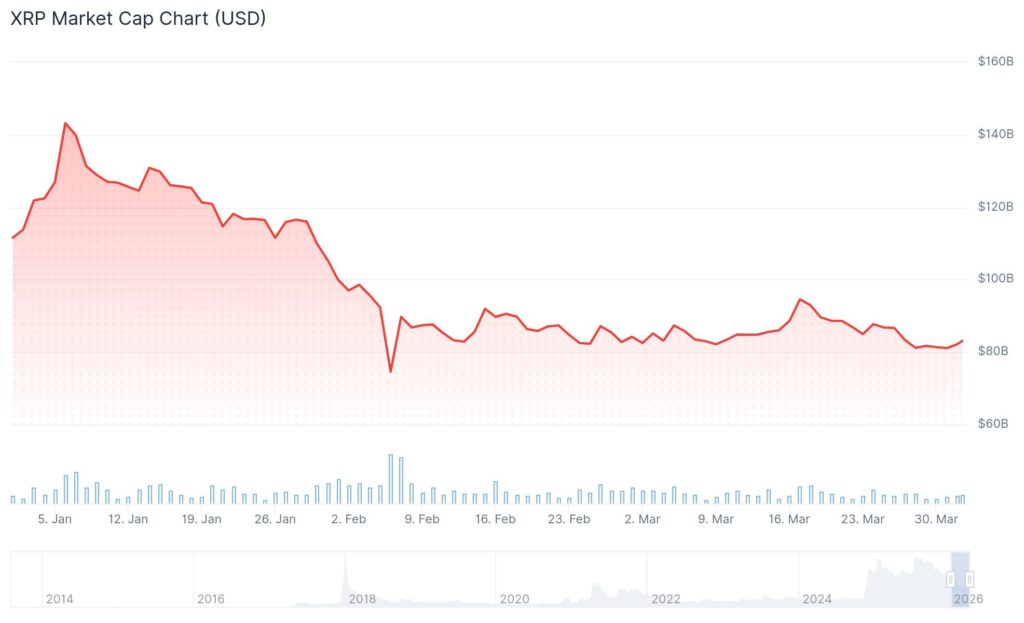
The decline was reflected in price action, with $XRP plunging about 26% year-to-date at $1.35 as of press time.
The quarter opened strongly, with $XRP’s market value peaking at $143.24 billion on January 6 before reversing sharply to $74.62 billion by February 6. Although prices staged a modest recovery afterward, it was not enough to offset the broader losses.
Why $XRP price has struggled in 2026
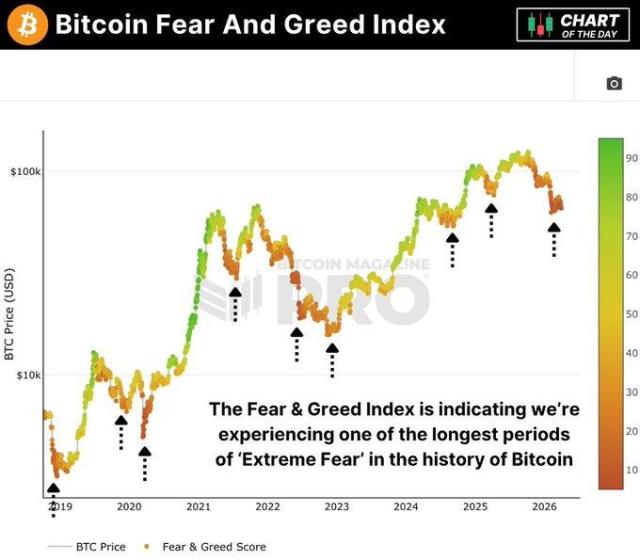
Much of the downturn reflected $XRP’s tight correlation with Bitcoin (BTC), at about 0.84 during the period. As Bitcoin fell below $70,000 in early February, its lowest level since late 2024, $XRP saw amplified moves, trading roughly 1.8 times more aggressively and pulling the wider altcoin market lower.
The sell-off was exacerbated by over $2.2 billion in liquidations, which triggered cascading declines as stop-loss orders accelerated the drop and broke key support levels.
At the same time, momentum from spot $XRP ETFs launched in November 2025 began to fade. While the seven funds drew a combined $1.44 billion by late March, inflows slowed to their lowest levels in February, signaling waning demand.
Technical indicators added to the weakness, with $XRP falling below its 200-week EMA, forming a death cross, and repeatedly failing to hold support at $1.60 and $2.05. Interestingly, seasonal trends also weighed, as February is historically a weak month.
Broader macro pressures, including Middle East tensions, rising oil prices, and uncertainty around Federal Reserve policy, further dampened risk appetite for cryptocurrencies.
$XRP flashes breakout potential
Meanwhile, technical indicators suggest $XRP may be laying the groundwork for a potential rally after weeks of consolidation.
To this end, analysis by Ali Martinez in a March 31 X post points to an ascending triangle pattern on the monthly chart, a structure typically seen as a bullish continuation signal, marked by rising support and steady resistance.
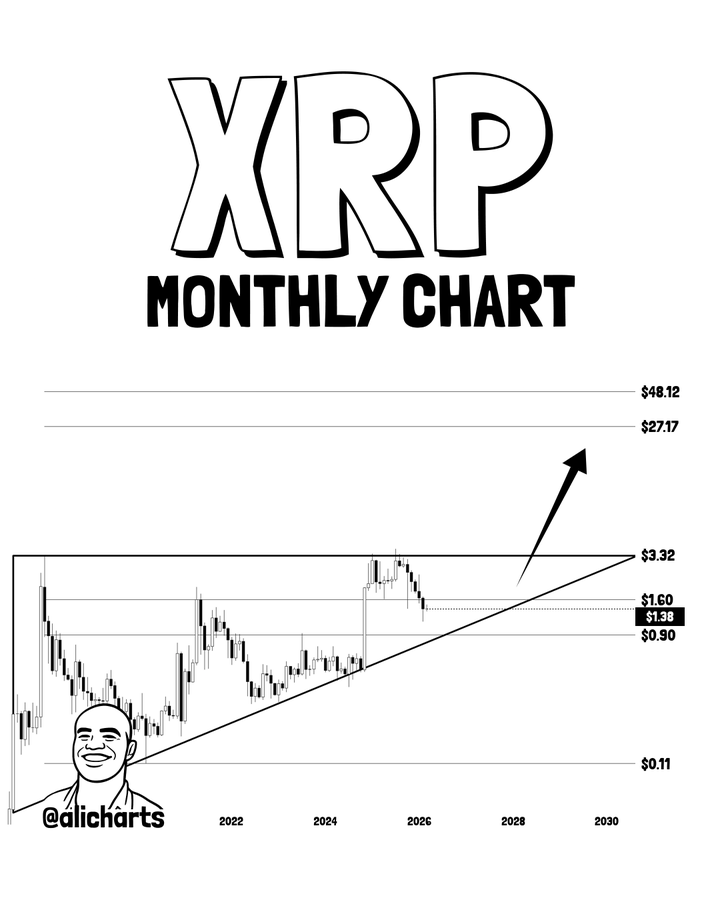
Per the analysis, $XRP’s price action reflects growing demand, with buyers stepping in at higher levels while sellers struggle to push prices lower. Key levels include historical support near $0.11, a consolidation range between $0.90 and $1.60, and major resistance at $3.32, its 2018 all-time high.
Beyond this, the analysis outlines upside targets of $27.17 and $48.12, based on technical projections rather than past price action.
If the pattern holds, $XRP could offer a short-term buying opportunity near rising support, with a breakout above resistance likely to strengthen bullish momentum.
Over the longer term, the setup points to a sustained uptrend, though it remains sensitive to broader market conditions, particularly Bitcoin’s influence on altcoins.