$XRP currently faces a make-or-break moment, but it must hold above the July 2023 peak to maintain the current Elliott Wave structure.
$XRP has continued to face sustained declines, down more than 26% this year alone. Amid the ongoing downtrend, data shows $XRP has not displayed the sort of bullish diagonal setup recorded by other altcoins, placing it in a make-or-break situation at the moment.
Key Points
- $XRP remains below the key resistance zone between $1.40 and $1.50, which must be reclaimed for bullish continuation.
- The current price structure consists of three-wave patterns rather than a five-wave impulse, indicating a corrective and weaker market phase.
- A confirmed higher timeframe close above $1.50 could signal the start of stronger upward momentum.
- If $XRP loses its current support, data highlights downside targets near $1.146 and $0.884.
- The broader bullish structure remains valid only if $XRP holds above the critical $0.93 level, which acts as the main invalidation point.
$XRP In a Make-or-Break Position
Market watcher Hov revealed this in a recent analysis, pointing out that $XRP is not showing the same strength as other altcoins.
While some cryptocurrencies have formed clear upward patterns from their recent lows, $XRP has not followed that path. Instead, its price movement has remained uneven during the current market slowdown.
Hov had earlier expected $XRP to push higher and complete a fifth wave from its recent bottom, which would have confirmed a stronger upward trend. However, this move has not happened. $XRP continues to trade in a way that lacks strong momentum instead of moving with a clear direction.
This puts the asset in a delicate make-or-break position. According to Hov, $XRP is now trying to hold an important support level on the higher timeframes, but without stronger buying pressure, the risk of further decline remains.
$XRP Price Structure Points to a Corrective Phase
Hov’s chart shows that $XRP’s movement from its recent low is made up of smaller three-wave patterns instead of a strong five-wave move. These three-wave moves, which he labeled as W-X-Y, usually suggest a temporary bounce rather than a full trend reversal.
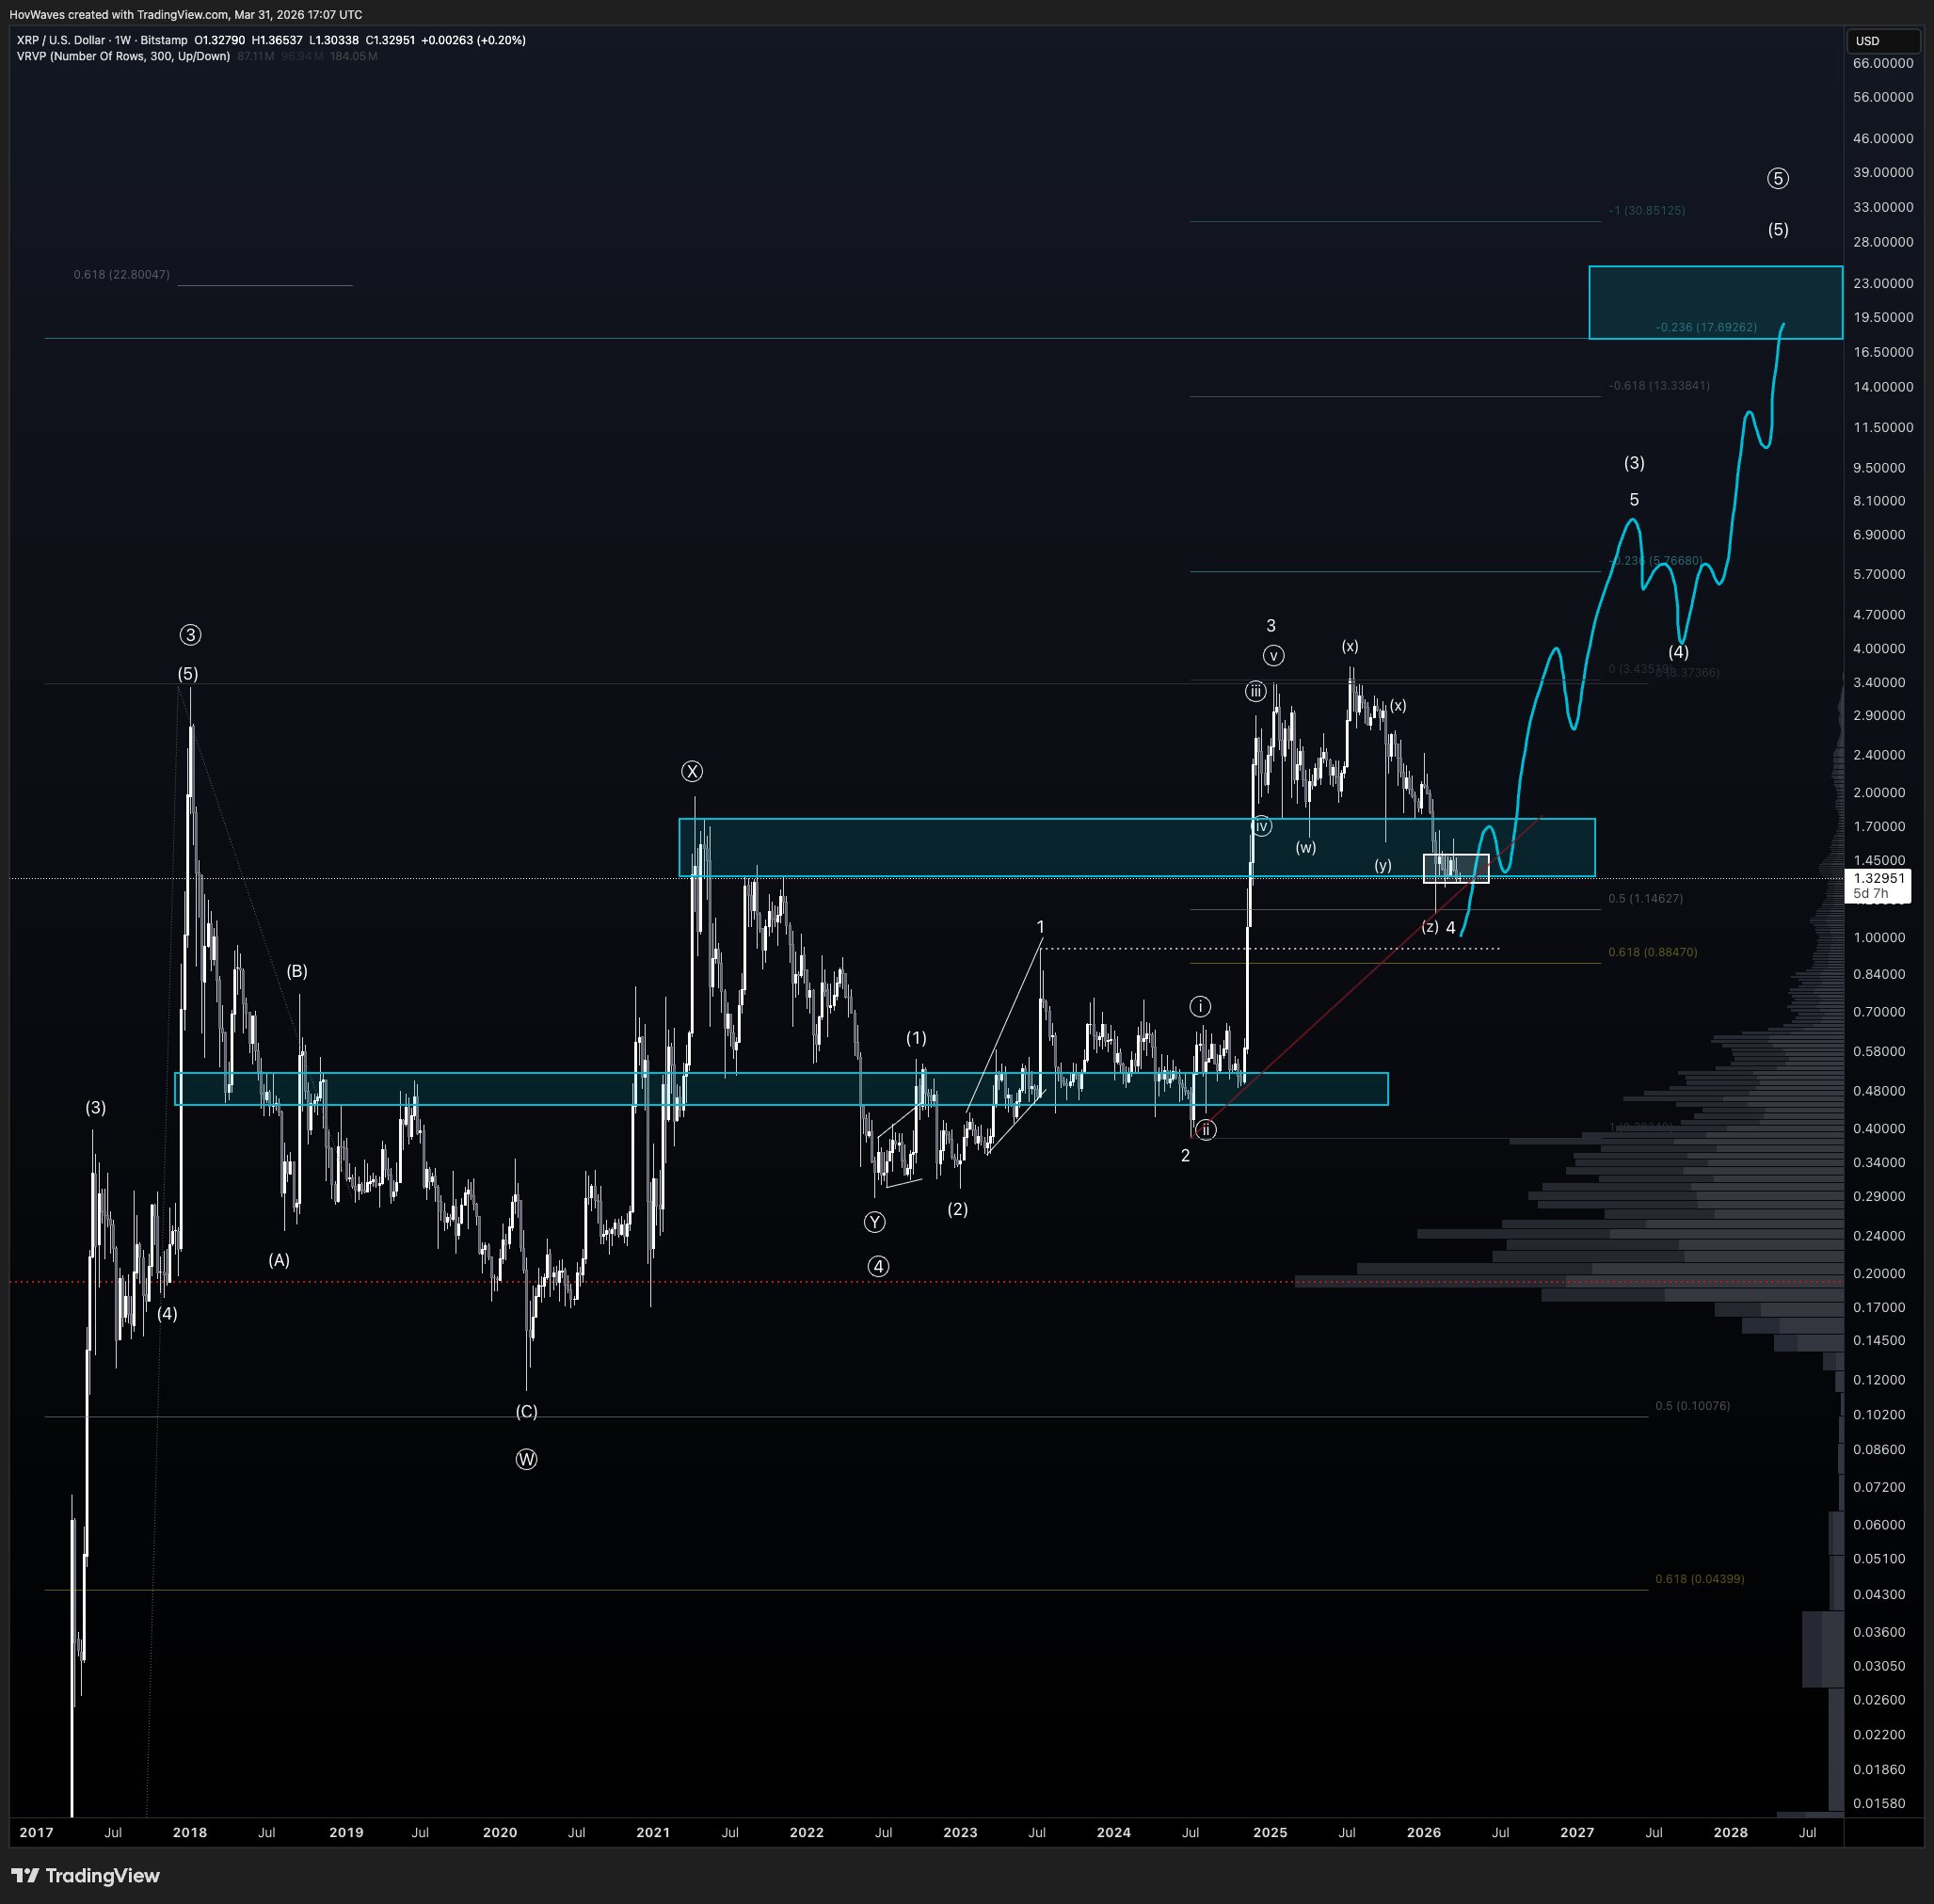
The chart shows several of these corrective waves, including (w), (x), and (y). For context, these patterns indicate choppy and overlapping price action, which often shows uncertainty in the market. Hov sees this as a sign that $XRP is still in a correction phase, not starting a strong upward move.
Despite this, he confirmed that he does not rule out a recovery. The analyst clarified that $XRP still has a chance to turn things around, but it needs to act quickly. If the price continues moving in this weak structure, the chances of a drop become higher.
The $1.50 Level Remains the Key Barrier
Hov highlighted a major resistance zone around $1.50, which he identified on the chart as a box ranging roughly between $1.40 and $1.50. $XRP is currently trading around $1.33, which places it just below this important level. According to him, this area will decide the next major move.
If $XRP manages to break above $1.50 and close there on a higher timeframe, it could indicate a positive change in momentum. In this case, the price could move toward $1.80, which aligns with earlier expectations for a continuation higher.
However, if $XRP fails to reclaim this zone, the current weakness may continue. Hov warned that the price is only just holding above key support, and losing it could lead to further downside. The chart also shows nearby support levels at $1.146, which marks the 0.5 Fibonacci level, and $0.884, which aligns with the 0.618 level.
$XRP Must Hold Above $0.93
Hov clarified that the downside risk has not gone away. If $XRP closes below its current support zone on a higher timeframe, the chances of a deeper drop increase. The volume profile on the chart also shows less support below the current price, which could allow the price to fall faster if selling pressure grows.
The broader chart shows that $XRP has struggled in the past to maintain upward moves after sharp rallies. The current setup looks similar to previous periods where the price moved sideways or lower after failing to build strong momentum.
Hov’s chart suggests that $XRP trades within a large 5-phase Elliott Wave structure, currently within a corrective Wave 4. After this, Wave 5 Targets a new ATH of around $8.1. He insisted that this structure remains intact as long as $XRP holds above the Wave 1 peak of $0.93, which $XRP recorded in July 2023.