

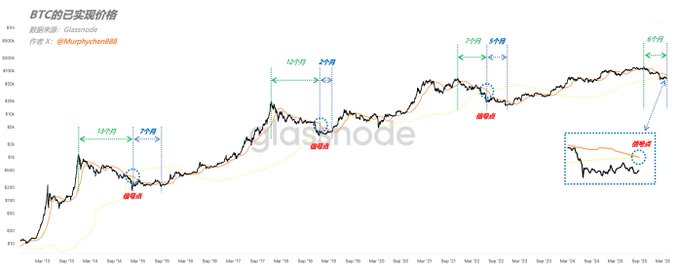
The appearance of this signal means that, starting from April 2, 2026, BTC has officially entered the latter half of the bear market! At least from the on-chain data perspective, we’re almost 100% confident about this. This kind of scenario is extremely rare. In the chart, the yellow line and orange line represent the average on-chain cost basis for BTC held 1-2 years and 1-3 months, respectively. Now, they’ve crossed. If you want to break down the logic behind this signal, you need to understand why the orange line drops during price declines, and why the yellow line rises. I previously posted a thread explaining why STH-RP doesn’t move with price action, which is fundamentally different from the 120d-EMA indicator on candlestick charts. If you’re interested, go check it out. Long story short, just know that this is a highly valuable and effective signal.
This article is machine translated
Show original

Murphy
@Murphychen888
04-01
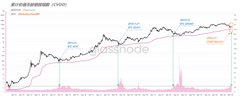
截止到3月31日,最新的CVDD已经到了$45,410,相比于上一次在2月10日的推文中的数据(见引文)仅仅增加了506美元,上升速度的非常缓慢。
在CVDD的算法中,分子中用到了CDD(累计价值销毁天数),即当BTC被花费时,原投资者持有的时间价值也同步清零。 x.com/Murphychen888/…
Sector:
From Twitter
Disclaimer: The content above is only the author's opinion which does not represent any position of Followin, and is not intended as, and shall not be understood or construed as, investment advice from Followin.
Like
Add to Favorites
Comments
Share
Relevant content


