

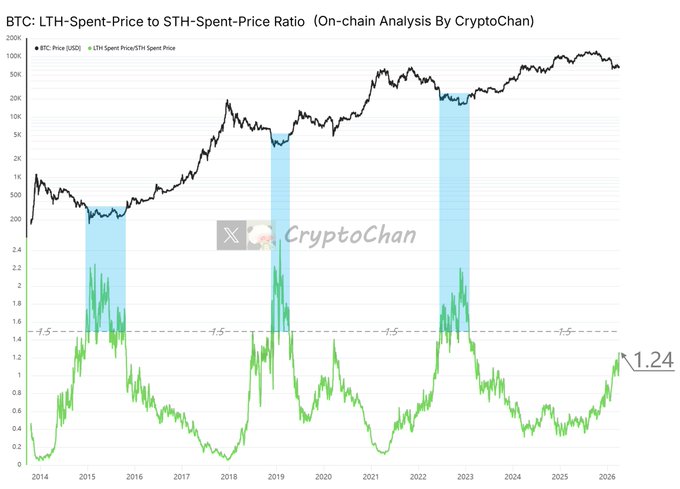
【Four-Year Cycle Series (30)】 When the indicator below the chart is higher than 1.5, it corresponds to a complete bear market bottoming range in Bitcoin's history. The current value of this indicator is 1.24. ┌── 📑 𝗗𝗲𝗲𝗽 𝗗𝗶𝘃𝗲 | Indicator Details ──┐ The black line at the top of the chart is the #BTC price; the indicator at the bottom of the chart is the ratio of "Bitcoin long-term holder spending price" to "Bitcoin short-term holder spending price". Note: Spent Price refers to the average purchase price of Bitcoin sold by holders over a period of time (7 days in the chart).
This article is machine translated
Show original

CryptoChan
@0xCryptoChan
04-01
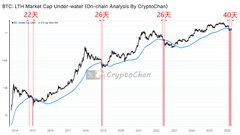
【四年周期总刻系列(29)】
2014年 #BTC 水下累计 22天 到熊底
2018年 #BTC 水下累计 26天 到熊底
2022年 #BTC 水下累计 26天 到次熊底 ($17.6k)
本轮截至目前 #BTC 水下累计已 40天
┌── 📑 𝗗𝗲𝗲𝗽 𝗗𝗶𝘃𝗲 | 指标详情 ──┐
图中黑线为比特币市值;蓝线为比特币长期持有者筹码市值 365d-MA x.com/0xCryptoChan/s…
Sector:
From Twitter
Disclaimer: The content above is only the author's opinion which does not represent any position of Followin, and is not intended as, and shall not be understood or construed as, investment advice from Followin.
Like
Add to Favorites
Comments
Share
Relevant content


