 Three altcoins are showing important technical signals ahead of the third week of April 2026. RaveDAO (RAVE), Polkadot (DOT), and Official Trump (TRUMP) are all facing key price zones that could determine short-term trends.
RAVE continues its parabolic surge with a 185% increase in just one day. Meanwhile, DOT is struggling after a bridge exploit sent the Token near All-Time-Low. Trump is testing a double- Dip support zone ahead of a key event for holder.
RAVE: Fibonacci Extension Aims for $9.00
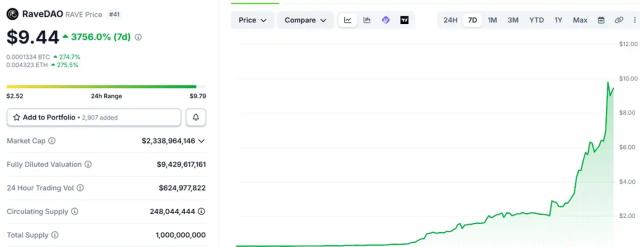
RaveDAO is one of the biggest Token in the crypto market this month. Currently trading around $7.47, it has surged 185% in just the last 24 hours. This Token is an extension of a larger parabolic trend, yielding over 3,500% gains from its most recent Dip .
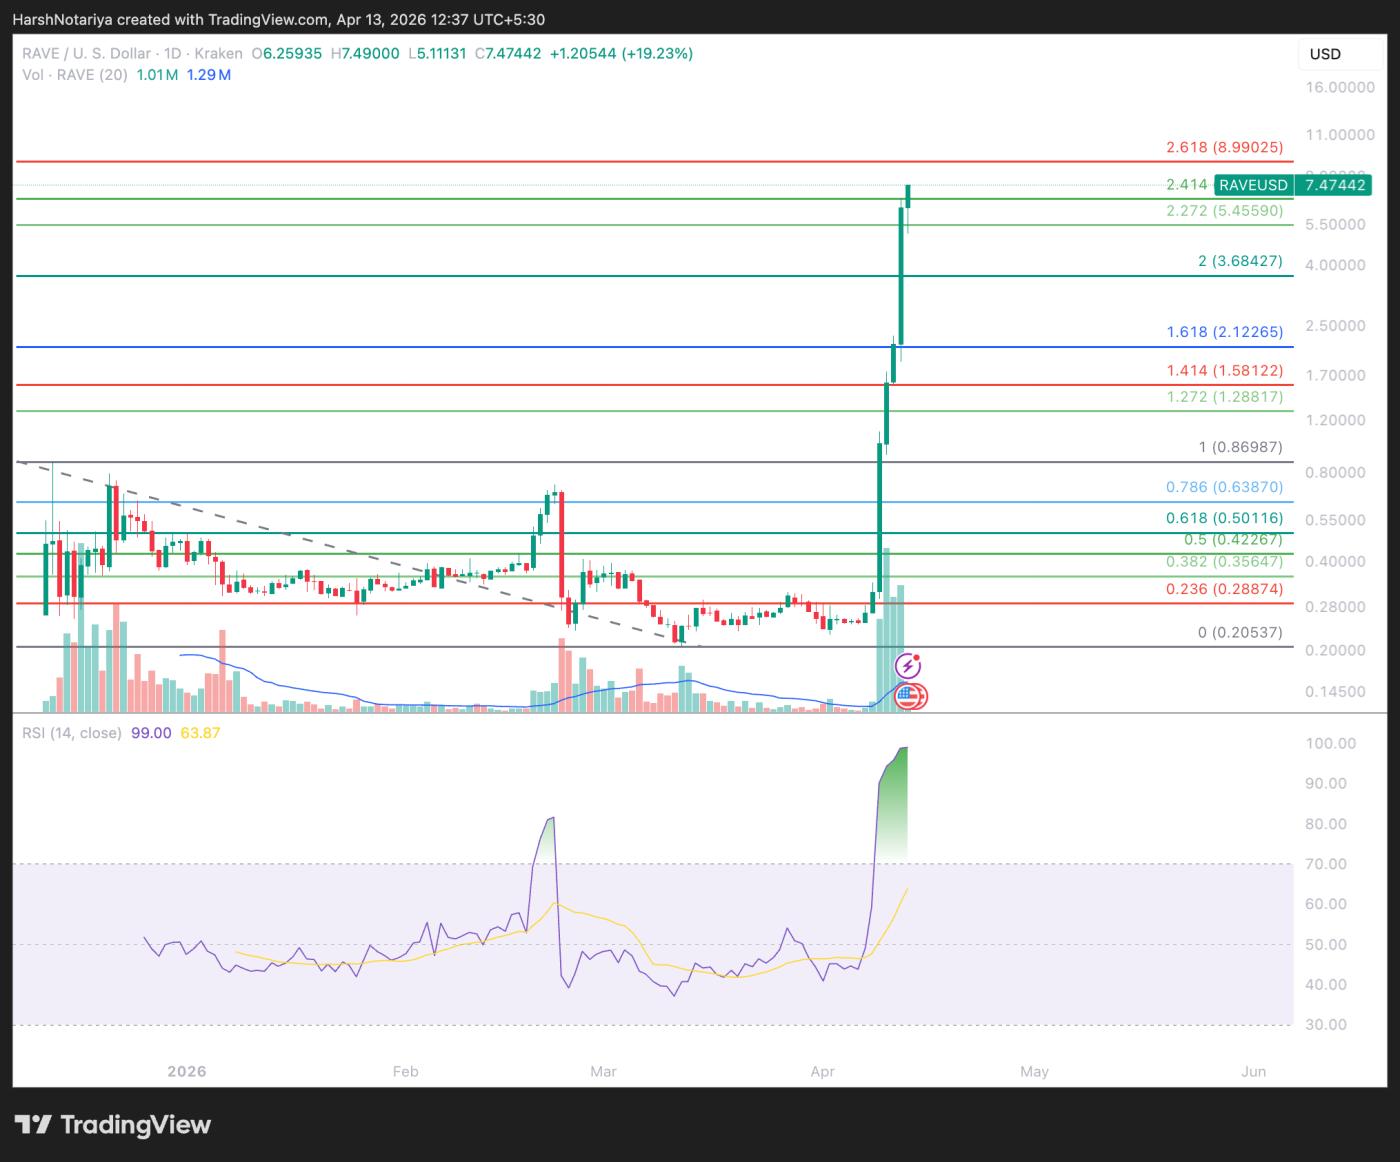
The bullish structure shows orderly movement, following Fibonacci levels rather than random fluctuations. Key Fibonacci extension levels Vai as steps in the uptrend. The 2.272 extension at $5.45 Vai as support during the day.
The next target is at the 2.618 Fibonacci extension level, around $8.99 – close to the psychological $9.00 zone. With the current price at $7.47, the distance to this target is approximately 18%.
The breakout candlesticks are accompanied by a sharp increase in volume . The current daily candlestick shows no signs of weakness such as long wicks or rejection at the high price level. The candlestick body remains full and closed near the highest level.
However, concerns have arisen about potential price manipulation. Several wallets allegedly deposited 18.58 million RAVE Token onto the Bitget exchange approximately 10 hours before the surge began. The low circulating supply (around 239 million out of a Max Supply of 1 billion) further intensified the pressure for concentrated buying.
On the downside, if the daily candle closes below $5.45, the parabolic structure will be broken. If it breaks below $3.68, the uptrend will be completely invalidated, opening up the possibility of a decline to $2.12.
The likelihood of a correction is high as the RSI is at an extremely overbought level, reaching 99.
DOT Drops Near Historic Dip After Bridge Exploit
Polkadot is currently trading at $1.18, down 8% from Sunday's peak. This decline stems from an exploit involving the Hyperbridge gateway, which allowed hackers to Mint 1 billion DOT in bridge form on Ethereum.
The attackers used a forged cross-chain message to change the admin privileges of the Polkadot Token contract on Ethereum. They then Mint the entire supply and Dump it in a single transaction, profiting approximately 108.2 ETH (~$237,000).
The limited liquidation of the bridge asset restricted the hacker's profits. The exploit did not affect Polkadot 's native Relay Chain or the DOT Token on the Primary Network, but only impacted the wrapped version of DOT on Ethereum.
Nevertheless, two major South Korean exchanges, Upbit and Bithumb, have temporarily suspended DOT deposits and withdrawals as a precautionary measure. This move has further increased selling pressure on the Capital weakened Token .
DOT is currently trading very close to its historical Dip of $1.10. The Token needs to reclaim the $1.22 mark to stabilize. A positive signal regarding how exploits are handled or improvements in network security could help restore market confidence.
If it breaks above $1.22, DOT could continue to test the $1.33 resistance zone.
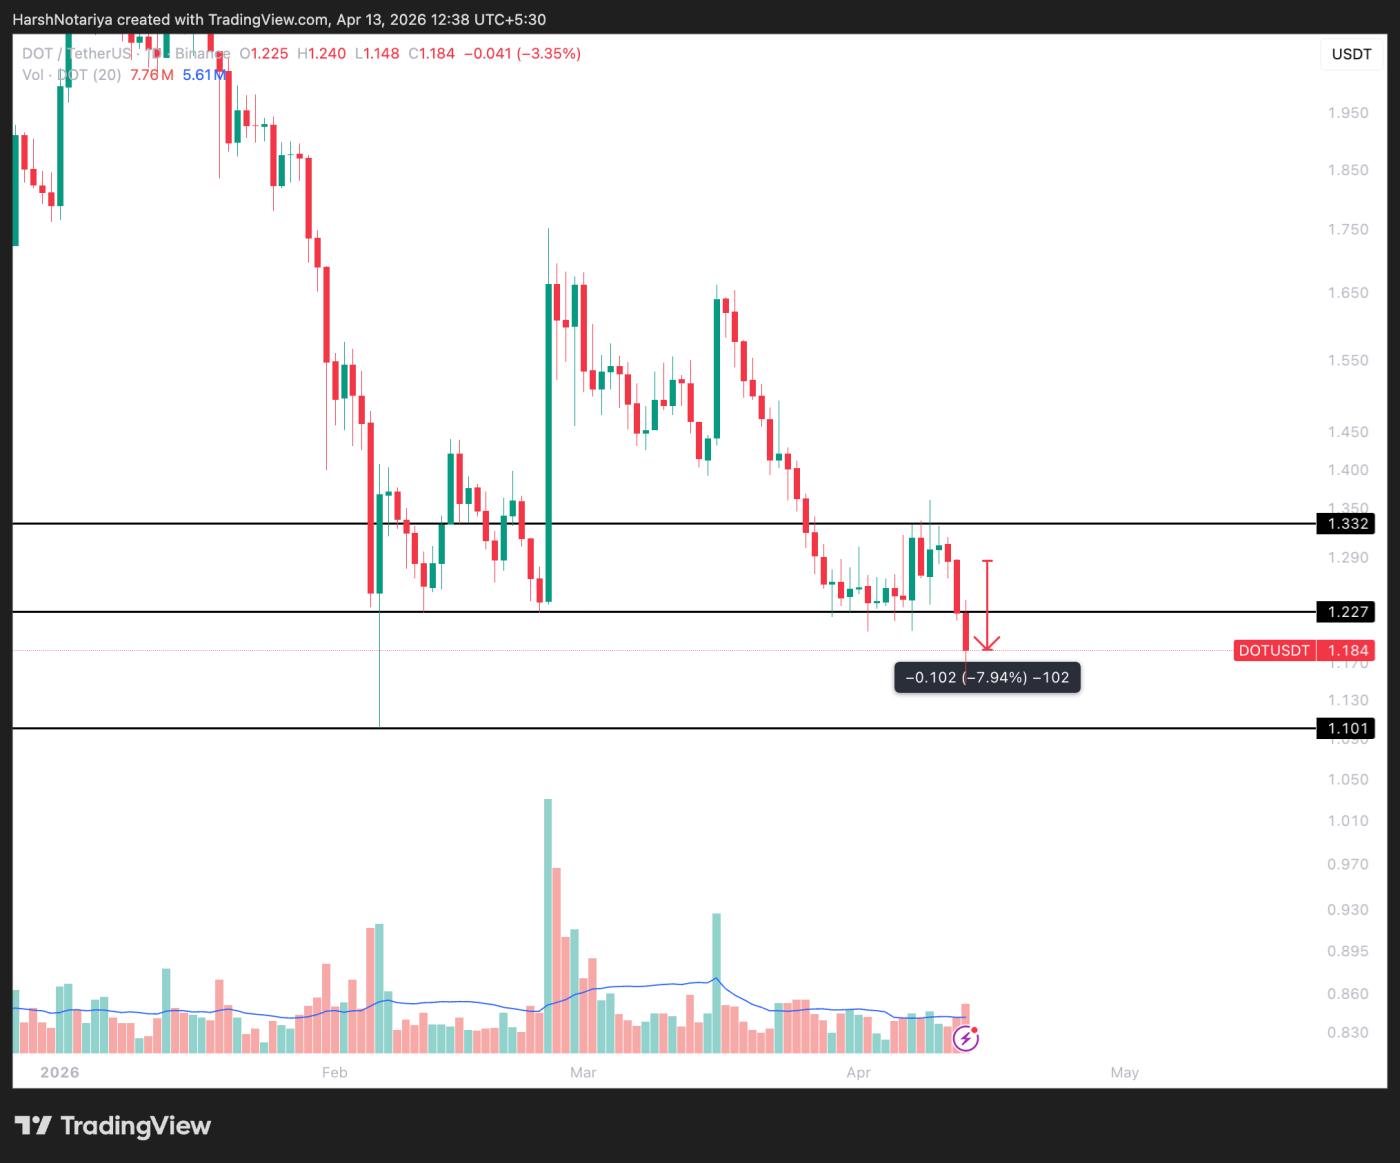
Conversely, if it fails to hold its current price level, DOT could fall to $1.10, or even lower.
TRUMP Tests Dip Bottom Pattern at $2.78
Official Trump is currently trading at $2.81, virtually unchanged for the past 24 hours. The Token is near a key support zone, potentially forming a double Dip pattern.
The crypto and business conference at Mar-a-Lago on April 25th is attracting attention. The event is for the 297 largest holder , including the top 29 "whales" who will have the privilege of meeting the President in person. A Snapshot was taken on April 10th.
Trump needs to hold the $2.78 level to maintain the double Dip structure. If buying pressure successfully defends this area, a breakout above the neckline at $3.08 could trigger a rally to $3.34. This target coincides with the 0.618 Fibonacci retracement level and represents an increase of approximately 19% from the current price.
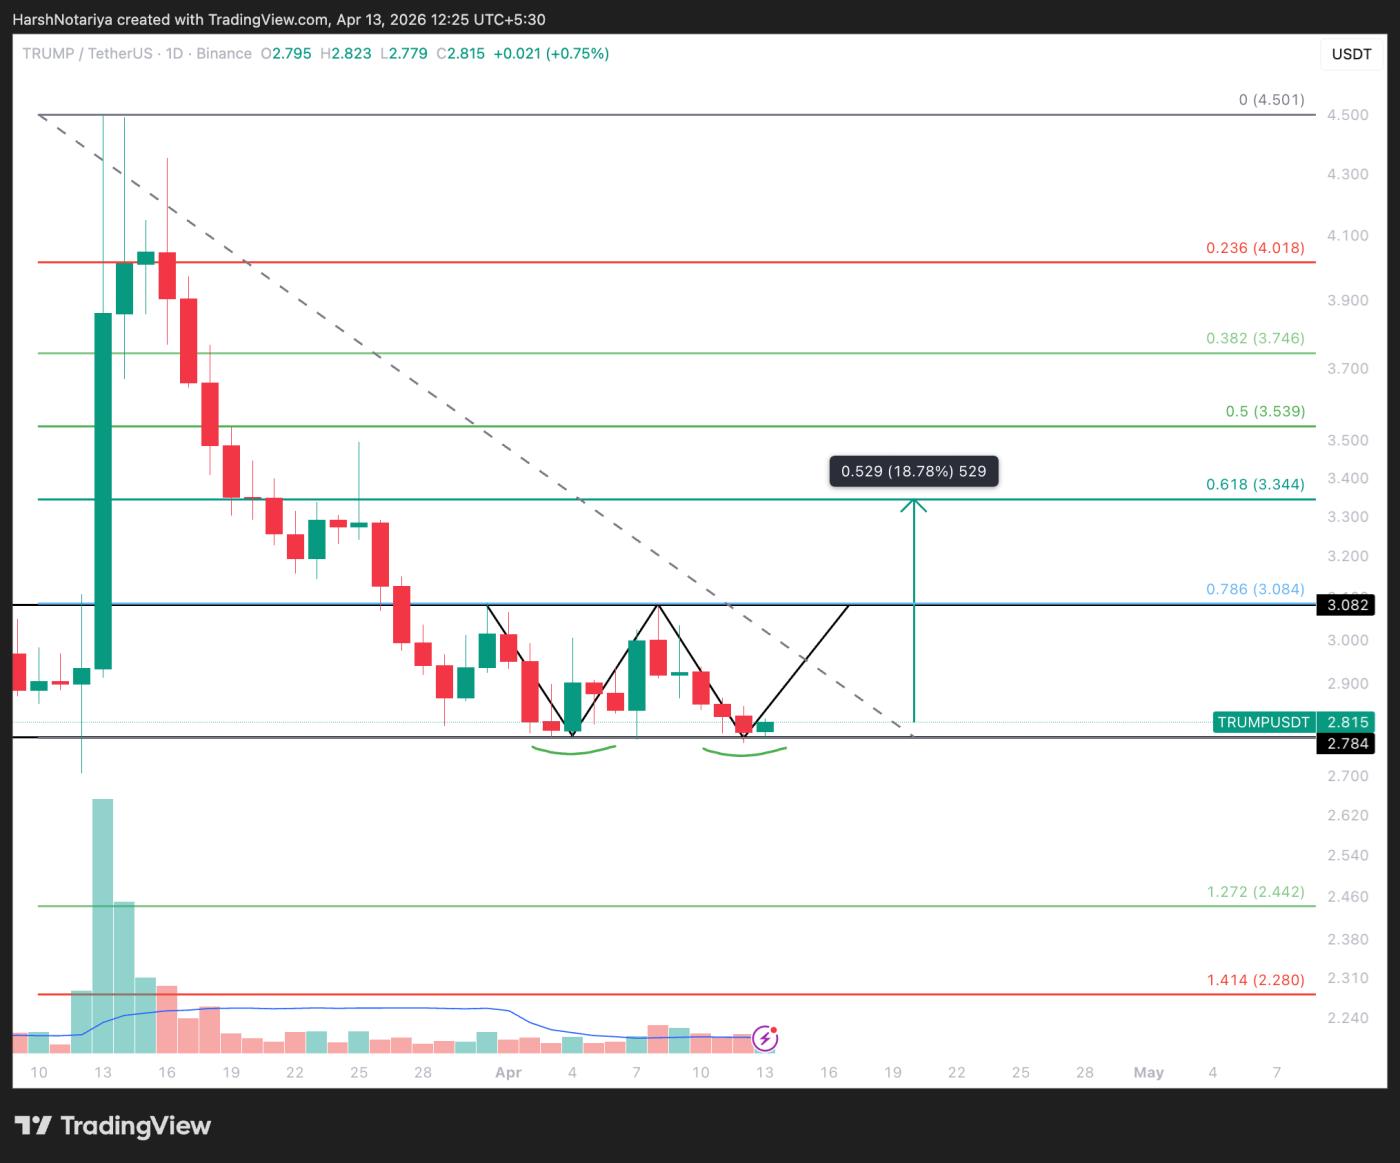
A negative scenario would occur if the $2.78 support zone is broken. In that case, the price could return to its historical Dip . A new low around $2.44 (Fibonacci extension 1.272) could emerge. Currently, the Token is still approximately 96% lower than its historical peak of $73.43 set in January 2025.
The April 25th event is unlikely to generate new buying demand as the Snapshot has already been completed. However, any positive factors arising from the event remain an important variable for TRUMP's price movements.