The price of Bitcoin (BTC) has fallen nearly 3% since the end of the week after ceasefire talks between the US and Iran in Islamabad failed.
The world's largest cryptocurrency has fallen below the $71,000 mark today. At the time of writing, Bitcoin is trading around $70,960.
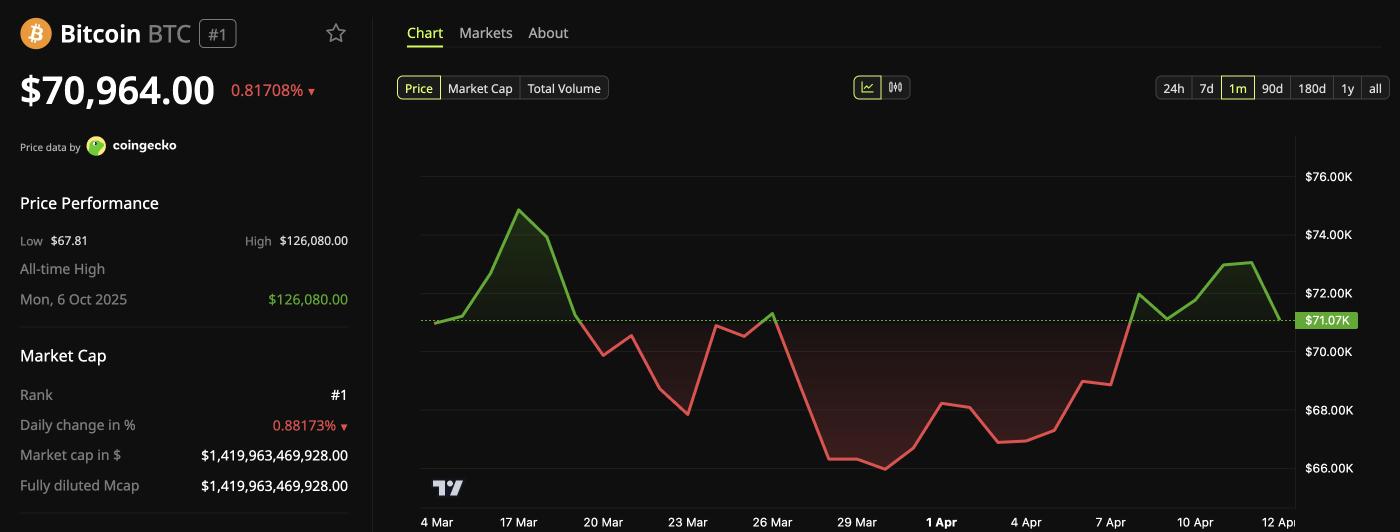 Bitcoin (BTC) price performance. Source: BeInCrypto Markets
on-chain data shows asset transfers as Bitcoin falls due to US-Iran news.
However, on-chain data tells a different story behind the surface market anxiety. According to one analyst, military tensions have spooked retail investors, but institutional money continues to quietly buy in. Five key indicators have reinforced this assessment.
First, the total Bitcoin netflow on Binance (SMA-30) Medium approximately -1,350 BTC, equivalent to about $96 million. Negative netflow indicates that coins are leaving Binance at a high rate.
Follow us on X for the latest breaking news.
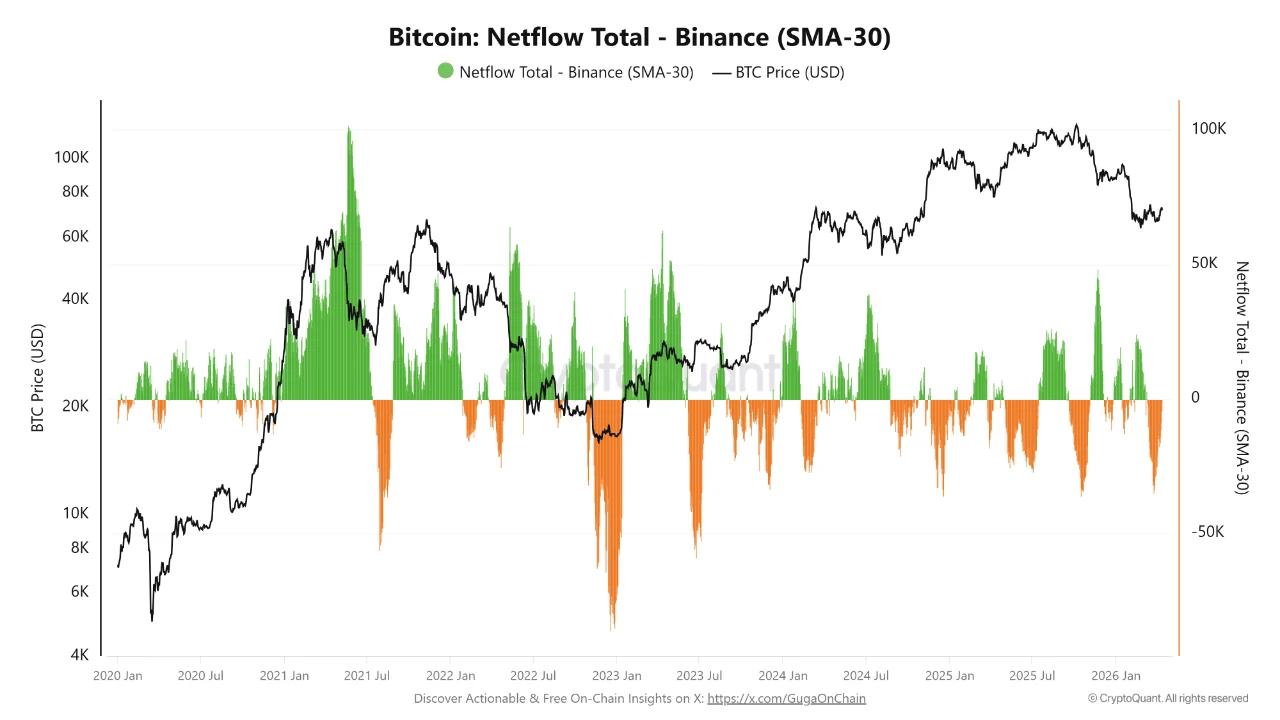 Bitcoin netflow on Binance. Source: CryptoQuant
Next, the Short-Term Holder Spent Output Profit Ratio (SOPR) across all exchanges is currently at 1.0018.
“The mathematical results are undeniable: the realization of losses has prevailed over the past 182 days, including 148 days (81.32%) below 1.00. Currently, these investors are selling off at near break Capital to avoid volatility, while providing cheap liquidation for those in control,” the expert commented.
Additionally, reserves on global exchanges have fallen to approximately 2.69 million BTC, below the seven-day moving Medium . This gap represents a withdrawal of about 4,500 BTC, equivalent to approximately $316 million, into Cold Storage amid geopolitical instability.
“The current situation suggests that this price drop is not a trend reversal, but rather a strong asset transfer under the guise of macroeconomic fear. Data has proven that if you bet against the market during a period of liquidation, you are putting yourself in the 'wheels' of large institutions,” the analysis added.
The actions of Bitcoin whales confirm this shift.
Another analysis from Amr Taha further clarifies this point. Over the past 30 days, whale inflows into Binance have fallen to just $2.96 billion, dropping below $3 billion for the first time since June 2025.
The decrease in cash flow suggests that whales have been limiting the BTC they put on exchanges to sell.
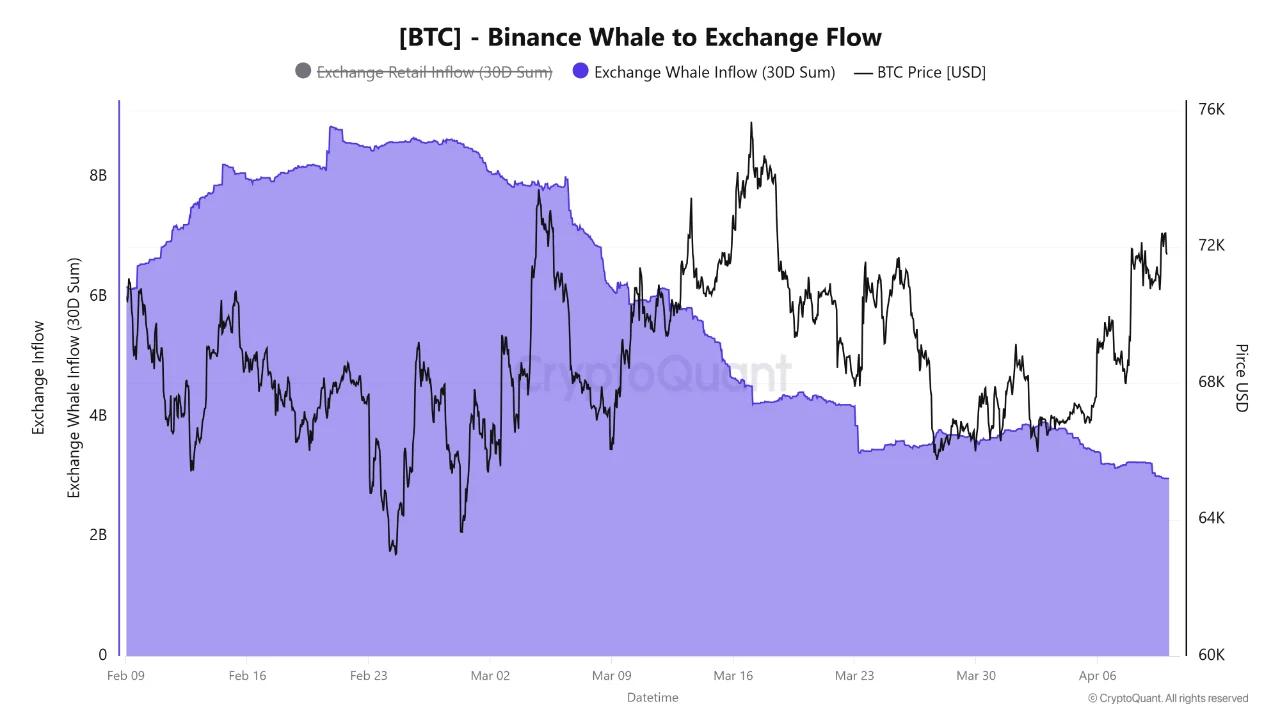 Bitcoin whale activity. Source: CryptoQuant
At the same time, the 30-day Realized Cap Change Longing-Term Holder (LTH) index rose to $49 billion on April 9, 2024. This is the second time the index has reached that level since March 26, 2024.
Conversely, the Short-Term Holder (STH) Realized Cap Change index has fallen to -$54 billion, marking the third time this index has dropped below -$50 billion since the beginning of March 2024. According to experts, weaker holder are selling off, while long-term holder are accumulating more Bitcoin on the market.
Whether this accumulation of goods will help prices recover depends on whether US-Iran tensions continue to escalate or whether a diplomatic resolution is possible in the coming days.
Subscribe to our YouTube channel to follow in-depth analysis from experts and reporters.