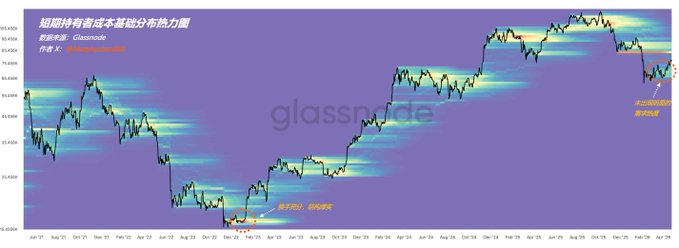
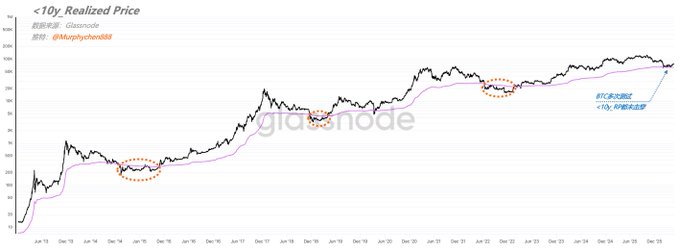
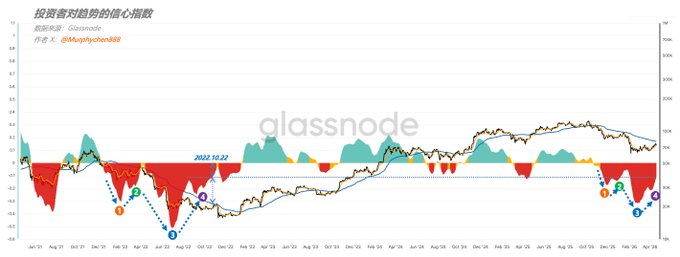
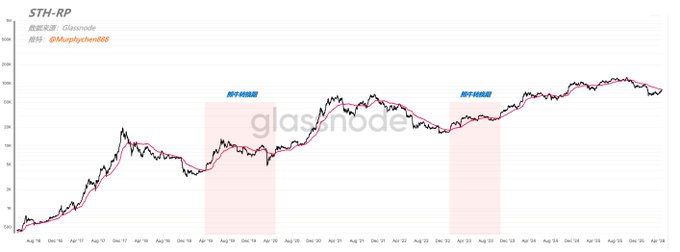
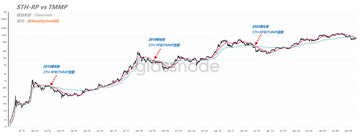
Is this time “different,” or is it “the same as before”? (continued) — In the previous post, we explained the roles of STH-RP and TMMP and why they’ve become the strongest resistance levels. This time, I’ll continue sharing my personal understanding and views. Logically, it should be “the same as before.” With BTC facing resistance from dual cost bases, it shouldn’t break through easily in one go. Instead, it should keep moving down, solidifying the chip structure and letting the market reconfirm the bottom consensus. As shown in Figure 1, there’s no obvious demand heat in the $60–70k range, and the chip structure looks pretty thin. If you compare it to the dense accumulation area formed in Feb 2022, the difference is clear. But, “could this time actually be different?” — That’s the question I’ve been thinking about lately. Honestly, I feel something “unusual” is quietly happening right in front of us. For example, <10y_RP (purple line in Figure 2) — this is the Realized Price after removing chips that haven’t moved in over 10 years, giving a more accurate reflection of the real market level. In the past 13 years, not a single bear market has seen BTC fail to break below <10y_RP. Yet this time, BTC just won’t drop below it. During the extreme fear in the market between Feb–Apr this year, BTC tested <10y_RP multiple times but never broke through. That’s not a coincidence. It shows the market has reached some limit, and selling pressure is fully absorbed. Looking at the “Investor Confidence Index for Trend,” the shape almost perfectly mirrors the previous cycle, but both volatility and duration are noticeably smaller (Figure 3). Based on all this, I personally believe we have reason to suspect: Are “non-typical bear market characteristics” starting to emerge in this cycle? If BTC really manages to break through the dual resistance of STH-RP and TMMP in one shot, it would be the most unique bear market in BTC’s 13-year history. Even if it’s not a direct reversal, it might drop below STH-RP again later. But as long as there’s a first breakout, I’d say the market has exited “deep bear” and is entering a whole new phase — the bear-to-bull transition period. Just like Apr 2019 to Jul 2020, and Jan to Sep 2023, those were periods where the market digested disagreements and transitioned between bear and bull sentiment (Figure 4). During these times, we might see a “final dip,” or maybe even a “mini bull run.” The market is always right, regardless of our personal opinions. Past experiences are just that — past. Only real action can test the truth. Right now, there are two camps: A believes the true bear bottom will be lower; B thinks $60,000 is the bottom. Which side is more likely? I don’t think it’s worth arguing. When the market tells us its story in its own way, our job is to read it. And “cost basis” and “price action” are its most honest language.
This article is machine translated
Show original

Murphy
@Murphychen888
Is This Time "Different," or Is It "The Same" Again?
The True Market Mean Price (TMMP) is a mean-reversion model that includes the cost average of all active on-chain chips; for example, ETF trades, OTC, exchange transfers in and out, etc., while excluding chips from miners, x.com/Murphychen888/…
Sector:
From Twitter
Disclaimer: The content above is only the author's opinion which does not represent any position of Followin, and is not intended as, and shall not be understood or construed as, investment advice from Followin.
Like
Add to Favorites
Comments
Share
Relevant content