Bitcoin's on-chain indicators are hitting very low levels, typically only seen at the Dip of a cycle, even though the price has only fallen about 40% from its historical peak. This decline is significantly lower than the 75% to 85% drops seen in previous bear cycles.
Six key indicators currently attracting significant attention from retail investors are all sending similar signals. They suggest the market has "reset" without a peak of euphoria, while long-term investors continue to hold their positions instead of selling.
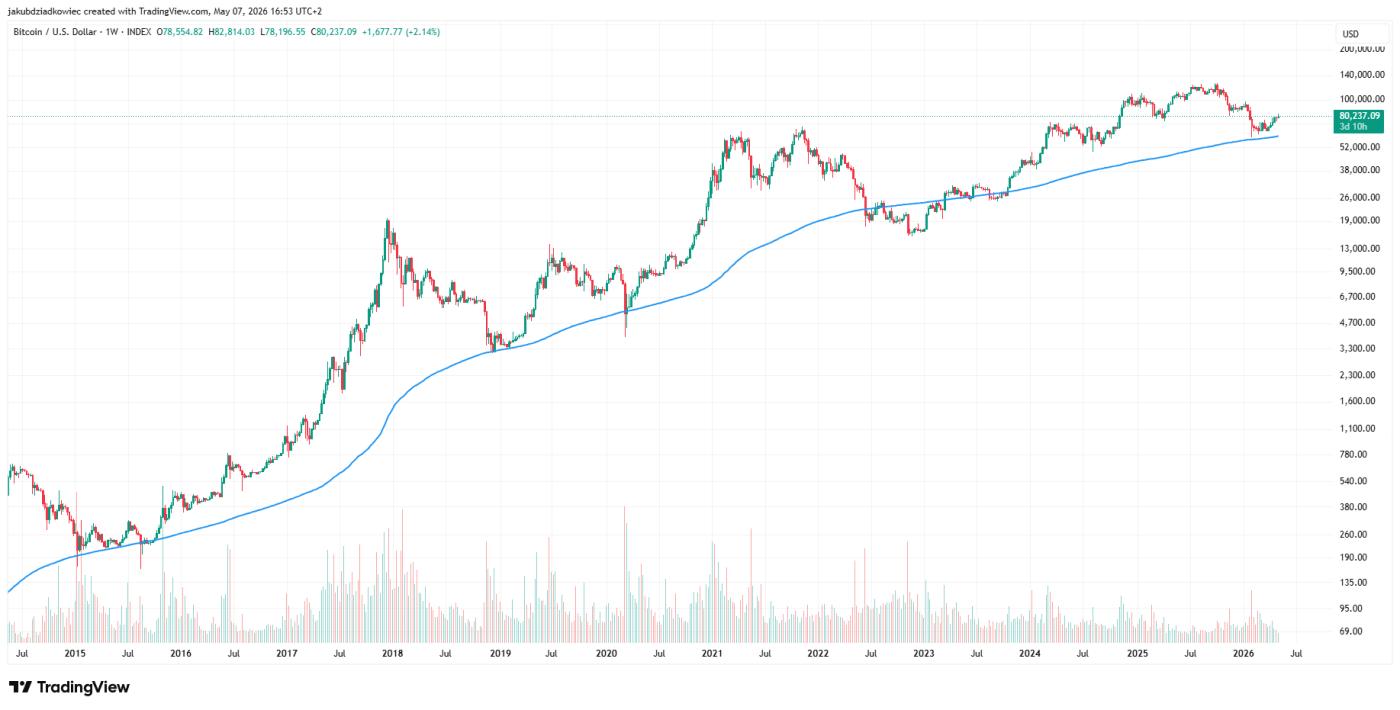 Weekly chart of BTC and 200MA. Source: Tradingview
The Bitcoin Cycle: Surrendering but not collapsing
The three key indicators used to measure the level of pressure between price and trend are all in agreement.
The Mayer Multiple Z-Score compares the price of Bitcoin (BTC) to its 200-day Medium . This index recently dropped to around -1.5 standard deviations, a price range that has only been reached twice recently in the past.
The first time was in March 2020, when the price was around $3,000. The second time was whenFTX went bankrupt at the end of 2022, when the price was around $19,000. This time, the price fell to around $62,000. After that, BTC recovered to nearly $80,000.
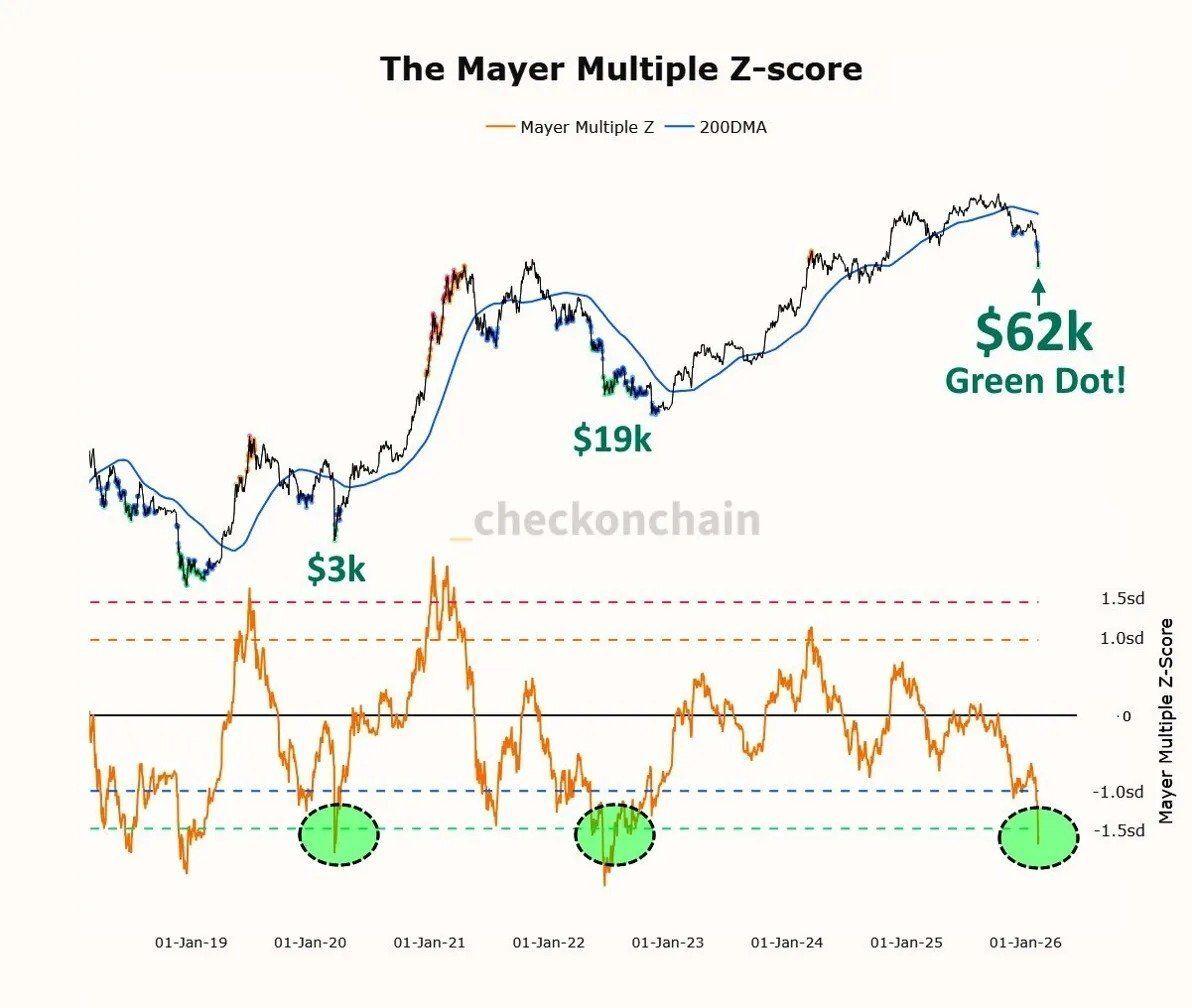 Mayer Multiple Z-score. Source: X/Michaël van de Poppe
Bitcoin's Sharpe Ratio also confirms this. The indicator has fallen into the "Low Risk" zone. These zones have previously appeared at the cycle Dip of 2015, 2019, and 2022.
Each time this signal has appeared in the past, it has typically foreshadowed sharp price increases, although the number of repetitions has been low.
According to data from In The Cryptoverse, the percentage of supply experiencing losses has also increased to nearly 39%. This level typically occurs at the end of a bear market , rarely happening when prices are still in six figures like they are now. The disparity between price and the "pain" experienced by holder is the most striking feature of this cycle.
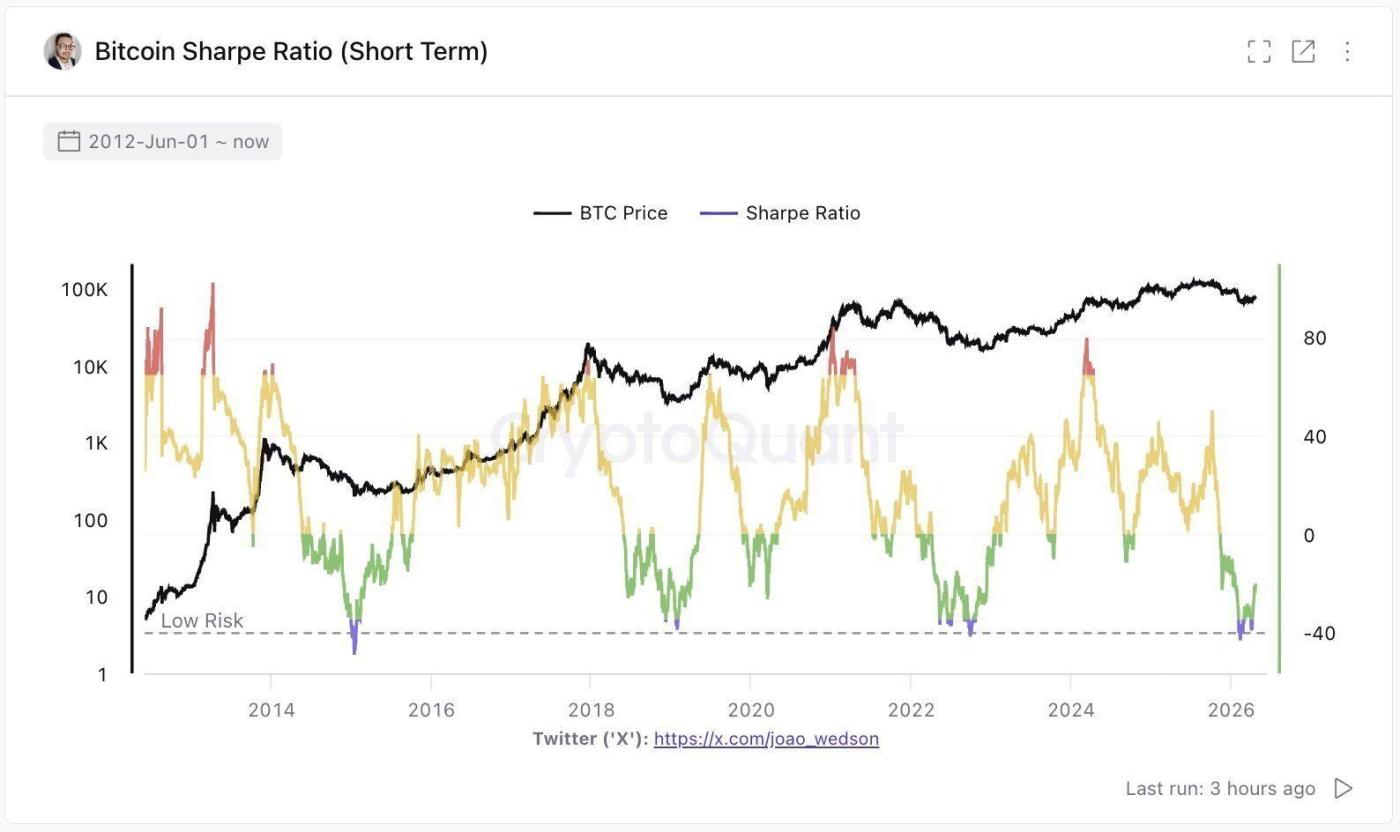 Bitcoin's Sharpe Ratio. Source: X
Bitcoin's 200-week moving Medium is the fourth confirmation. This indicator has consistently Vai as a "Dip" for every previous cycle. It was slightly broken in 2018, and only pierced by candle wicks in 2020 and 2022. This time, the 200WMA touched and held without being completely breached.
A Bitcoin cycle has no euphoric peak.
The capitulation signals are particularly noteworthy because this time there was no peak of excitement like in previous cycles.
The CBBI Bitcoin Bull Run indicator combines multiple cyclical indicators . This composite indicator has never crossed the red zone above 80 during the recent rally. Previous bull cycles such as 2013, 2017, and 2021 all clearly reached this level. The current chart is marked with an "X" to indicate this missed signal.
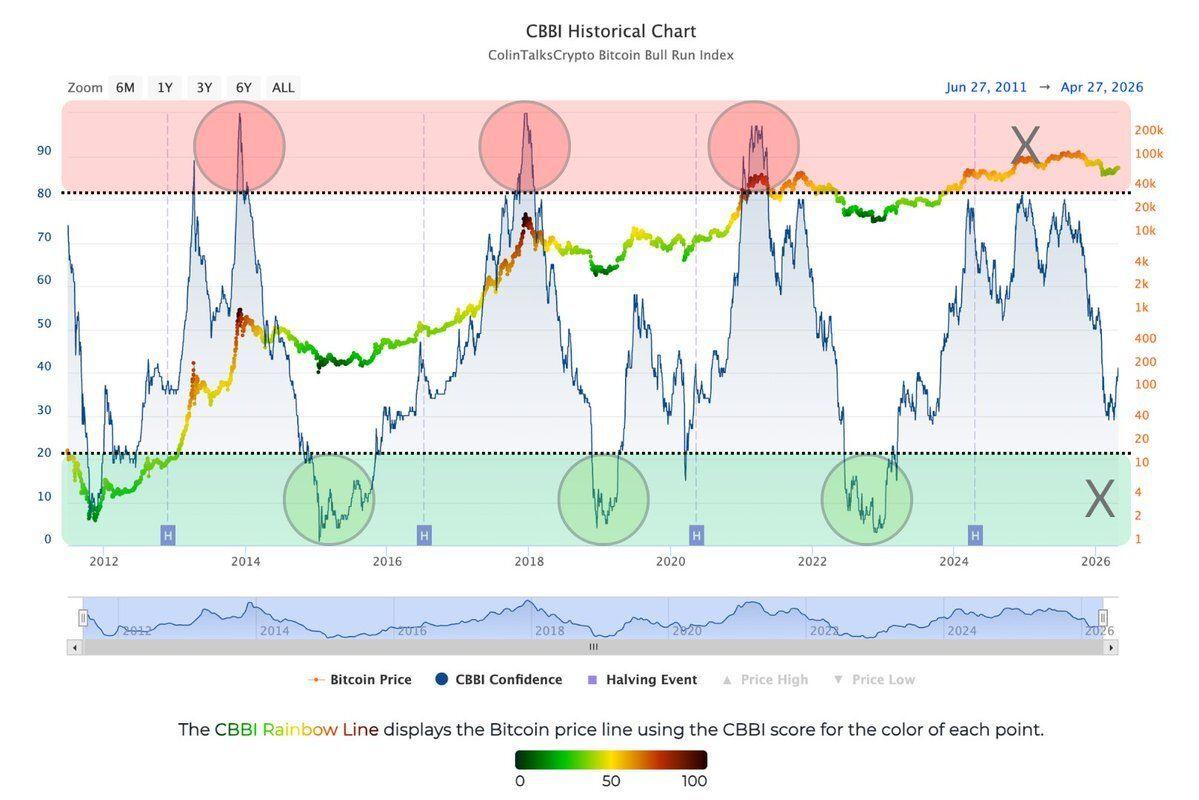 Historical CBBI chart. Source: X
Glassnode 's Net Unrealized Profit and Loss (NUPL) data tells a similar story. This indicator categorizes sentiment from blue (euphoria) to red (surrender). The expansion phase from 2024 to 2026 only touched the green "belief" zone and never once crossed the blue zone.
Accordingly, the market did not reach the "mass greed" level that usually occurs when prices peak in a cycle. Then, the NUPL gradually decreased to the orange zone, which is typically associated with bear markets or those preparing to Dip.
This chart follows a direction quite similar to what happened in 2018 and 2022, although the market price of BTC then was very different from now.
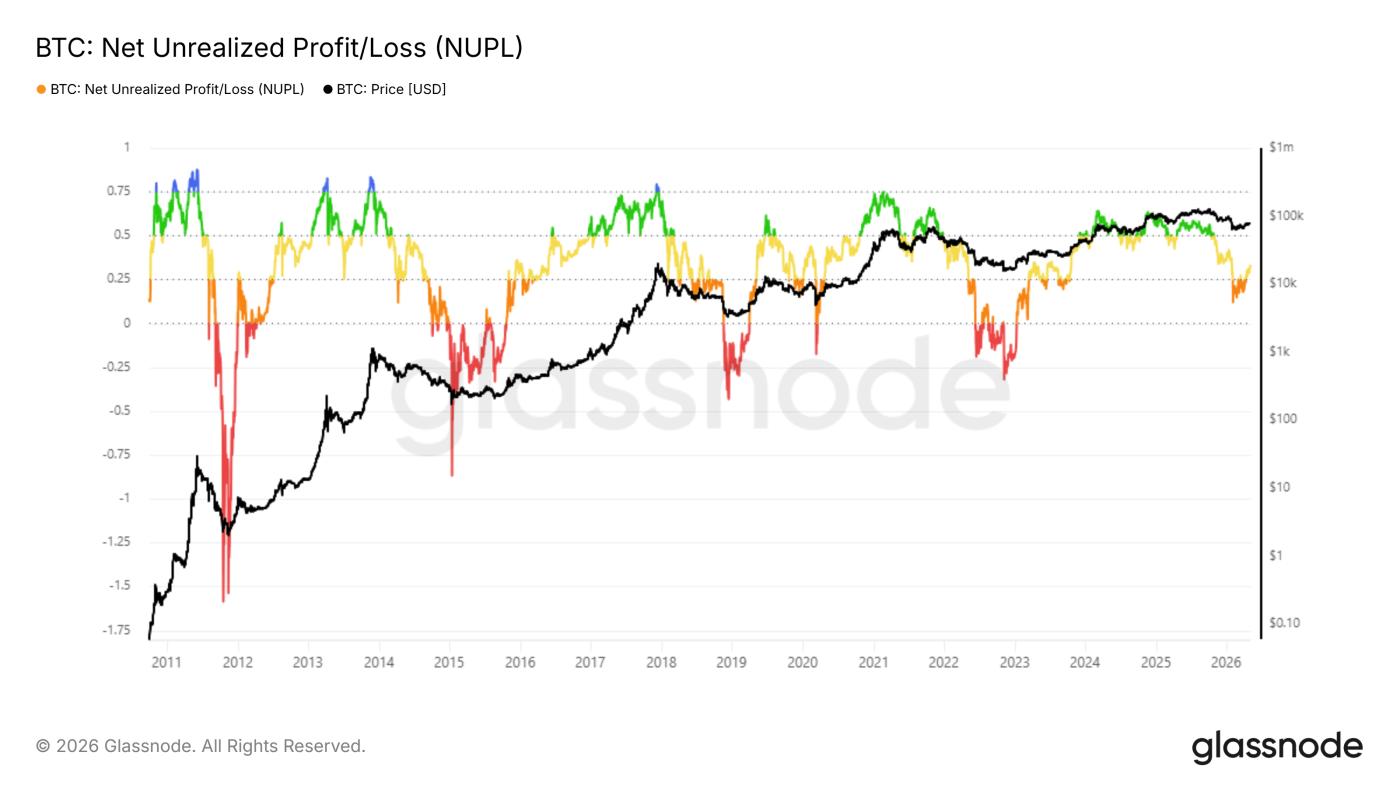 BTC NUPL. Source: Glassnode
Long-term investors are unwilling to sell.
The strangest signal comes from the behavior of long-term investors.
Glassnode defines long-term holders (LTH) as wallets that have held the coin for at least 155 days. In all previous cycles, this group typically distributed heavily at the price peak. The supply of LTH decreased as new buyers absorbed the existing coin supply. This pattern was clearly repeated in 2014, 2018, and 2021.
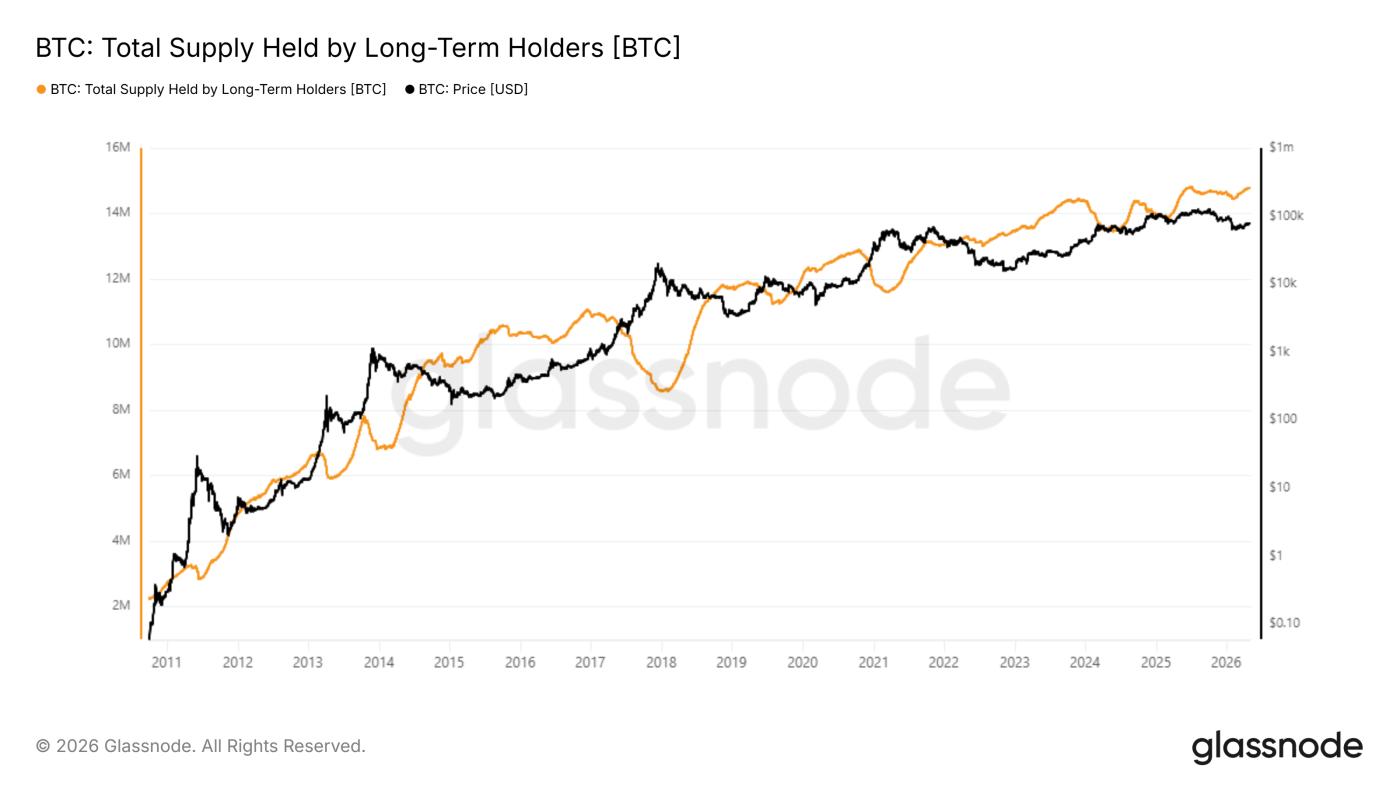 Total amount of BTC held by long-term holders. Source: Glassnode
However, this cycle is different. The supply of LTH decreased slightly in 2024, but then quickly returned to record highs above 14.5 million BTC. Long-term holders are now in a phase of strong confidence, while the price remains well above the 200-week Medium .
This action can be interpreted in two ways. A positive perspective suggests that long-term holders are still waiting for an even higher price peak. A structural perspective, however, indicates that the composition of LTH has now changed, encompassing ETF cold storage, national reserves, and corporate funds with objectives independent of market cycles.
However you interpret it, these factors support the hypothesis that the traditional cycle has been broken. And none of these factors alone explain why prices have continued to fall sharply from their current levels.
An asymmetrical battle.
When observing six on-chain charts simultaneously, we see a rather peculiar market picture. Strong "sell-off" signals are appearing in all three price-based indicators.
Meanwhile, in terms of sentiment, there are no signs of rapid euphoria. And the group that usually sells when historical peaks are reached is not distributing to the market this time.
It is rare for all three of these factors to appear simultaneously in the market.
The simplest hypothesis right now is that Bitcoin has just undergone a deep on-chain correction but without the euphoric peak seen previously. At the same time, those holding the most likely to sell haven't yet sold.
History shows that once all these factors converge, the market tends to trend upwards.
Of course, there are also counterarguments. If the four-year cycle model has truly changed, then the Dip signals of the previous cycle may no longer be as effective as before.
The Mayer Z, Sharpe Ratio, and other "sell-off" indicators often signal good buying zones because they reflect recurring market sentiment. However, if this new cycle has a different structure, the accuracy of these signals in forecasting may not be as high as before.
However, for those observing over the long term, the current on-chain picture still leans towards asymmetry. Prices are still below the cycle peak, but remain above the 200-week moving Medium .
The confidence of holders remains strong, and historically rare buy signals have appeared simultaneously. Whether this cycle will see another price surge or enter a longer consolidation phase, the current data is outstanding. This is the clearest on-chain Dip signal Bitcoin has had in years.