Bitcoin (BTC) is establishing a potential Dip around $60,000 as spot buyers return to the market. However, on-chain valuation and earnings data still confirm the market remains in "bear" territory.
The recovery from the Dip of early June has helped ease selling pressure from recent buyers, although it hasn't completely resolved the issue. Currently, some indicators suggest that stability is gradually forming, rather than a true Dip being reached.
BTC is trading around $64,171, down 1% in the last 24 hours, with a total market Capital of nearly $1.29 trillion.
Actual losses still outweigh Bitcoin's cash flow.
The actual Profit/Loss ratio measures the USD value of coins that are in a profitable position compared to coins that are losing money when sold. If this ratio is lower than 1, it means that the majority of trades are accepting losses.
The 30-day Medium of this indicator is 0.53, while the 90-day Medium is 1.10. This difference confirms that stop-loss selling has outweighed profit-taking for most of the past month.
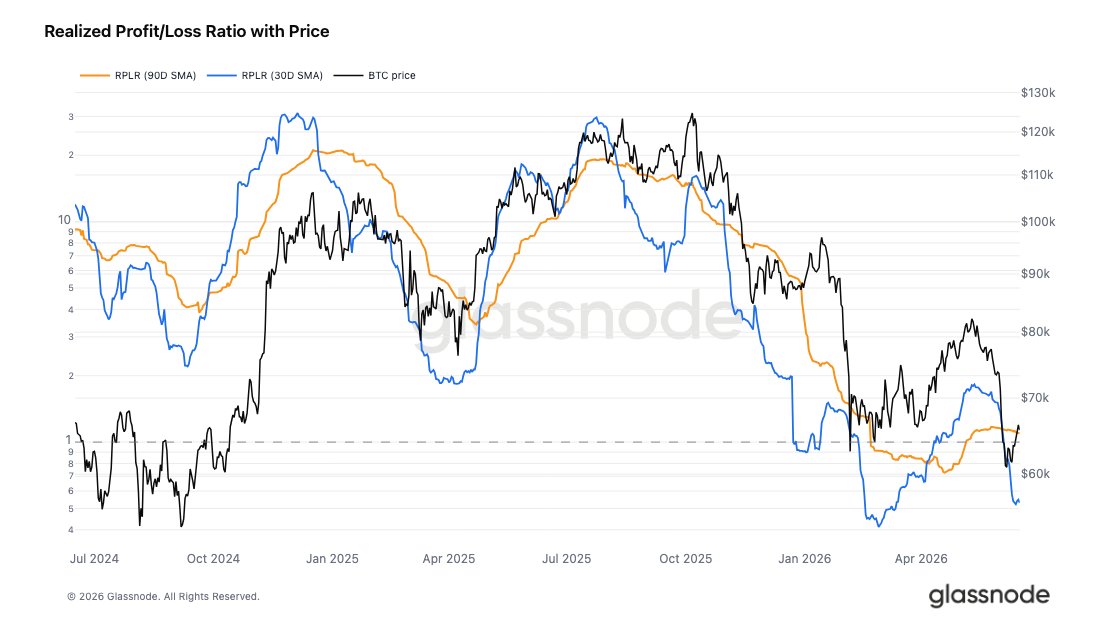 Actual Profit/Loss Ratio of BTC / Source: Glassnode
Valuation data also reflects similar sentiment. Glassnode identifies the current True Market Mean of Bitcoin at $77,200, approximately 15% higher than the current trading price, indicating that the on-chain trend remains quite bullish. The MVRV ( Medium Value Value) for short-term holder has recovered to 0.90, but has yet to break above the equilibrium level of 1.0.
If both of these Medium can remain above 2, that would be the first signal that the trend is shifting.
The spot Order Book is forming a Bitcoin Dip near $60,000.
Cash flow data continues to show a negative trend, but spot liquidation is showing signs of reversal. This divergence is the reason for expectations of a recovery cycle.
The Binance Spot Order Book Depth Deviation indicator has shifted strongly toward buy orders. Buy liquidation now far exceeds sell orders that have been pending for the past few months.
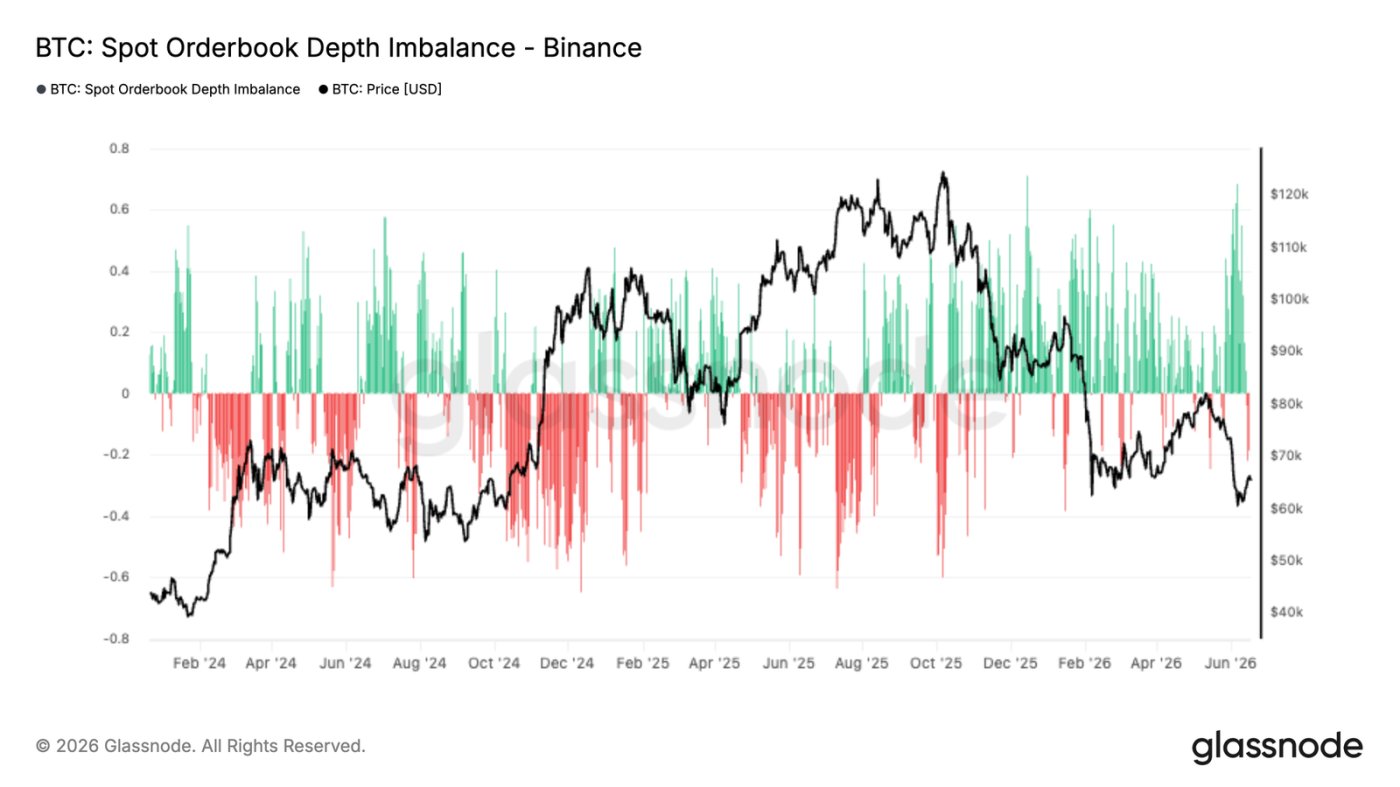 BTC spot Order Book discrepancy / Source: Glassnode
This suggests that traders are willing to "catch" supply at lower price levels rather than selling when prices rise slightly. Buy orders around the $60,000 area appear to be defending support .
Open interest has also decreased significantly from its peak at the end of May, and funding rates are gradually returning to neutral levels. This reflects that current buyers tend to be patient, rather than using excessive leverage.
Macro indicators have revealed a rare deep value zone for Bitcoin.
Another long-term indicator reinforces the belief in a price stabilization scenario. The Capriole Macro Index Oscillator is currently at -2.03, one of the lowest levels ever recorded in the indicator's history.
Analyst Charles Edwards noted that these periods of sharp declines in the indicator were short-lived, lasting approximately four months at the end of 2018 and about two months in mid-2022. Both of these periods served as precursors to major market rallies.
“In the last 10 years, Bitcoin has only experienced 6 months in such deep price swings (accounting for 5% of the total time). This is truly a good opportunity for the long term… If you believe these difficulties will be resolved, you will probably continue to favor Bitcoin at the moment.”
He also highlighted two points of concern not encountered in previous cycles: the risks associated with digital assets held by funds and the threat from quantum technology. These factors are making the deep valuation signals optimistic, but it is not yet possible to confirm the true Dip of the market.
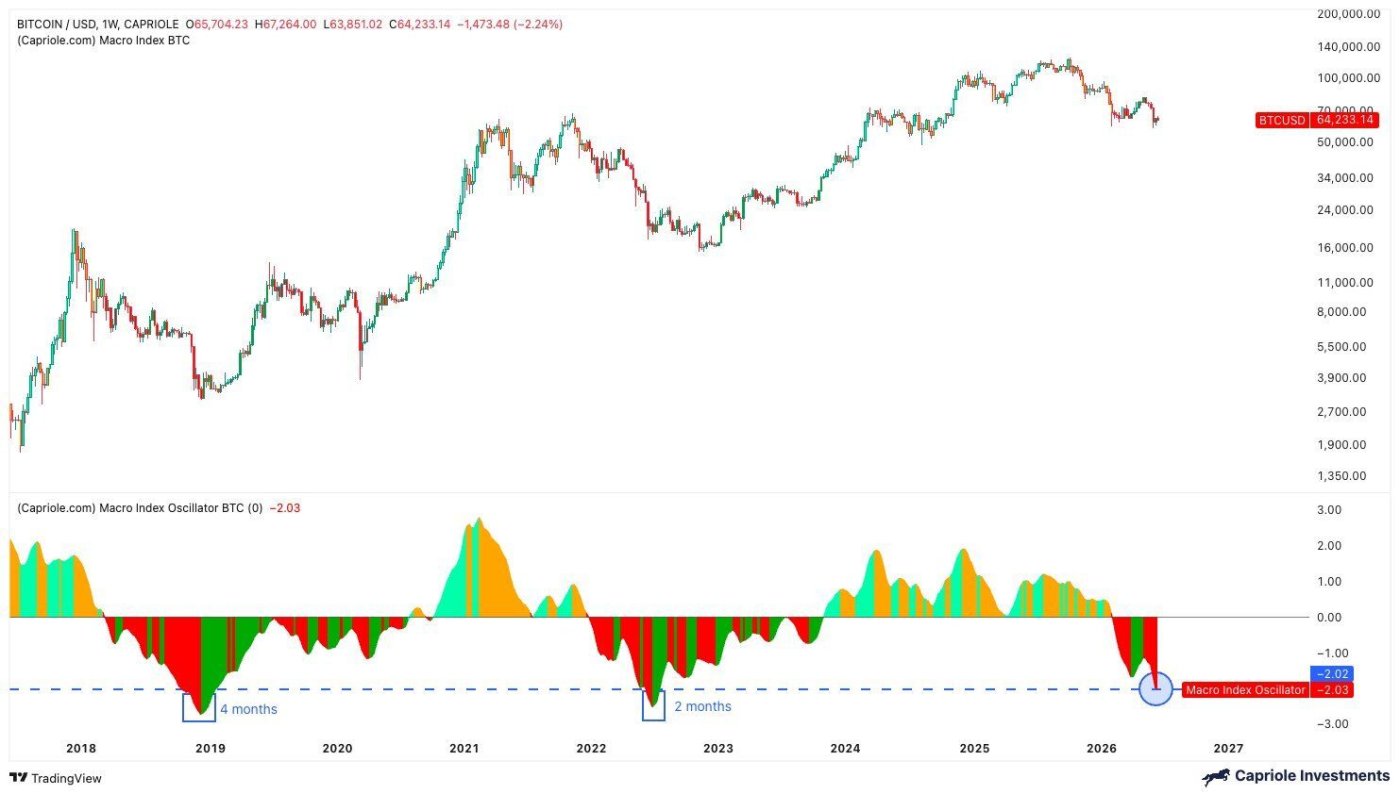 Bitcoin Macro Index / Source: X
Bitcoin Dip : Price depends on the $64,000 – $66,000 range.
The daily chart shows that BTC is in a neutral state. Bitcoin has broken down from the parallel ascending price channel and quickly reached the $59,000-$60,000 range as predicted.
That sharp drop was accompanied by a surge in volume and significant volatility – a sign of explosive selling pressure (flush), rather than a prolonged period of trickle selling. The subsequent recovery helped the price return to the $64,000-$66,000 range, creating the next decisive zone.
This is a very important price zone. If it can hold, Bitcoin could head towards the lower band of the price channel, around the resistance zone of $74,000 – $76,000 in the near future.
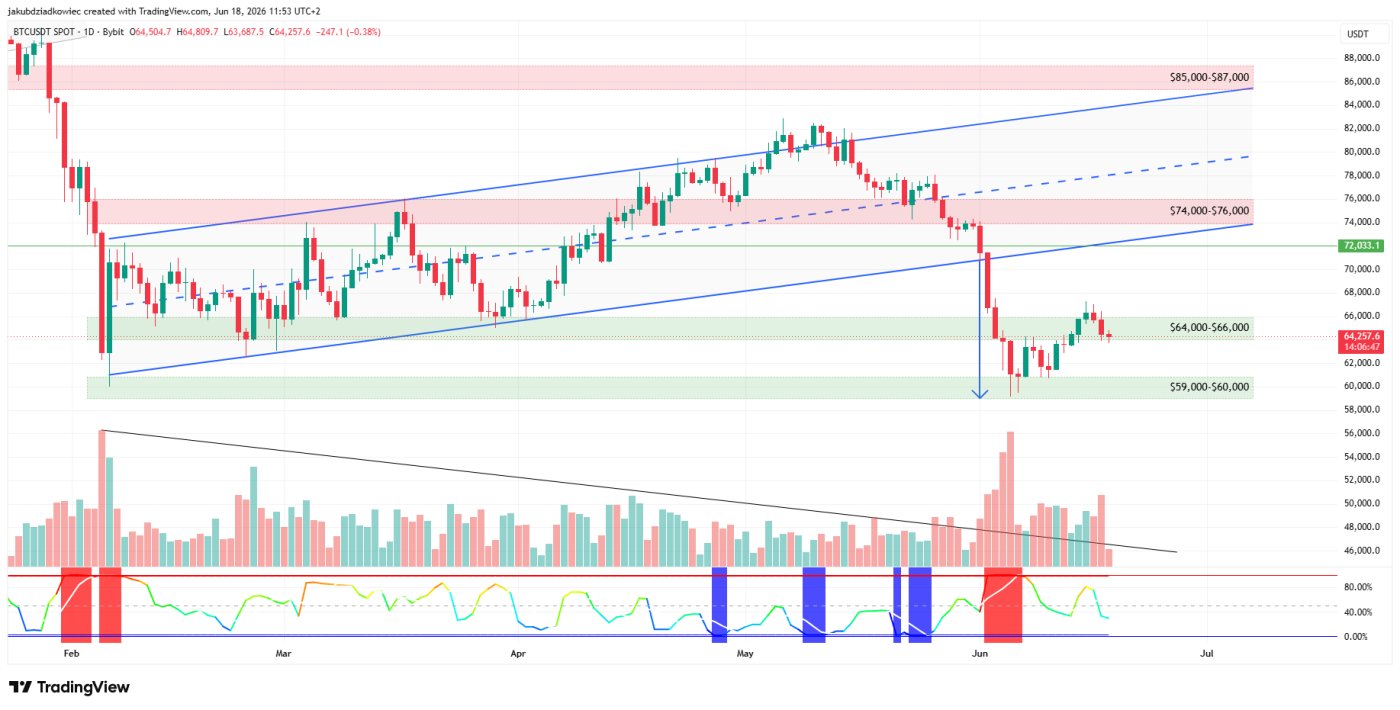 BTC daily chart / Source: Tradingview
A rejection at this price level could leave Bitcoin stuck in the $60,000 to $65,000 range. The $59,000 to $60,000 range is a crucial support zone that needs to hold, while the $74,000 to $76,000 range will be a major resistance zone that will limit any recovery attempts.
The big question now is whether patient buying pressure can last longer than the weak profit-taking situation, and this will be the deciding factor in Bitcoin's next move.