Original article: " Sophon Investment Research: Gas Usage Analysis of Ethereum in January "
Author: Cindy
All transactions on the ETH network are divided into eight categories including Vanilla, ERC20, Stablecoins, DeFi, Bridges, NFT, and MEV Bots.
Statistics show that the second, third, and fourth categories that account for the largest share of gas usage are Defi, ERC20, and stablecoins, of which Defi and ERC20 account for 8%, and stablecoins account for 6%.
Statistical range
The normal category includes pure ETH transfers between externally owned accounts (EOAs) issued without invoking any contracts. The ERC20 class counts all transactions that call ERC20 contracts, excluding stablecoin transactions.
The stablecoin category represents all fungible tokens whose value is pegged by an issuer or algorithm to an off-chain asset. This category includes over 150 stablecoins, the most prominent of which are Tether (USDT), USD Coin (USDC), Binance Dollar (BUSD) and Dai (DAI).
The Defi category covers all on-chain financial instruments and protocols implemented as smart contracts. Decentralized exchanges (DEXs) also fall into this category. This section introduces more than 90 DeFi protocols, including Uniswap (UNI), Etherdelta, 1INCH (1INCH), Sushiswap (SUSHI), and AAVE (AAVE).
Cross-chain bridges represent all contracts that allow the transfer of tokens between different blockchains, including more than 50 such as Ronin, Polygon (Matic), Optimism (OP) and Arbitrum (ARBI).
All transactions that interact with non-fungible tokens fall into the NFT category. This section includes the ERC721 and ERC1155 token contract standards and the NFT marketplace for trading them.
MEV bots, or Miner Extractable Value bots, represent bots that automatically execute transactions for profit by reordering, inserting, and reviewing transactions within blocks. All remaining ETH transactions are collected under the other class.
Gas usage by category
The graph below represents the relative amount of gas consumed by each category in the ETH network. The chart below shows each category's share of gas usage in different colors from January 2020.
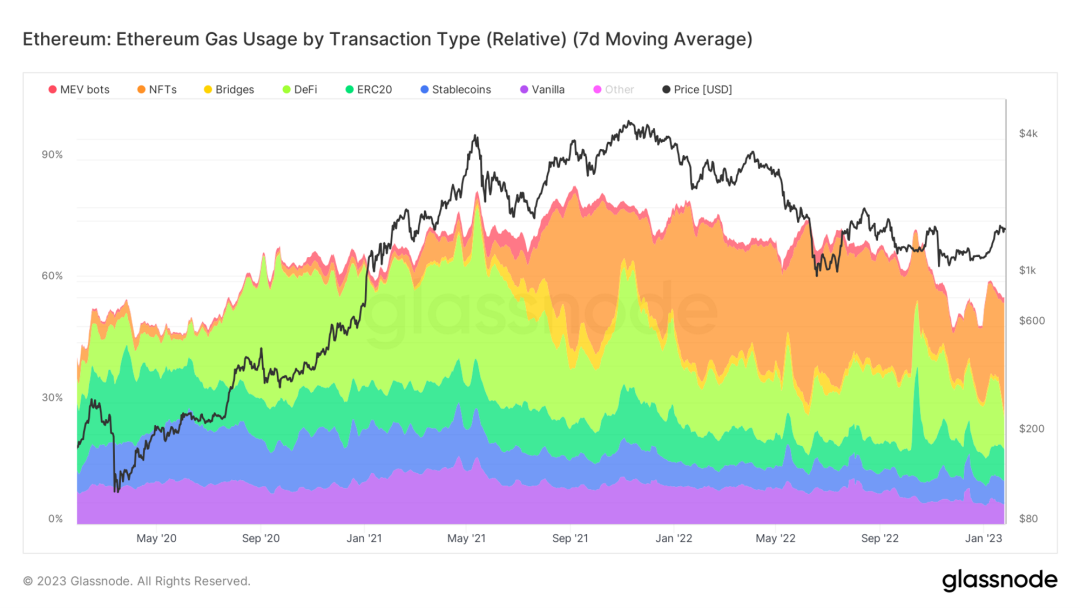
At first glance, the NFT, Defi, ERC20, Stablecoin, and Vanilla categories stand out as they have the most pronounced share of total gas fees.
The data shows that the NFT category currently accounts for 28% of the total gas fees on the ETH network, indicated by the orange area. The category's share was only around 4% in early May, before starting to suddenly rise.
Defi comes in second with an 8% share, represented by the light green area. Both the NFT and Defi categories have increased their gas share since the pump began. The ERC20 category accounted for 8% of the total gas share. Represented by the dark green area, the category's share has halved from 16% in October 2022.
At the same time, it can also be seen from the dark blue area that the percentage of stablecoins remained unchanged at around 5-6%. Finally, the common category continues to account for around 5% of total gas.
Gas usage of NFT
Looking in detail at gas usage in the NFT category, OpenSea appears to be dominating. The graph below shows the NFT market's share of gas usage since early 2018. The figure below shows the gas usage of NFT in ETH
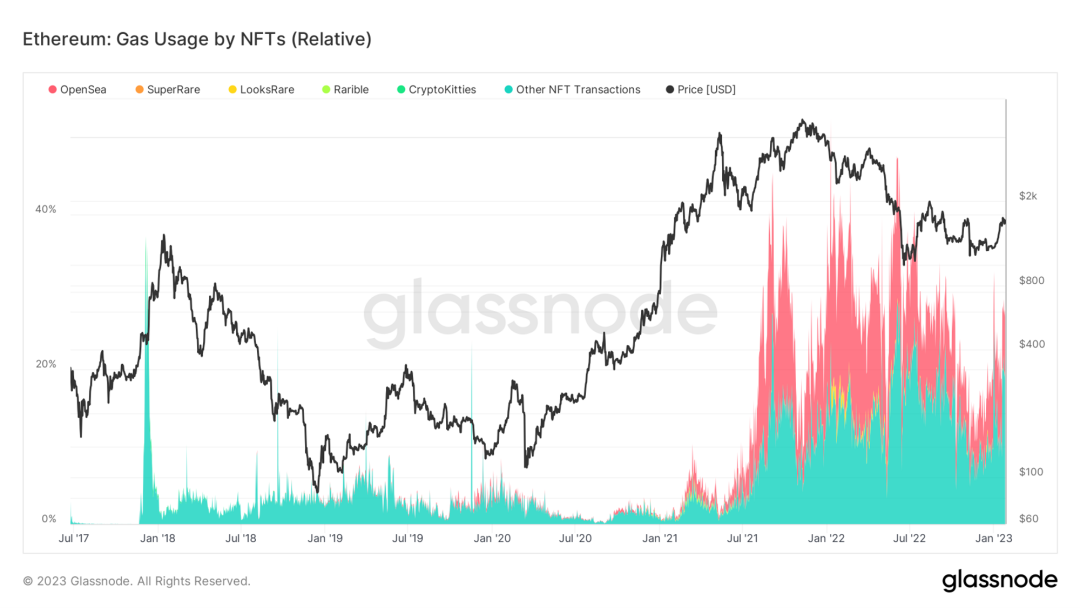
OpenSea emerged in early 2020 and significantly increased its share of gas usage after mid-2021. It remains the dominant NFT market, except for a brief period in January 2022, taking up enough gas usage to make a noticeable mark on the overall chart, when LooksRare took up enough gas usage to briefly Appears next to OpenSea.
Stablecoin gas usage
The gas usage share breakdown for stablecoins also highlights USDT's dominance. The graph below shows the gas usage share of major stablecoins since early 2018. The figure below shows the use of stablecoins in ETH gas
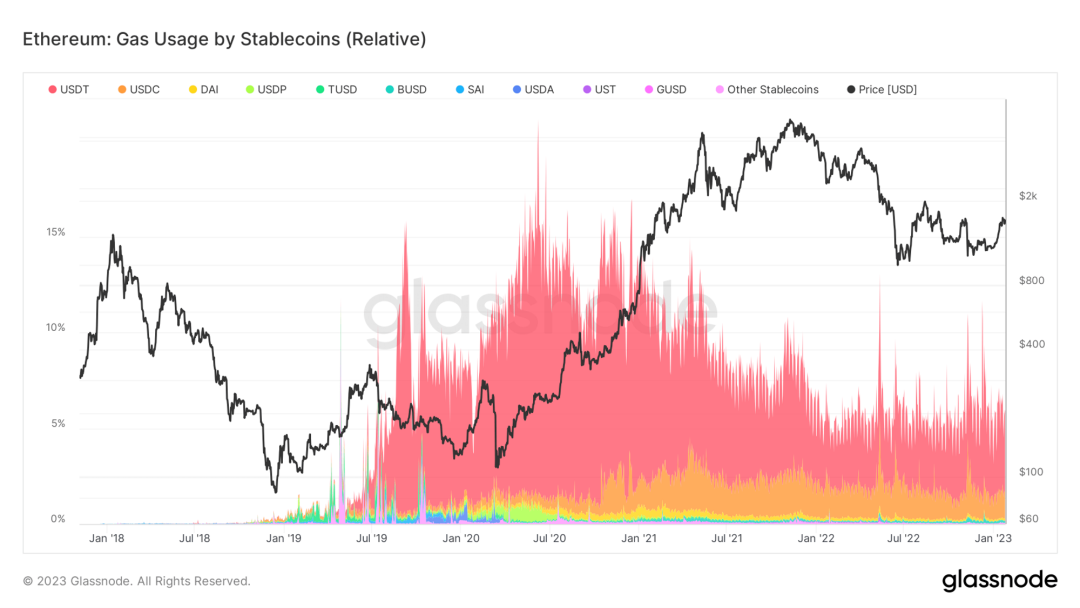
Although USDT is still the main stablecoin, its share has dropped significantly from 11% to 4%. USDC, on the other hand, appeared on the charts in early 2020 and has been slowly but steadily increasing its share of Gas usage since then.
Summarize:
The heat and signs of recovery of the NFT market can be found through the Gas usage on ETH. Observe the Gas usage of the Erc20 protocol (Token) and stable coins. The proportion of stable coins continues to decline and flow out. It also represents the timeline from the emergence of NFT in 2018 to its gradual emergence. What needs to be paid attention to is that the Defi market and the popularity of Token or the outbreak of the Meme market are also strongly related to ETH Gas. Currently, through the analysis of Gas transaction volume, it is still in the market. recovery phase.