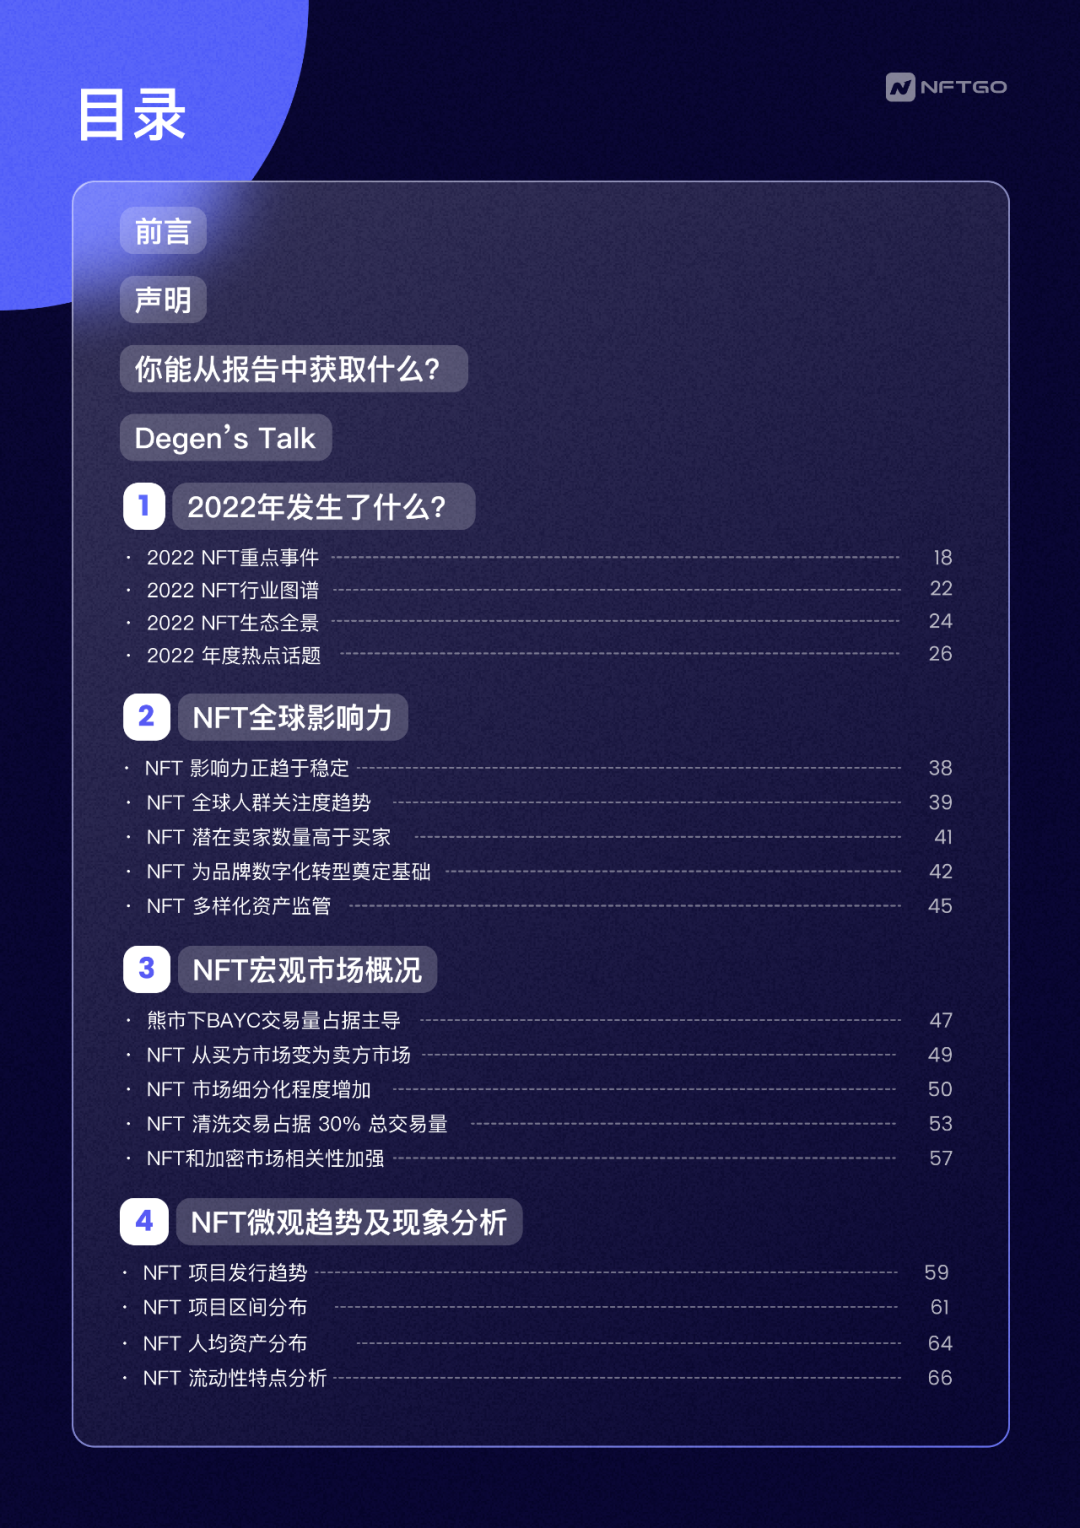
 2023 NFT Annual Report NFTGo Research wrote an annual report of more than 180 pages, including 10 chapters, 50+ multi-dimensional charts, and interviewed 9 senior NFT players to explore the industry trends in 2023. (Report download link: https://nftgo.io/research/reports/2023-nft-annual-report )
- Curious who made your money in the NFT market?
- What strategy will the giant whale adopt in firm offer trading?
- How do project parties such as BAYC and Azuki plan for the future?
- KOLs and researchers are bullish or bearish on the market outlook?
- Which NFTs are more popular with investors?
- What are the new changes in the NFT industry this year compared to last year?
- What is the age, region and gender distribution of NFT players?
- What is the distribution trend and quantity of NFT projects?
- Which public chains and NFT platforms have the most potential?
- How correlated are the NFT and ETH markets?
Download the "NFT Annual Report 2023" to learn more data, currently available in 5 languages: Chinese, English, Western, Japanese, and Korean. Note: This article is only a guide. For the full version, please open this link or click to read the original article: https://nftgo.io/research/reports/2023-nft-annual-report
4 trends
1. Among the top ten topics related to NFT, we found that the most relevant topics with soaring attention are: Stepn, azuki, labyrinth and Neymar. The World Cup and move-to-earn have attracted many newcomers to join the NFT ecosystem and participate in transactions.
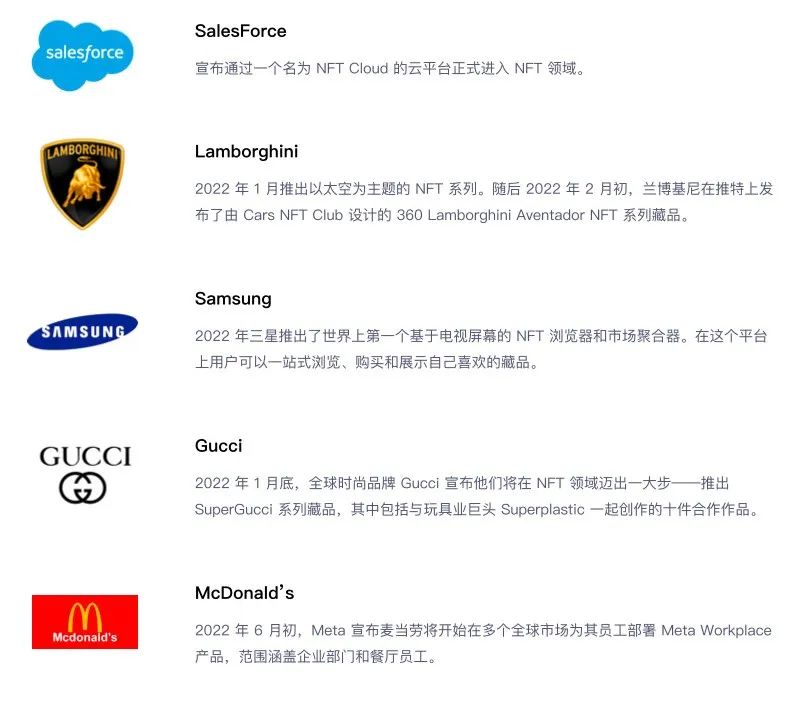
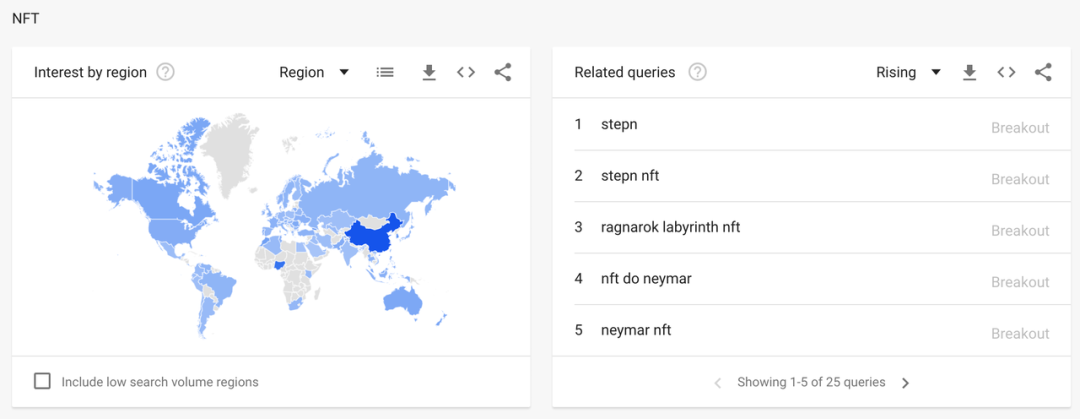 Google’s global statistics of “NFT” related hot search words in 2022, data source: Google Trends Among all the cases where Web2 brands and NFTs are combined, sports brands perform the most eye-catching, especially Nike, after the acquisition of RTFKT Studios, its secondary The market transaction volume has exceeded 10 billion U.S. dollars, and generated as much as 185 million U.S. dollars in revenue, including 93.13 million U.S. dollars in primary market revenue and 92.81 million U.S. dollars in royalties.
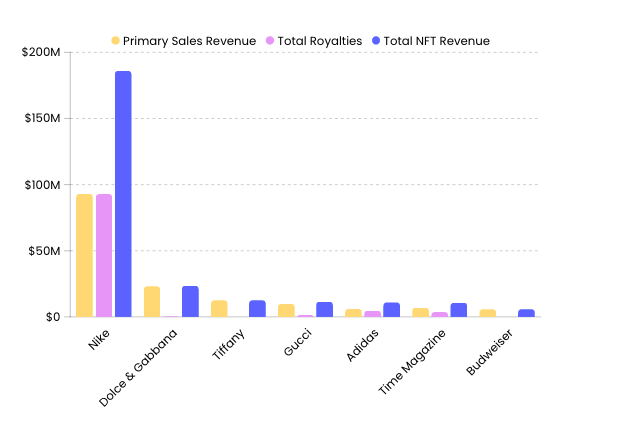 2022 brand release NFT data, data source: Dune [email protected]
 2. This year, NFT has triggered unprecedented discussions, which has greatly accelerated the birth of NFT application scenarios, such as: the digital identity crisis caused by SBT, the wave of fragmentation and the lending crisis, the sharing of market share by trading platforms, the opening of copyright and royalty income for creators, PASS empowerment and O2O marketing...
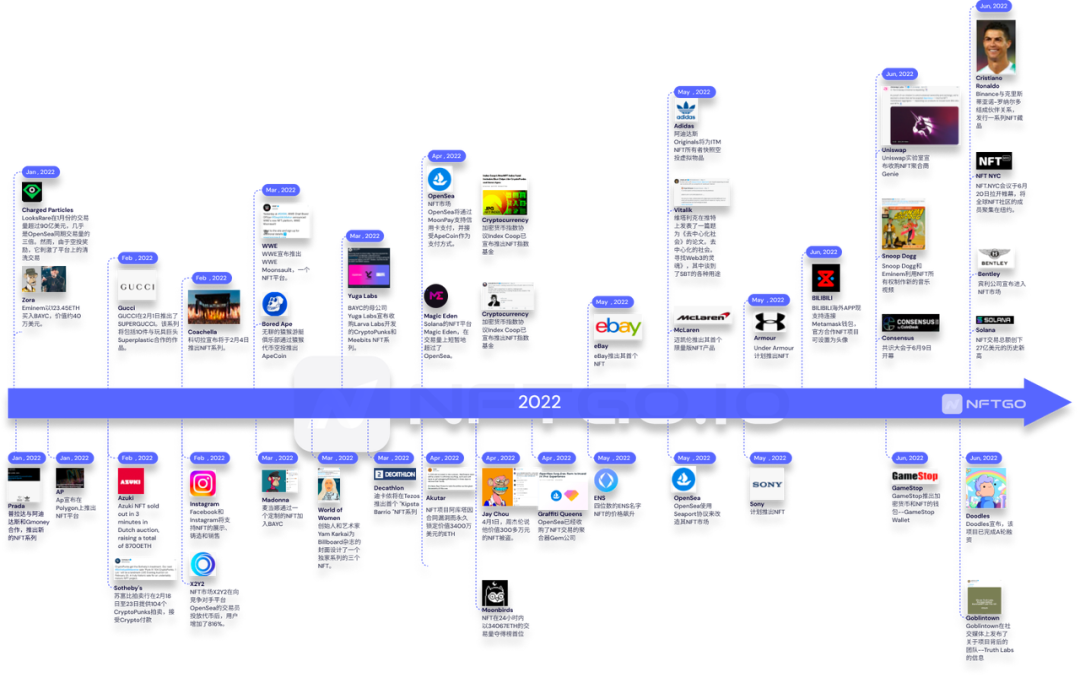
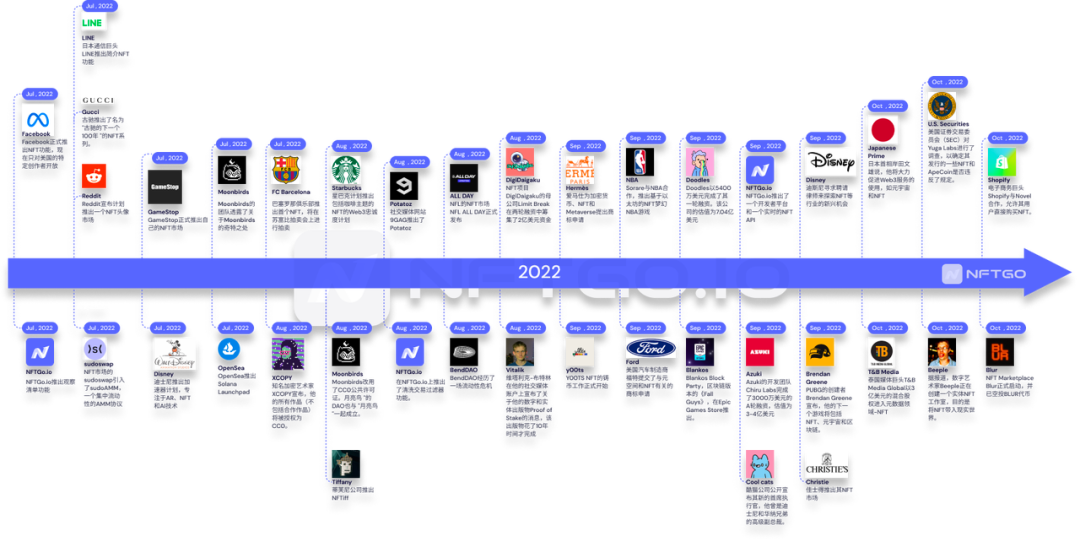
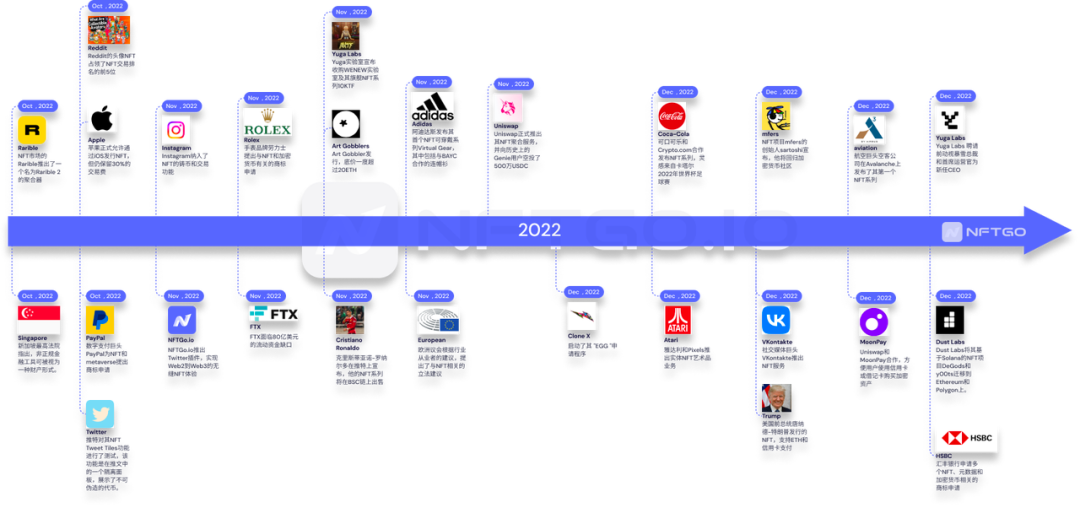 NFT key event map (2016-2022 year time map, please click to read the original text to download the high-definition version)
3. The NFT ecology is expanding in a blowout manner, the protocol layer is flourishing, and the underlying public chain continues to "one super and many strong", and financial attributes have spawned more derivative projects, which are ahead of application scenario projects.
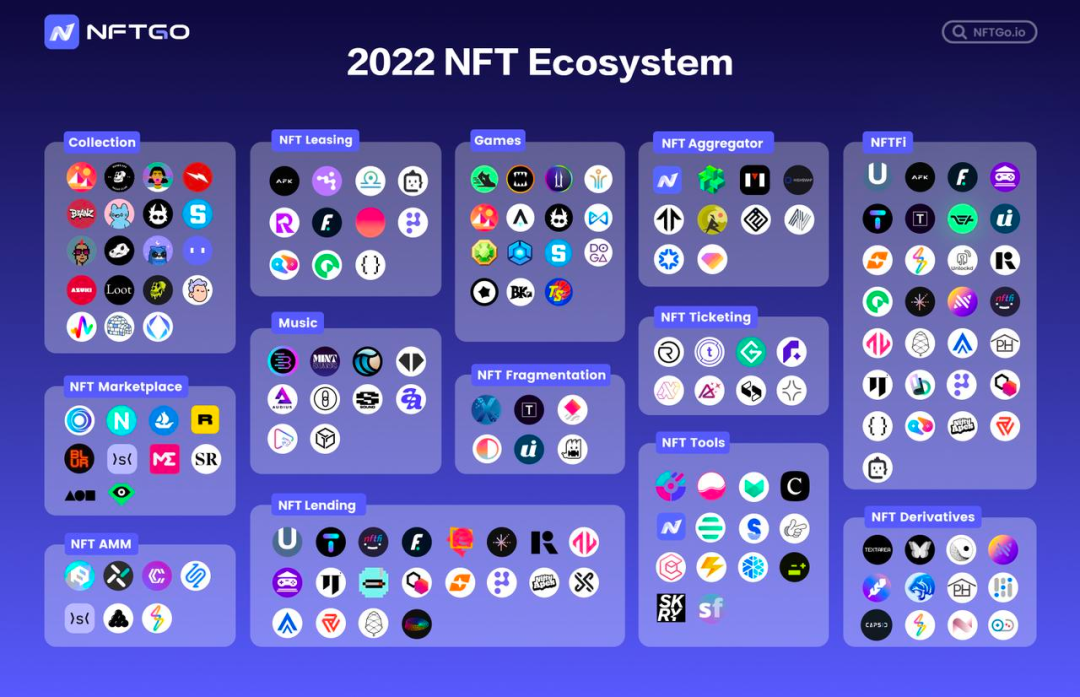
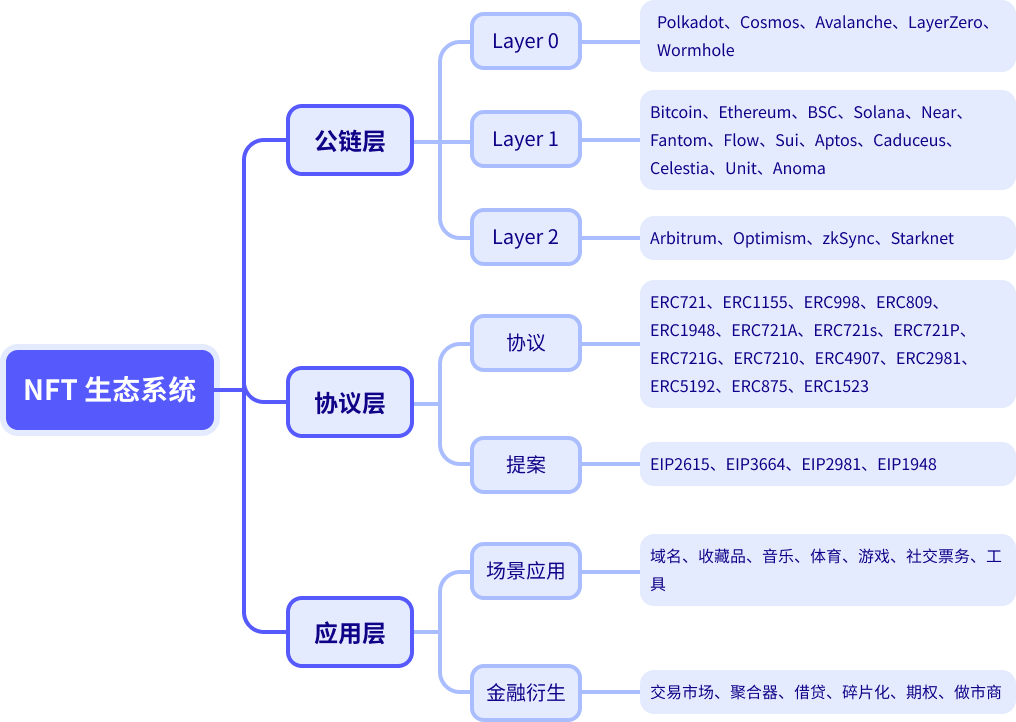 Ecological map
4. Some pioneering NFT project parties began to gradually put their ideas to the ground. They all experienced "turning off the virtual and turning to the real" after financing, and used the additional issuance of derivative NFT to expand the user base.
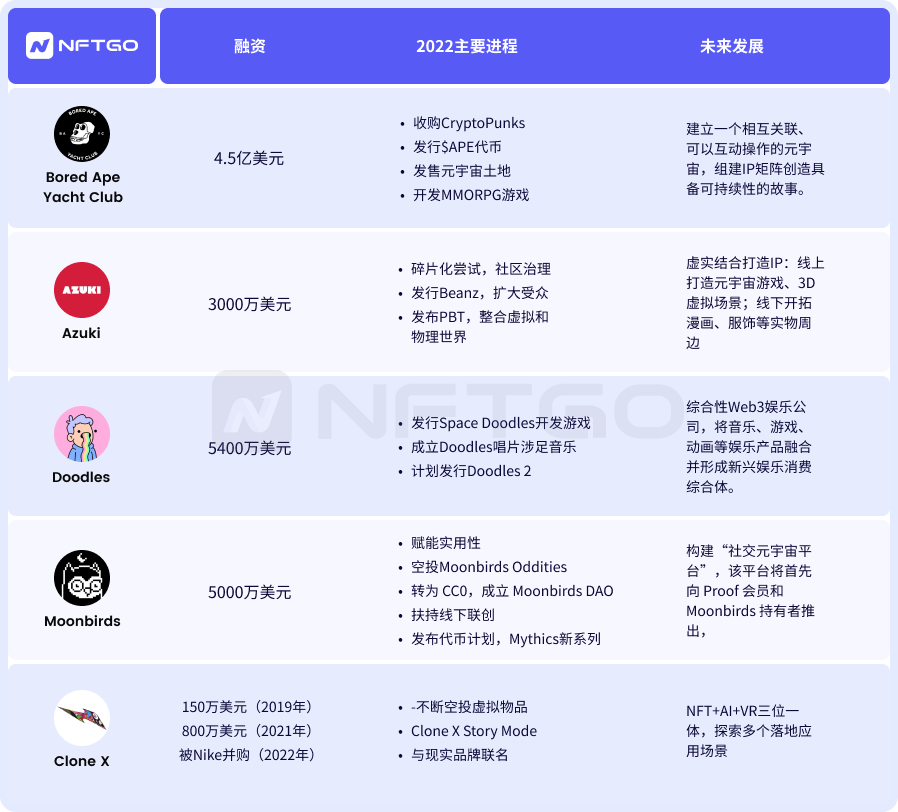
The main progress and future plans of the NFT project
13 data
1. At present, there are 3.73 million NFT holders, an increase of 187.18% compared with last year. Compared with the market relationship in the first half of the year, the number of traders has decreased significantly in the second half of the year, and the market trend has changed from a buyer's market to a seller's market.
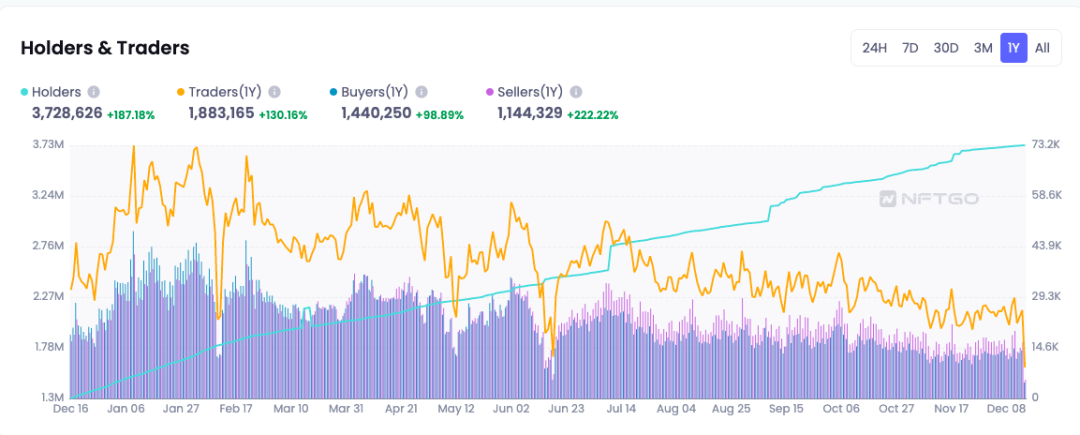
Number of NFT Holders & Traders in 2022, data source: NFTGo.io
2. During the bear market period, the driving effect of leading projects is obvious. Among them, the trading volume of BAYC occupies a dominant position, accounting for the largest 7% of the total trading volume. It is close to Otherdeeds and MAYC, which belong to the Yuga Labs ecology, and the trading volume accounts for 5.47% respectively. and 5.07%. Blue-chip NFT reacts more slowly when the market falls, and has a certain hedging nature.
 2022 annual blue chip index, data source: NFTGo.io
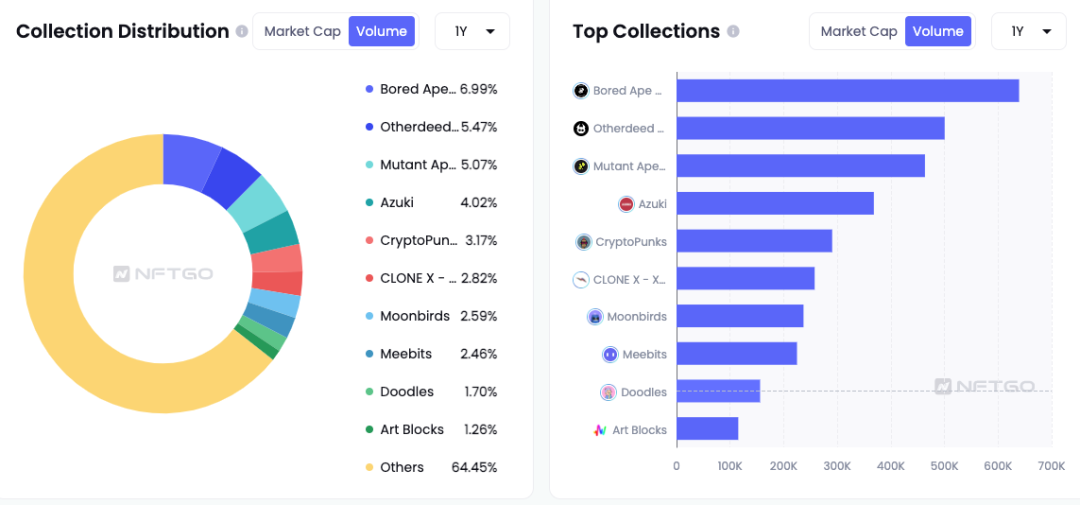 The proportion of transaction volume in different collections, data source: NFTGo.io
3. The Pearson correlation coefficient between NFT and ETH in Q2 was as high as 0.98, and then the correlation gradually decreased. This is not only related to the macroeconomic environment, but also closely related to the independent market and trading conditions. For example, when the market value of the encrypted market plummeted by more than 20% in June, The floor price of some top NFTs in the NFT market also fell by 15%.
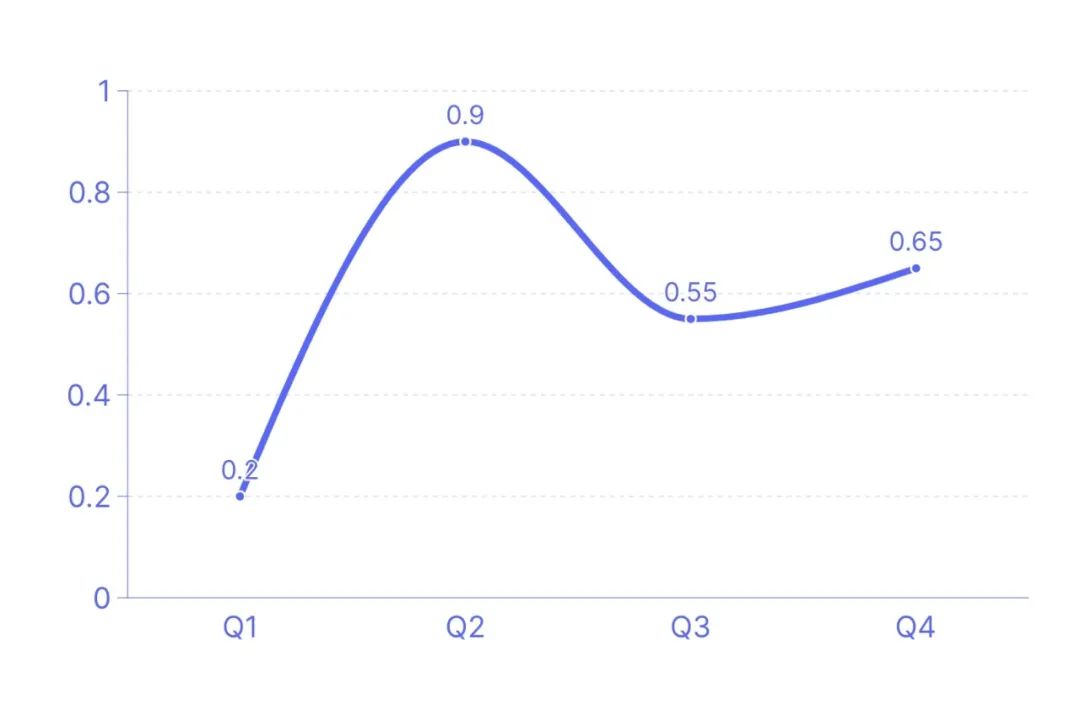 Pearson correlation coefficient of ETH and NFT, data source: NFTGo.io
4. The total amount of wash trading in 2022 is about 9 million ETH, accounting for about 35% of the total trading volume in 2022. According to the previous wash trading report of NFTGo.io, there are more than 82,000 addresses involved in swiping transactions, and the number of swiping transactions on the entire network has reached more than 250,000.
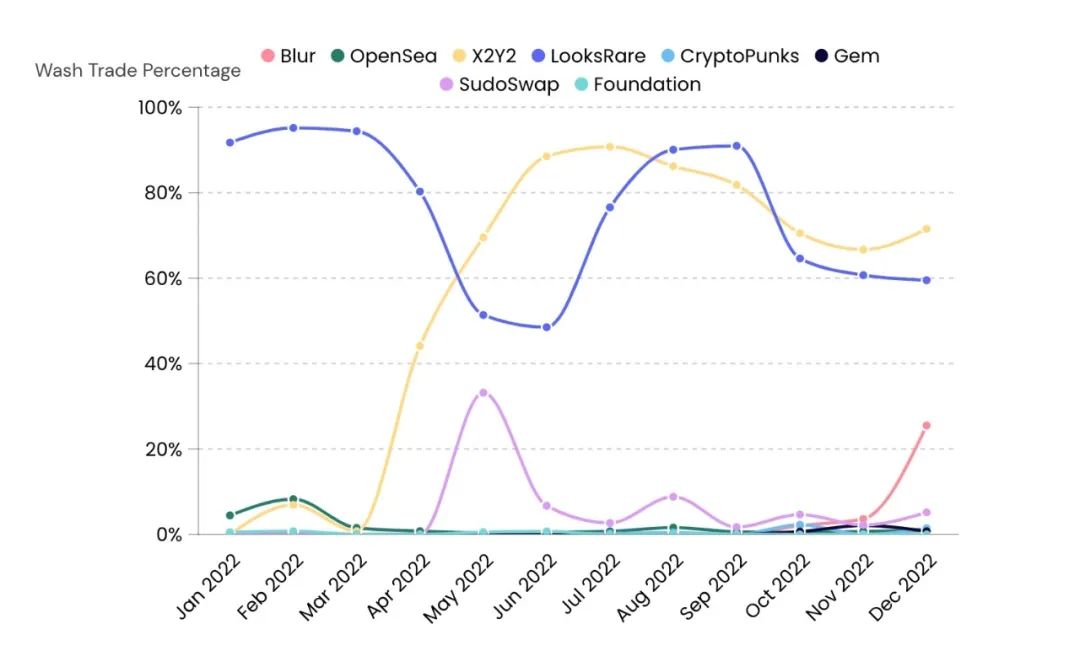 Proportion of wash trading on different NFT trading platforms, data source: NFTGo.io
5. According to the category of NFT, the total market value of PFP is about 5.64 million ETH, and it will still be the bottom skeleton of the NFT industry for some time in the future, followed by NFT related to Collectibles and Utility, whose annual transaction volume exceeds 1 million ETH, the circulation is relatively good.
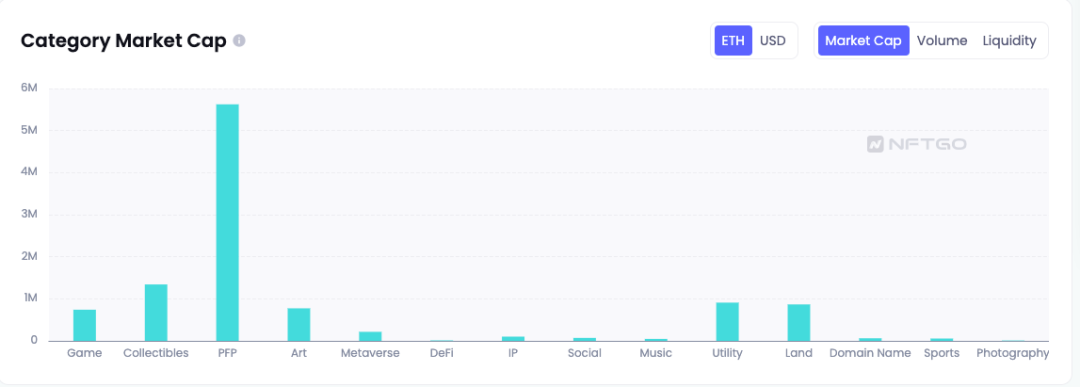 Comparison of market value of different categories, data source: NFTGo.io
6. The number of NFT issuances is growing steadily, and has reached 4,888 collections and 39,669,418 NFTs (in line with the NFTGo.io inclusion standards). Even in the context of the overall downturn in the market, the issuance of NFT projects is still evenly distributed in each month. The average monthly growth rate remained at 11.86%.
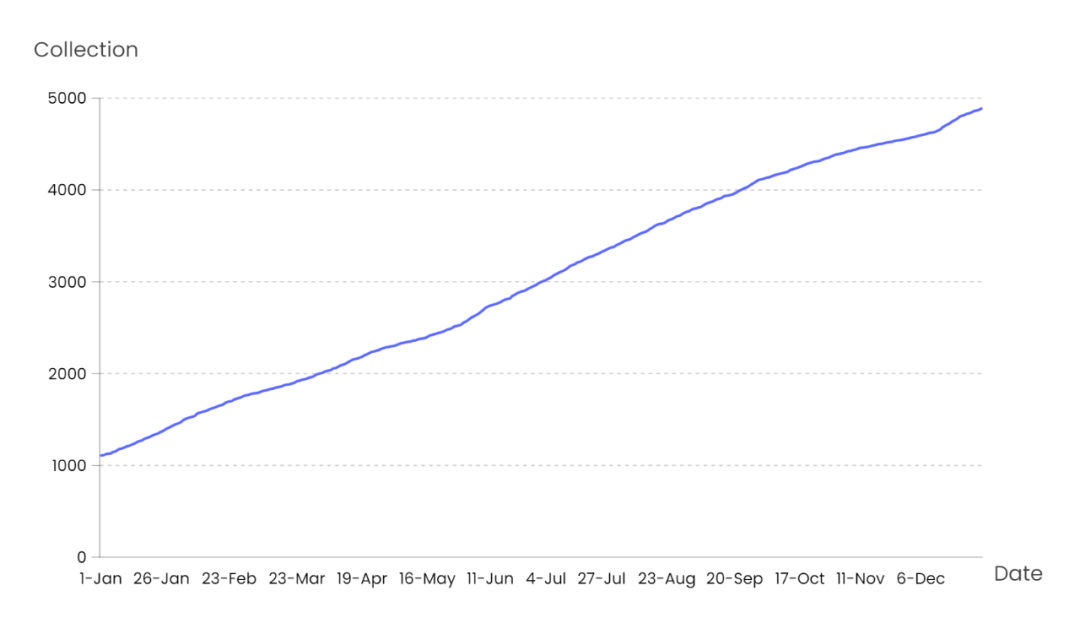
Daily issuance trend of NFT projects (reaching the index of NFTGo.io)
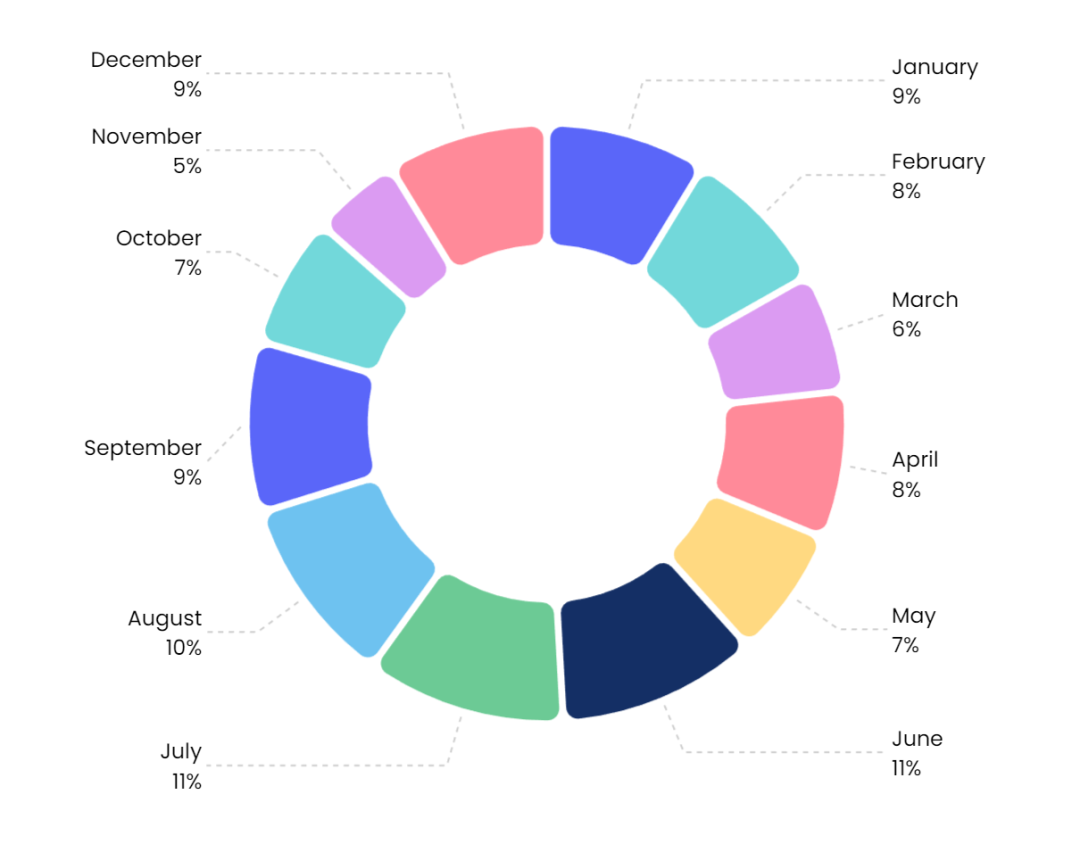 Distribution of new projects in 2022, data source: NFTGo.io
7. At present, the market value of most projects is concentrated around 100-200 ETH, only 4% of the projects have a transaction volume of more than 10K ETH, and the floor price ≤ 0.1 ETH accounts for 74% of the total number of projects. Most of the transactions in the market are still concentrated in the top quality project.
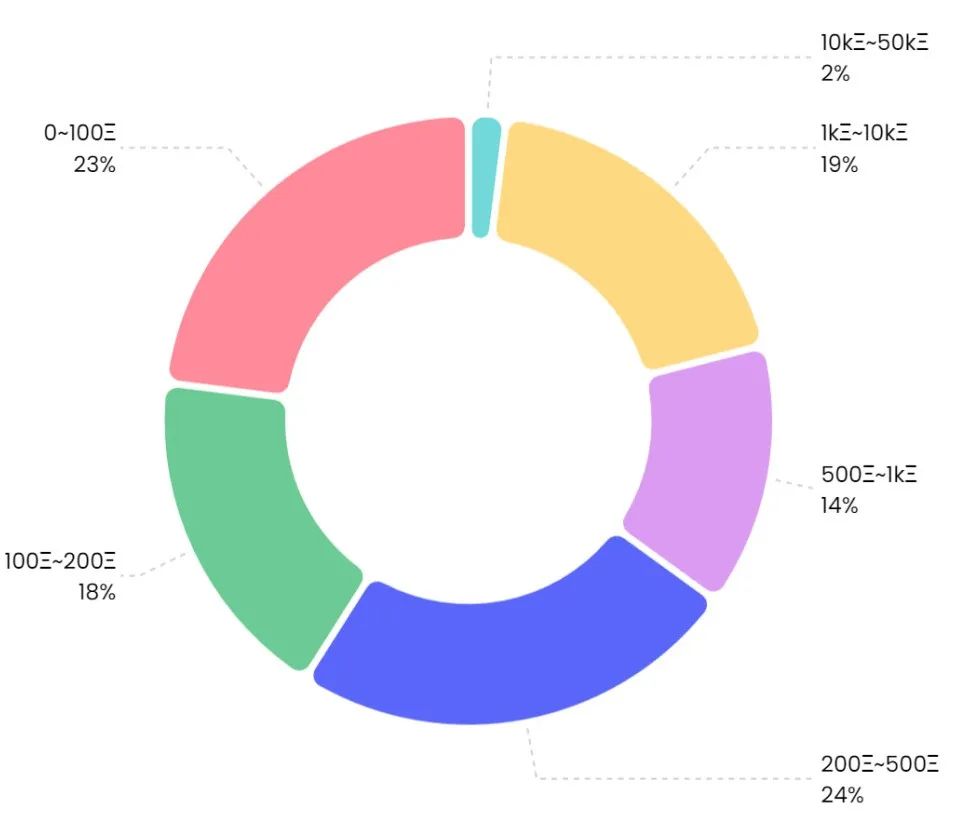
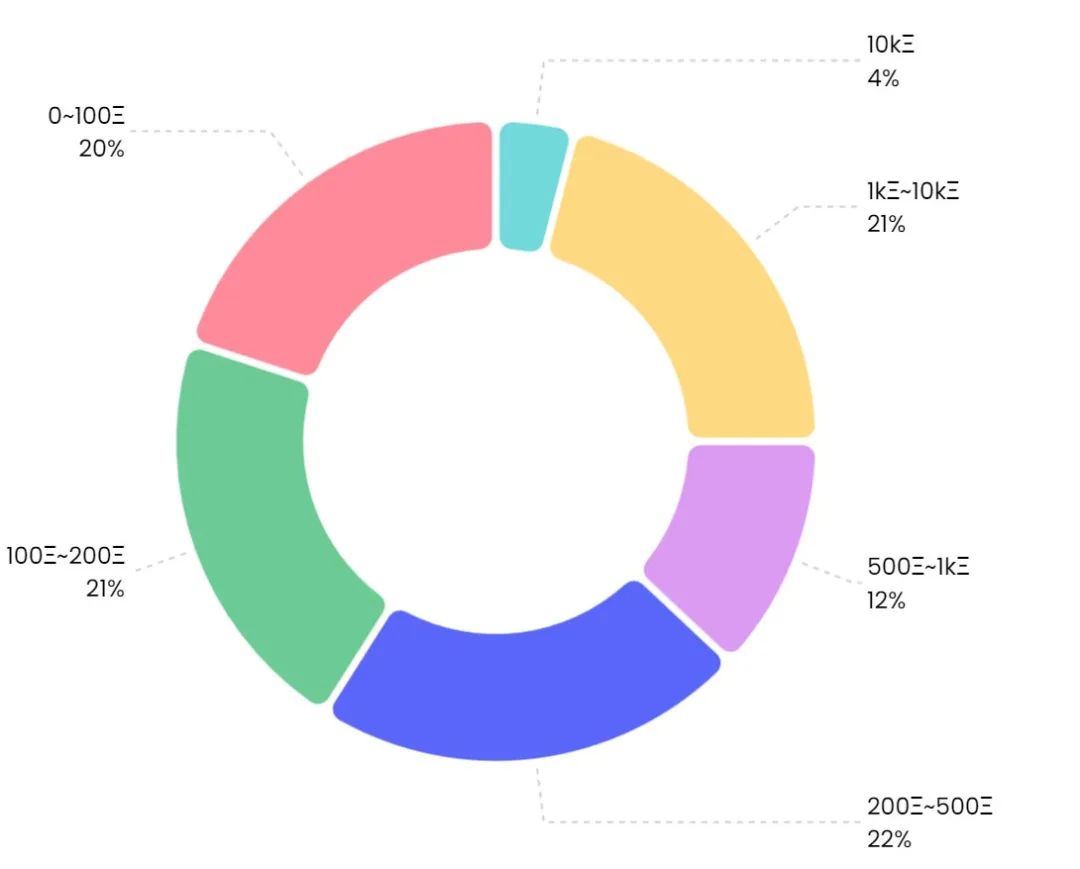
The data source of the market value range distribution of the collection: NFTGo.io The data source of the trading range distribution of the collection: NFTGo.io
8. The assets of "giant whales" have greatly increased the overall per capita assets. The average per capita assets of 748 NFT projects is $4,137, and the median is $1,461. The stratification of per capita assets also allows NFT players to form groups with different consumption capabilities, allowing NFT project leaders to design products and stratify marketing for different user needs.
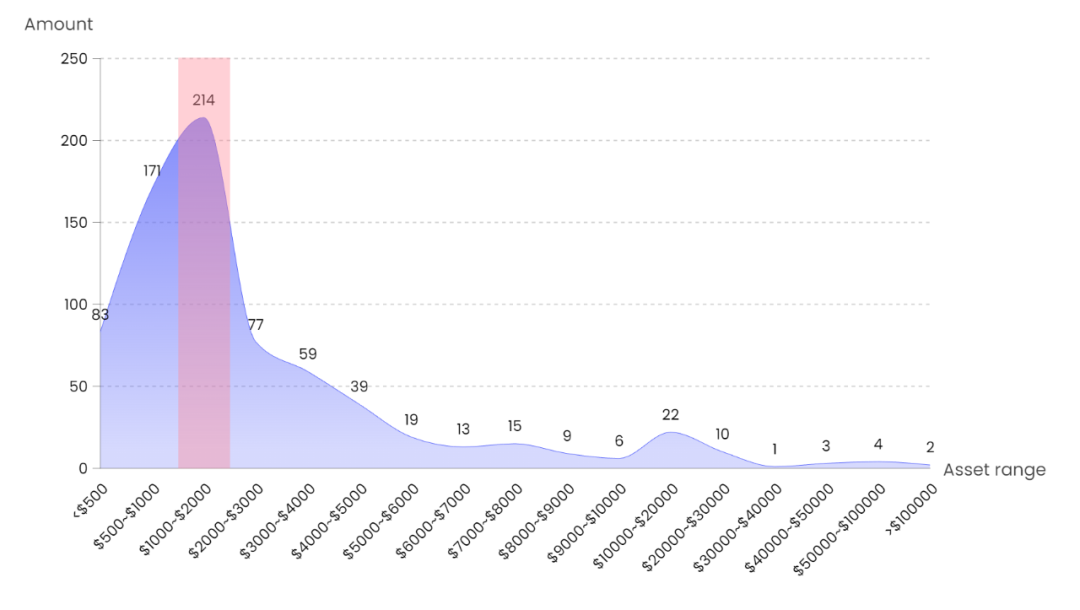 The number of single asset items per capita, data source: NFTGo.io
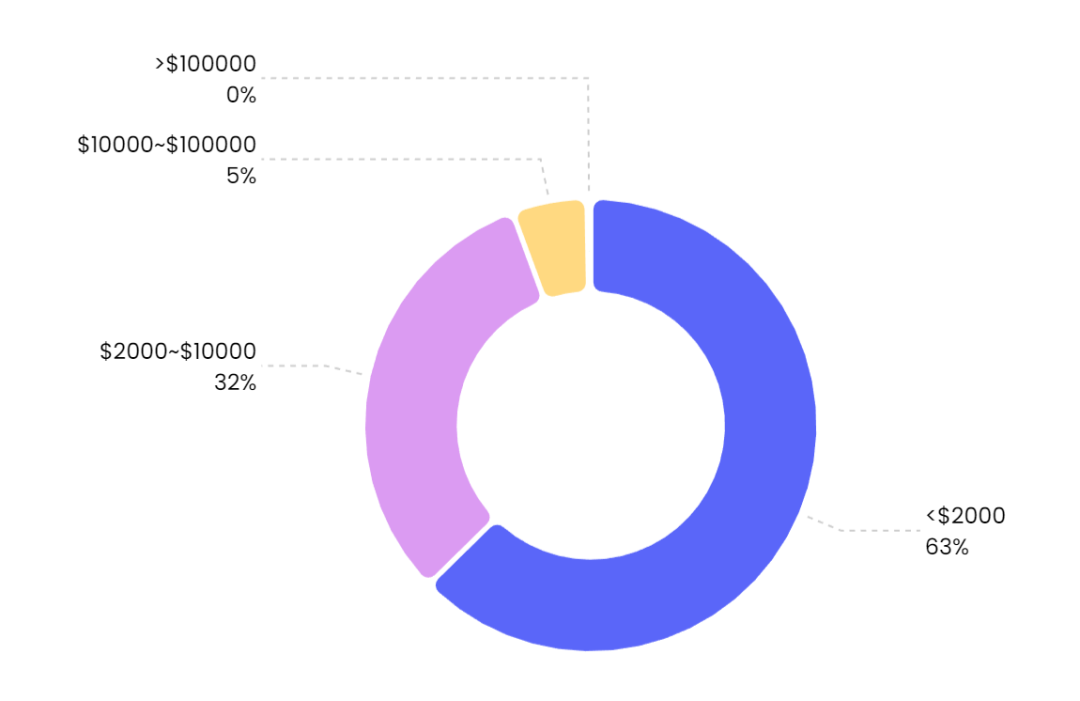 Proportion of single asset per capita, data source: NFTGo.io
9. The best period for the overall liquidity of the NFT market is January and April. In May, the liquidity began to drop sharply. September is the most exhausted period of liquidity this year, which makes most NFTs have to be "discounted" to sell quickly .
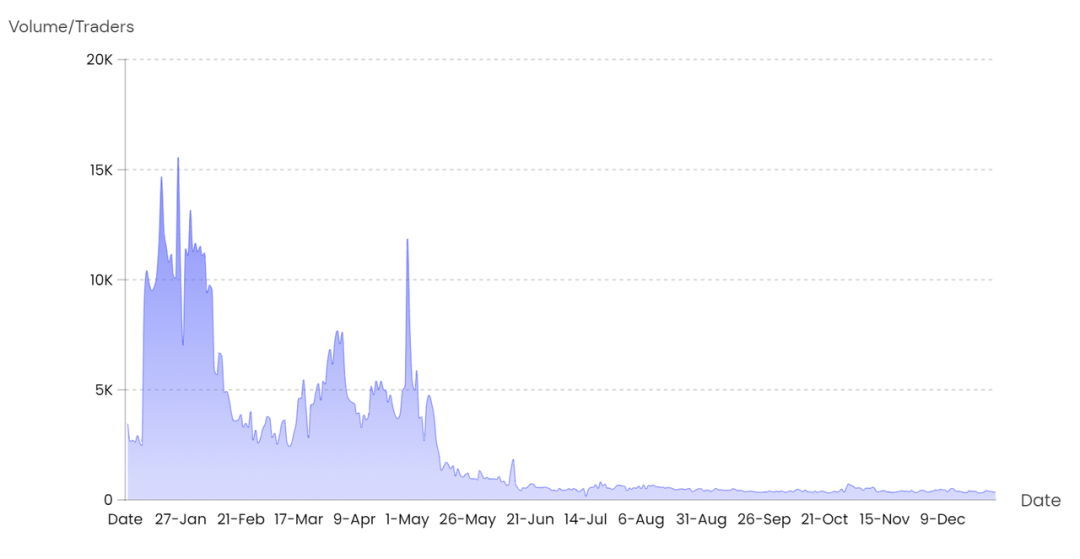 Liquidity trend graph, data source: NFTGo.io
10. The strategic behavior of the NFT user group is stratified. These users usually take profit as the first purpose, and one person holds multiple wallets. The user's gameplay is driven by the community to try to derive the gameplay. The professional data platform has formed a considerable degree in the senior player group. permeation of. As NFT attracts more users from outside the circle, and current primary users gradually transform into professional players, specialized tool platforms will be adopted by more NFT users.
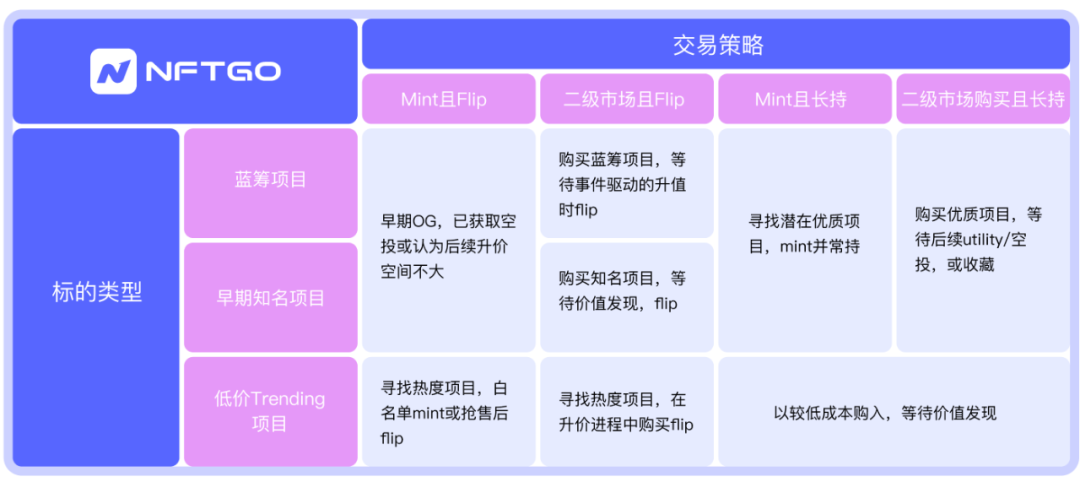 Classification of common trading strategy types, data source: NFTGo.io
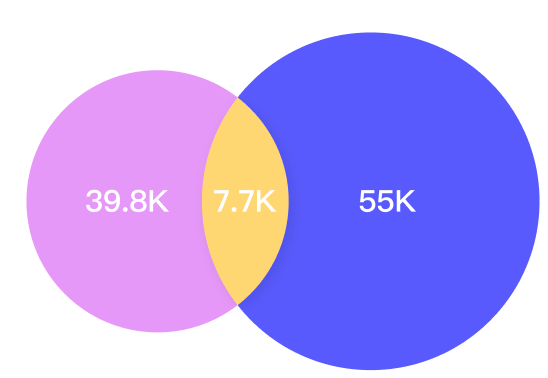 The overlapping of blue chip and Art Block trader groups, data source: NFTGo.io
11. In the market, the giant whales have the right to speak on the chain. Rather than saying that they act ahead of the market, it is better to say that their behavior affects the market trend, changing the order of market transmission into "giant whale operation - retail operation - trigger the market".
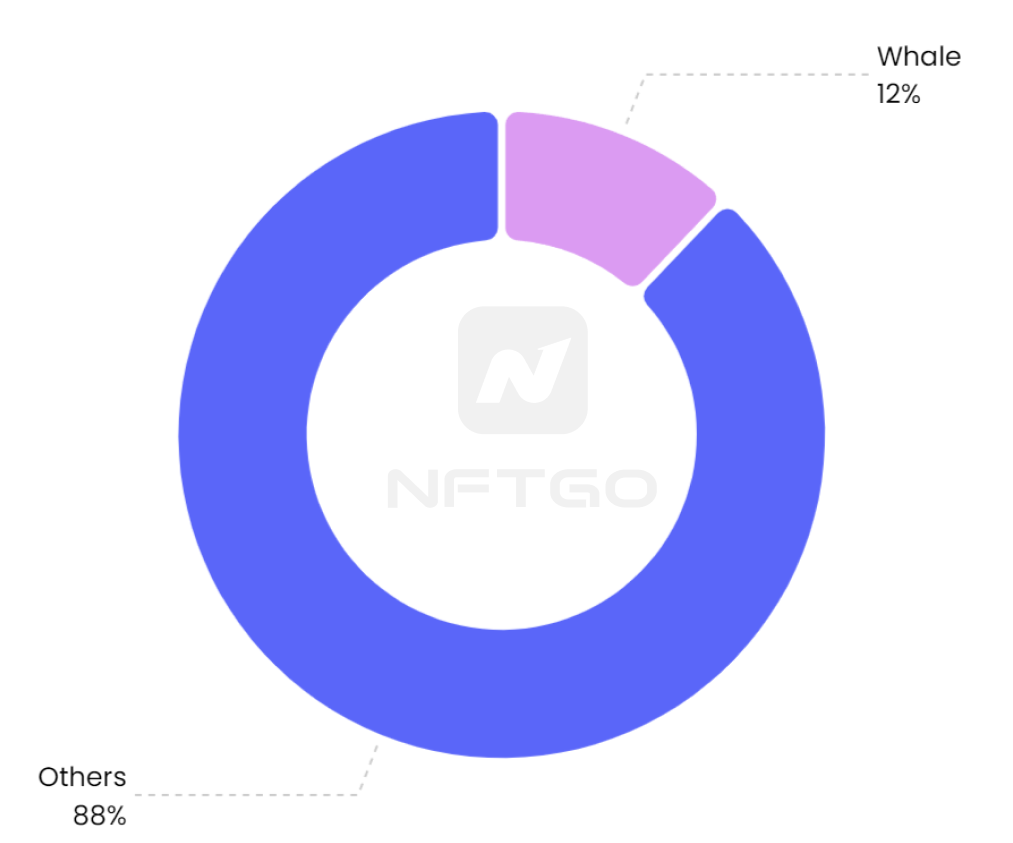 NFT market capital distribution ratio, data source: NFTGo.io
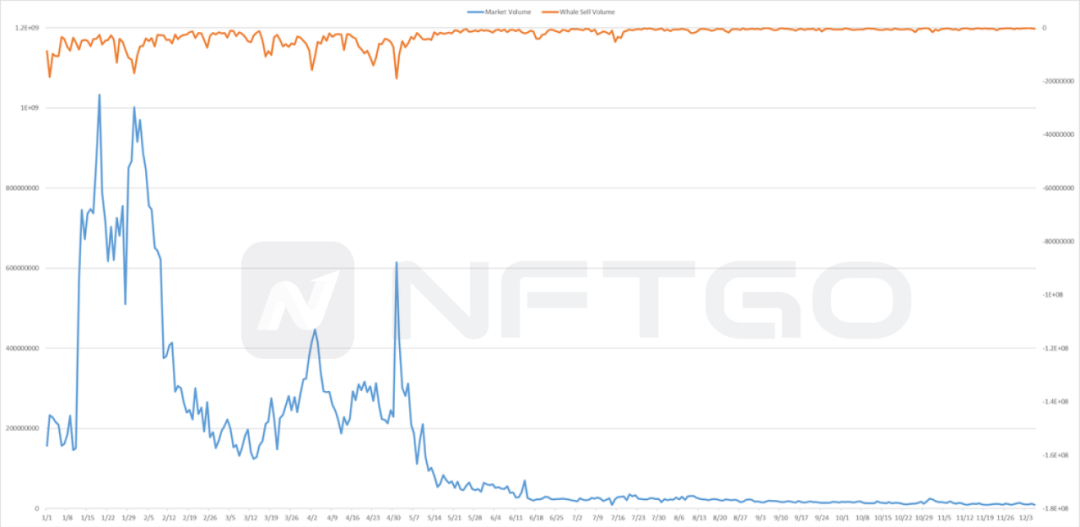 Comparison of market trading volume and giant whale selling volume, data source: NFTGo.io
12. After the giant whales experienced a collective escape from May to June this year, they still left 160 million US dollars of sedimentation funds for the NFT market, most of which included long-term and practical assets led by blue-chip NFTs. The development trend of NFT has laid the groundwork.
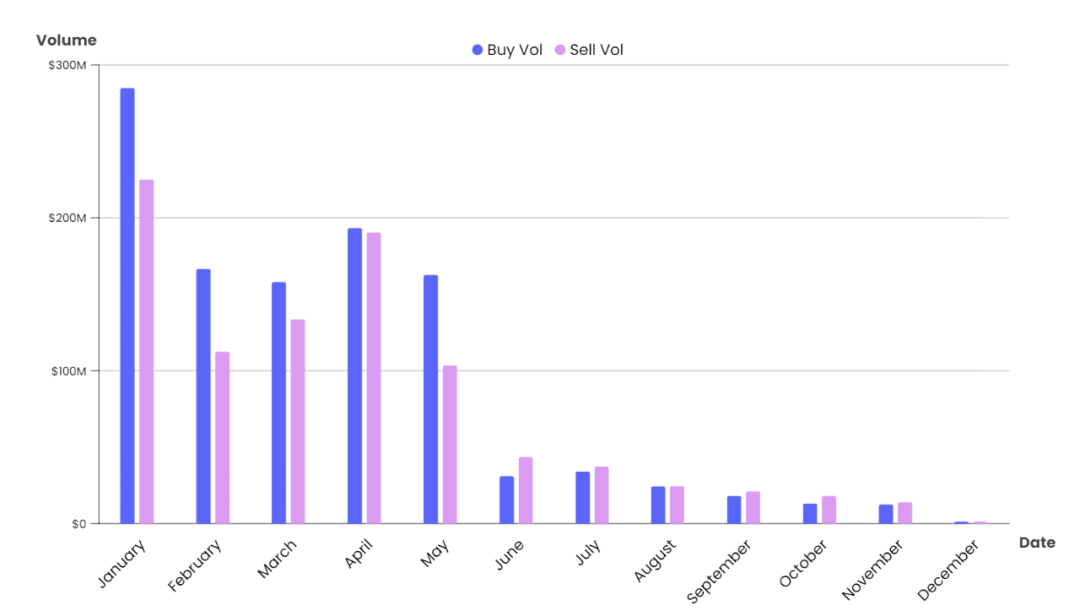 Giant whale buying and selling trend chart (monthly) data source: NFTGo.io
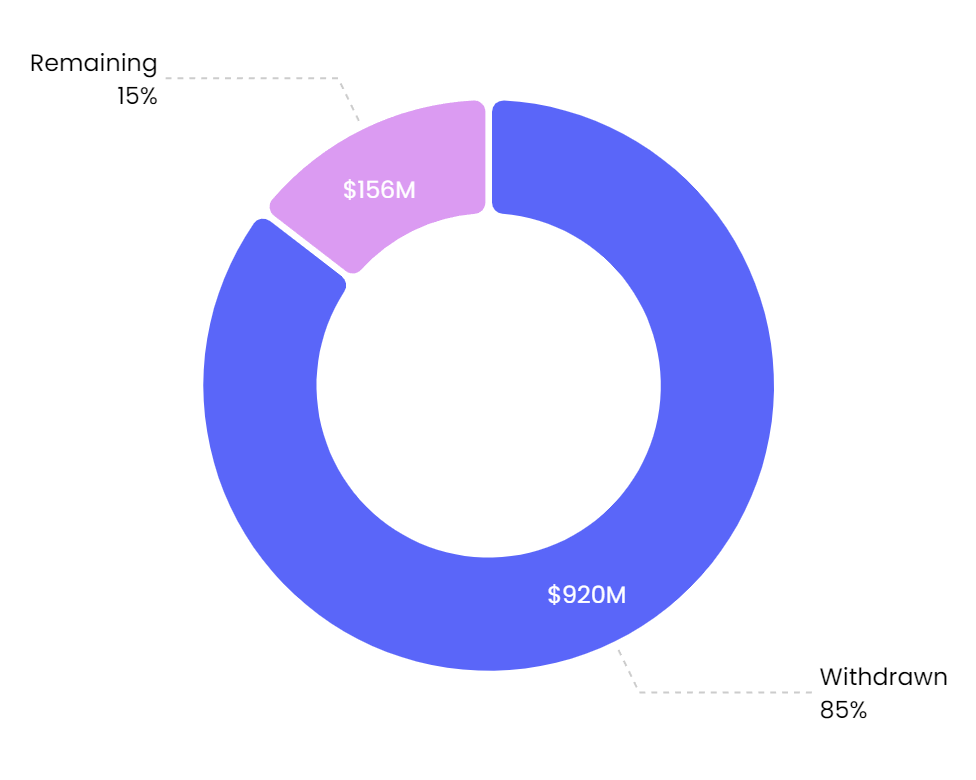 The proportion of giant whales’ investment funds this year, data source: NFTGo.io
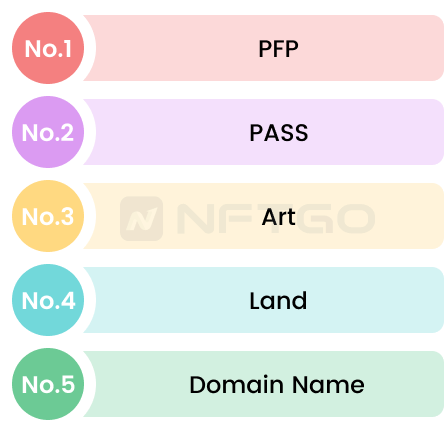
13. The investment of top users is biased. This year, they prefer PFP, PASS, and Art. They account for a large proportion of the funds of giant whales this year. This is related to the investment targets of these types of NFTs in reality. For example, the PASS card caters to the preferences of the giant whale group to a certain extent. Just as the membership card of the celebrity club is given to celebrities in real life, this consumption preference also occurs in the NFT market.
