

ADA is the native token of the Cardano blockchain platform. The ADA price has been falling since hitting a yearly high of $0.421 on Feb. 16. The drop resulted in a low of $0.297 on March 10.
The price bounced after that, confirming the $0.310 horizontal zone as support (red icon).

However, ADA failed to overcome the 0.618 Fib retracement resistance at $0.374 (red symbol). Therefore, the entire gain could be corrective.
If that is the case, ADA price can drop to the $0.31 horizontal support area once again. If broken, the price can drop to the 0.786 Fib retracement support at $0.278.
However, if ADA breaks above $0.374, a rally to at least $0.421 is probable after that.
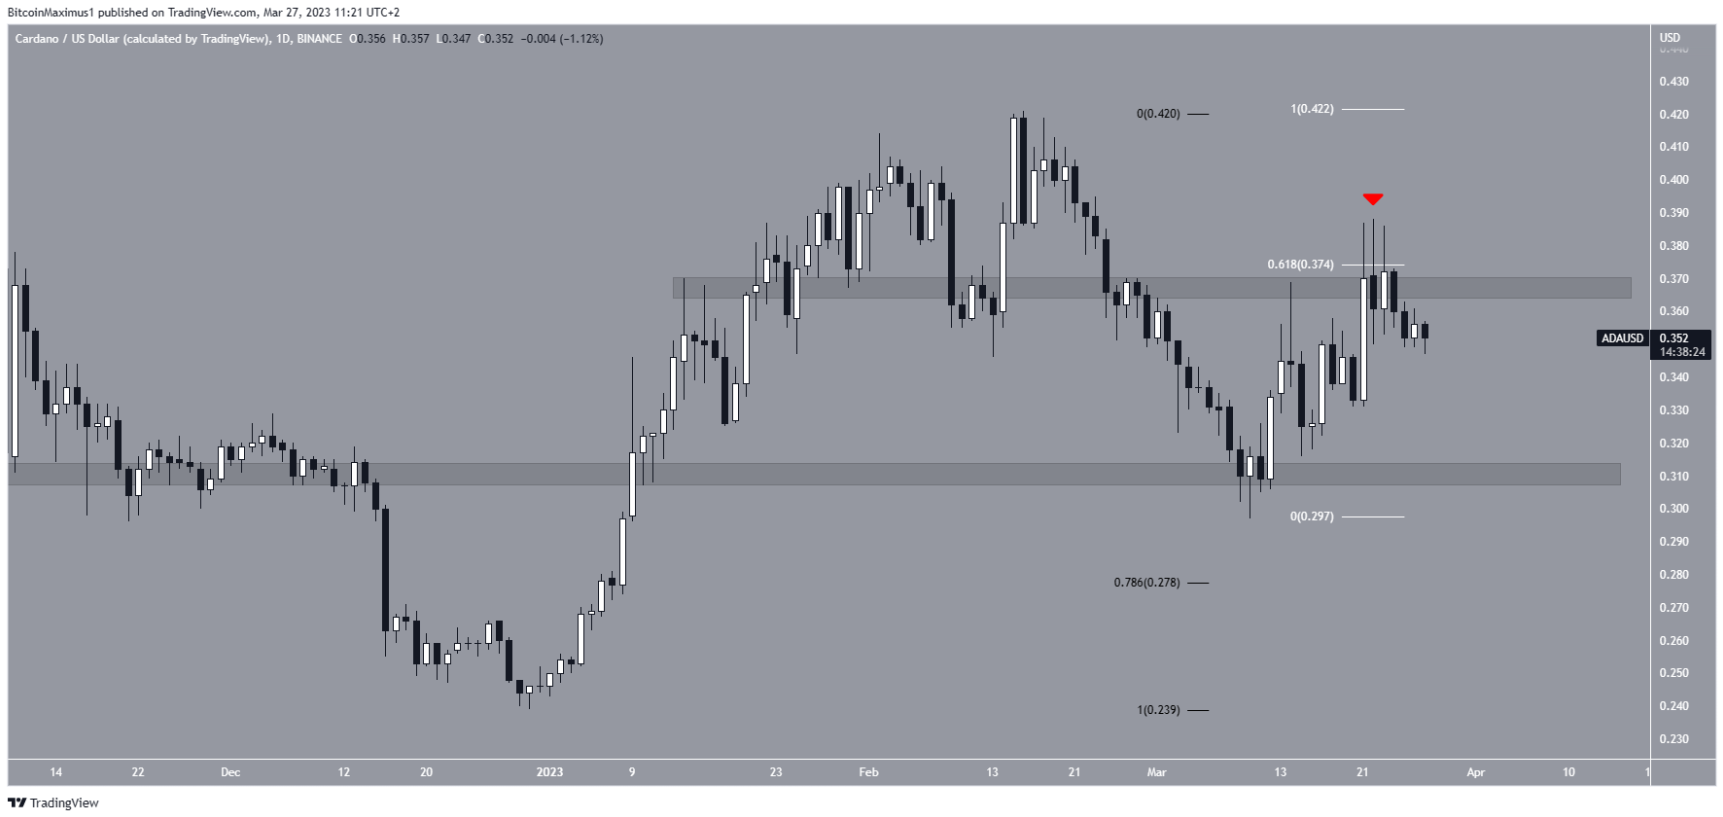
Daily ADA/USDT Chart | Source: TradingView
Technical analysis from the six-hour chart shows that ADA price has been trading inside an ascending parallel channel since the above-mentioned bounce. Such channels often contain correction patterns, that is, problems can occur from them. This is supported by the fact that the price is currently trading in the lower part of the channel and the RSI is below 50.
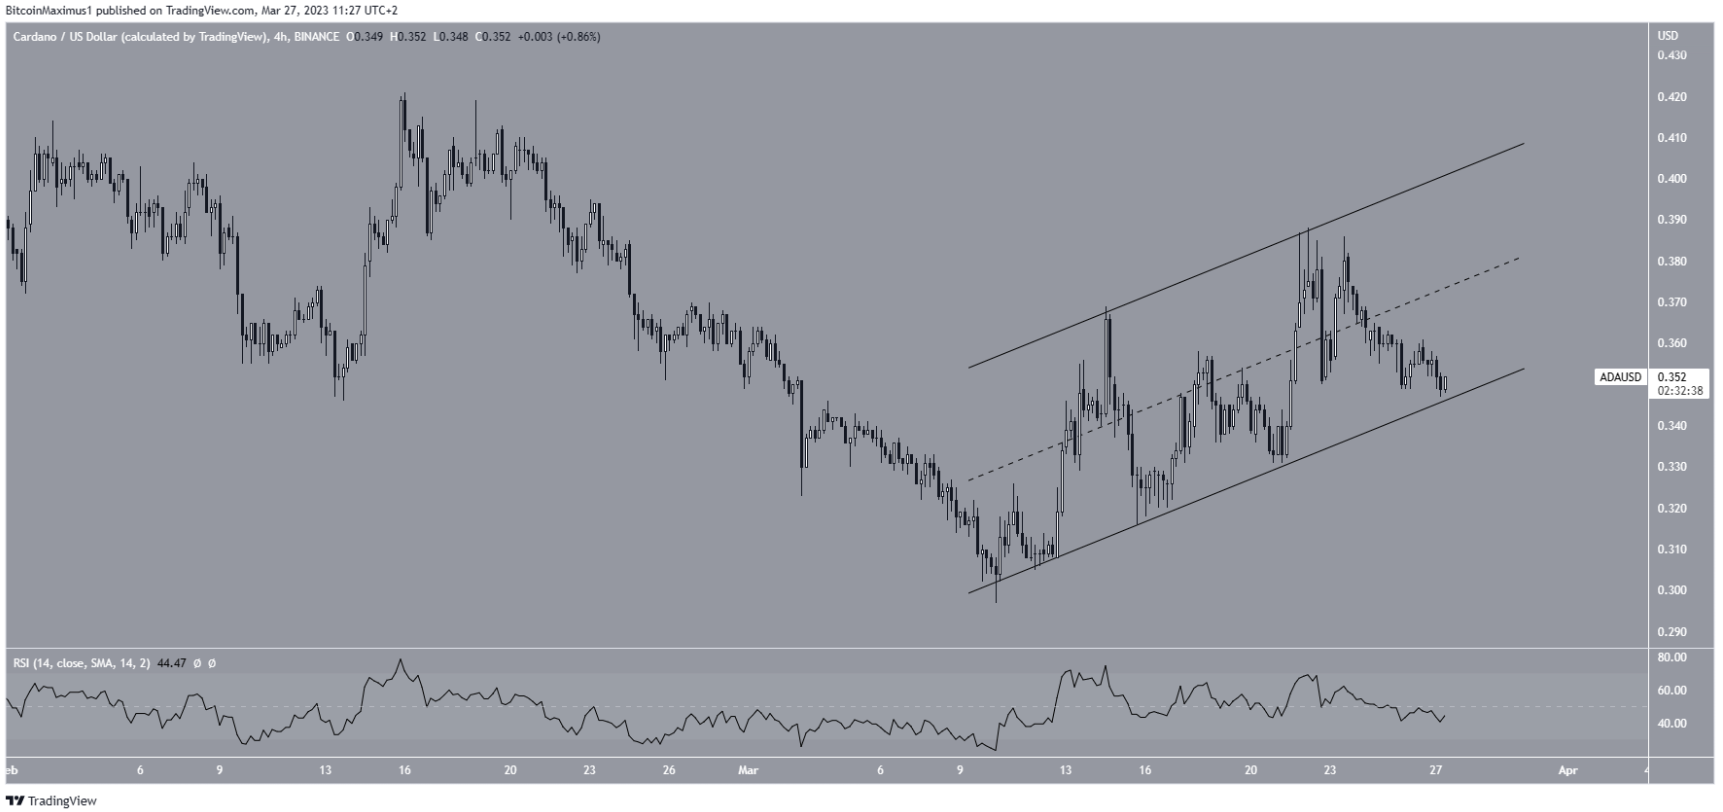
ADA/USDT 4-hour chart | Source: TradingView
Zooming out, it looks like the entire movement inside the channel was part of wave B in the ABC correction structure.
Therefore, wave C can take ADA price to the 0.786 Fib retracement support at $0.278.
On the other hand, a breakout above the channel will invalidate this bearish forecast. In that case, the ADA price can move to $0.421.
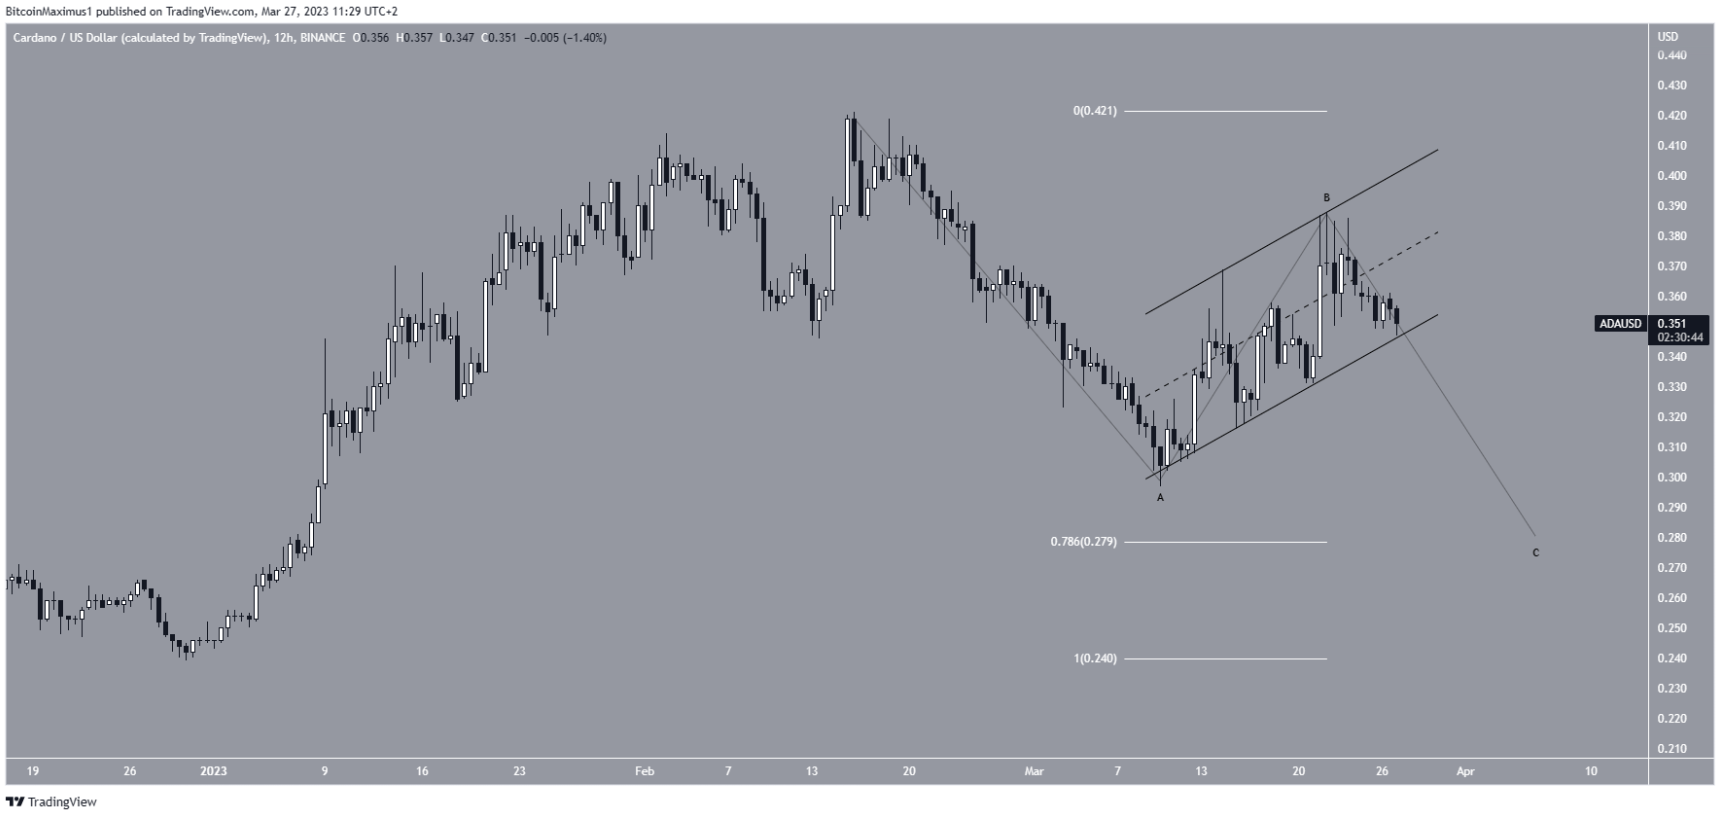
ADA/USDT 12-hour chart | Source: TradingView
In summary, the most likely forecast suggests that ADA will break below the current pattern and drop to $0.278. This will be invalidated on a rally above $0.388, which can lead the price to $0.421.
Disclaimer: This article is for informational purposes only, not investment advice. Investors should research carefully before making a decision. We are not responsible for your investment decisions.
According to Beincrypto
FOLLOW US ON FACEBOOK


