

Bitcoin ( BTC) surged to a 10-month high on April 10 as traders awaited the April 12 Consumer Price Index report for a better understanding of the Federal Reserve's fight against inflation. Federal Reserve. If the report shows a drop in inflation, then that could be the next catalyst that could drive BTC's upside move.
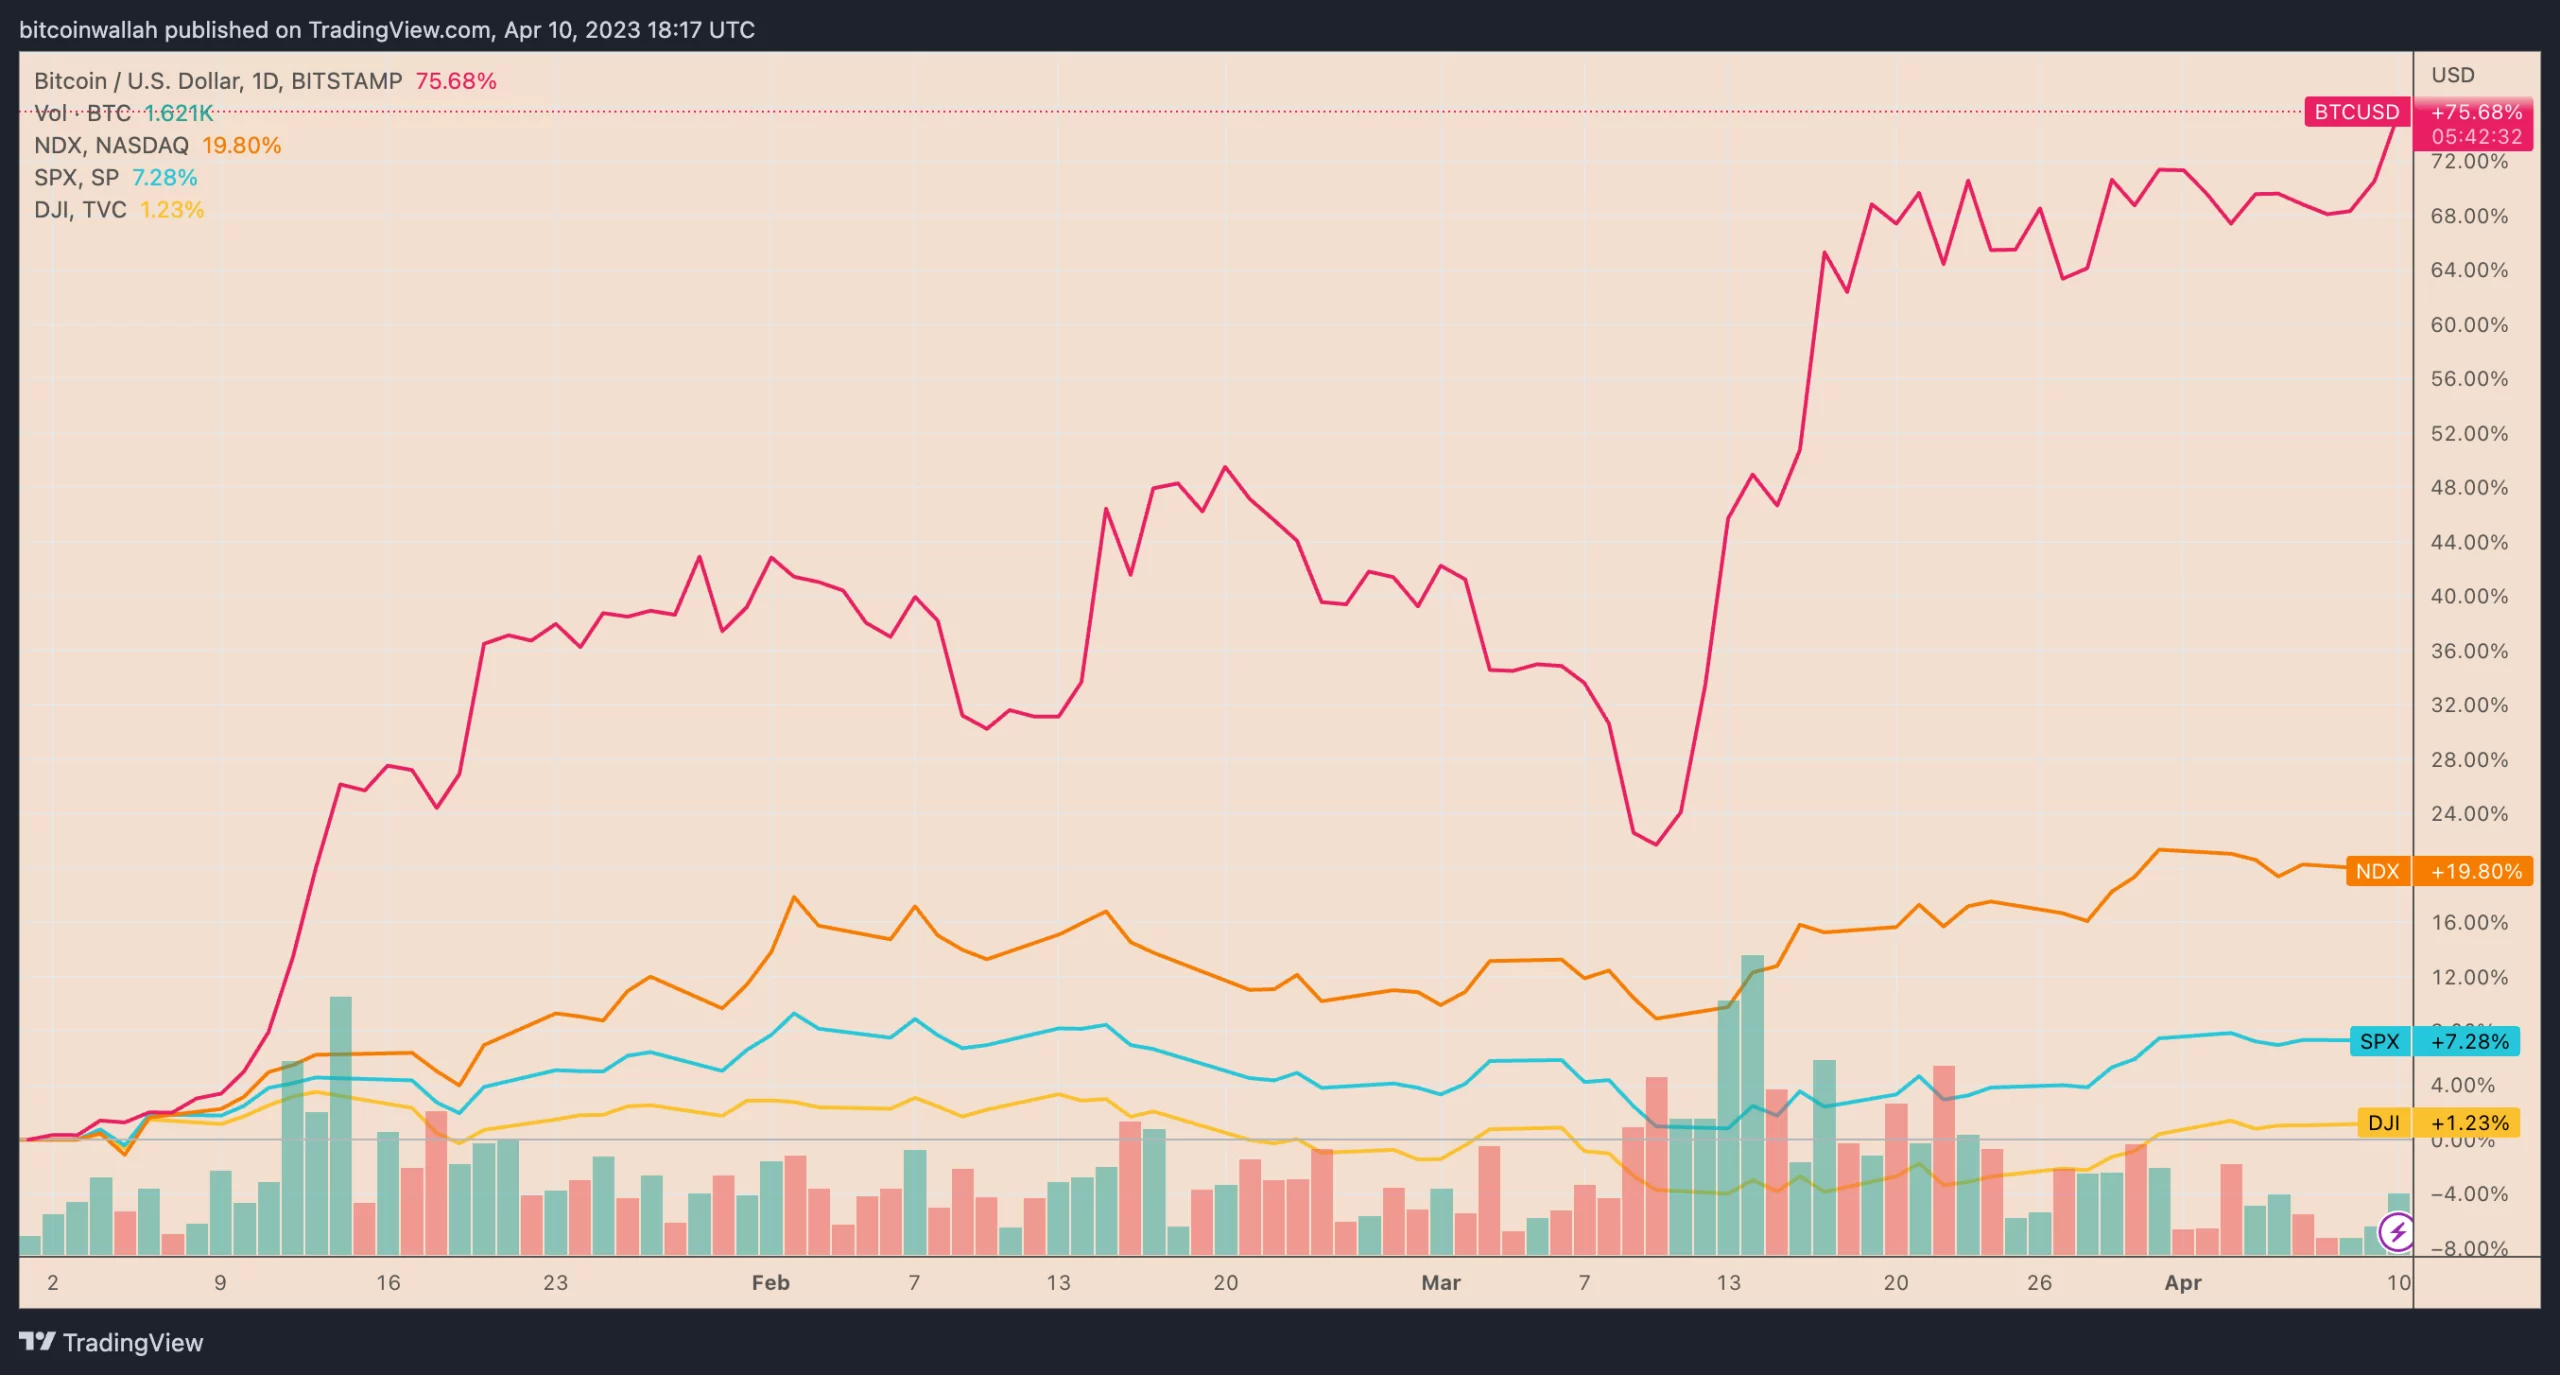
On April 10, BTC price surged 5.16% to over $29,800 after a quiet weekend. Interestingly, Bitcoin's intraday gain came along with a drop in US equities, a rare decoupling that highlights the coin's diminishing risk-on characteristics.
Momentum ahead of CPI may take effect
The Bureau of Labor Statistics will release March Consumer Price Index (CPI) data on April 12, which is expected to show inflation falling to 5.1% from 6.0% over the same period. period last year.
The CPI slowdown raises the prospect that the Federal Reserve will move in a more dovish direction. Conversely, rising inflation could prompt traders to bet on more rate hikes in May.
Bitcoin’s rise above $29,000 shows that crypto traders have priced in falling inflation, which, in turn, could lead to a potential Fed pivot.
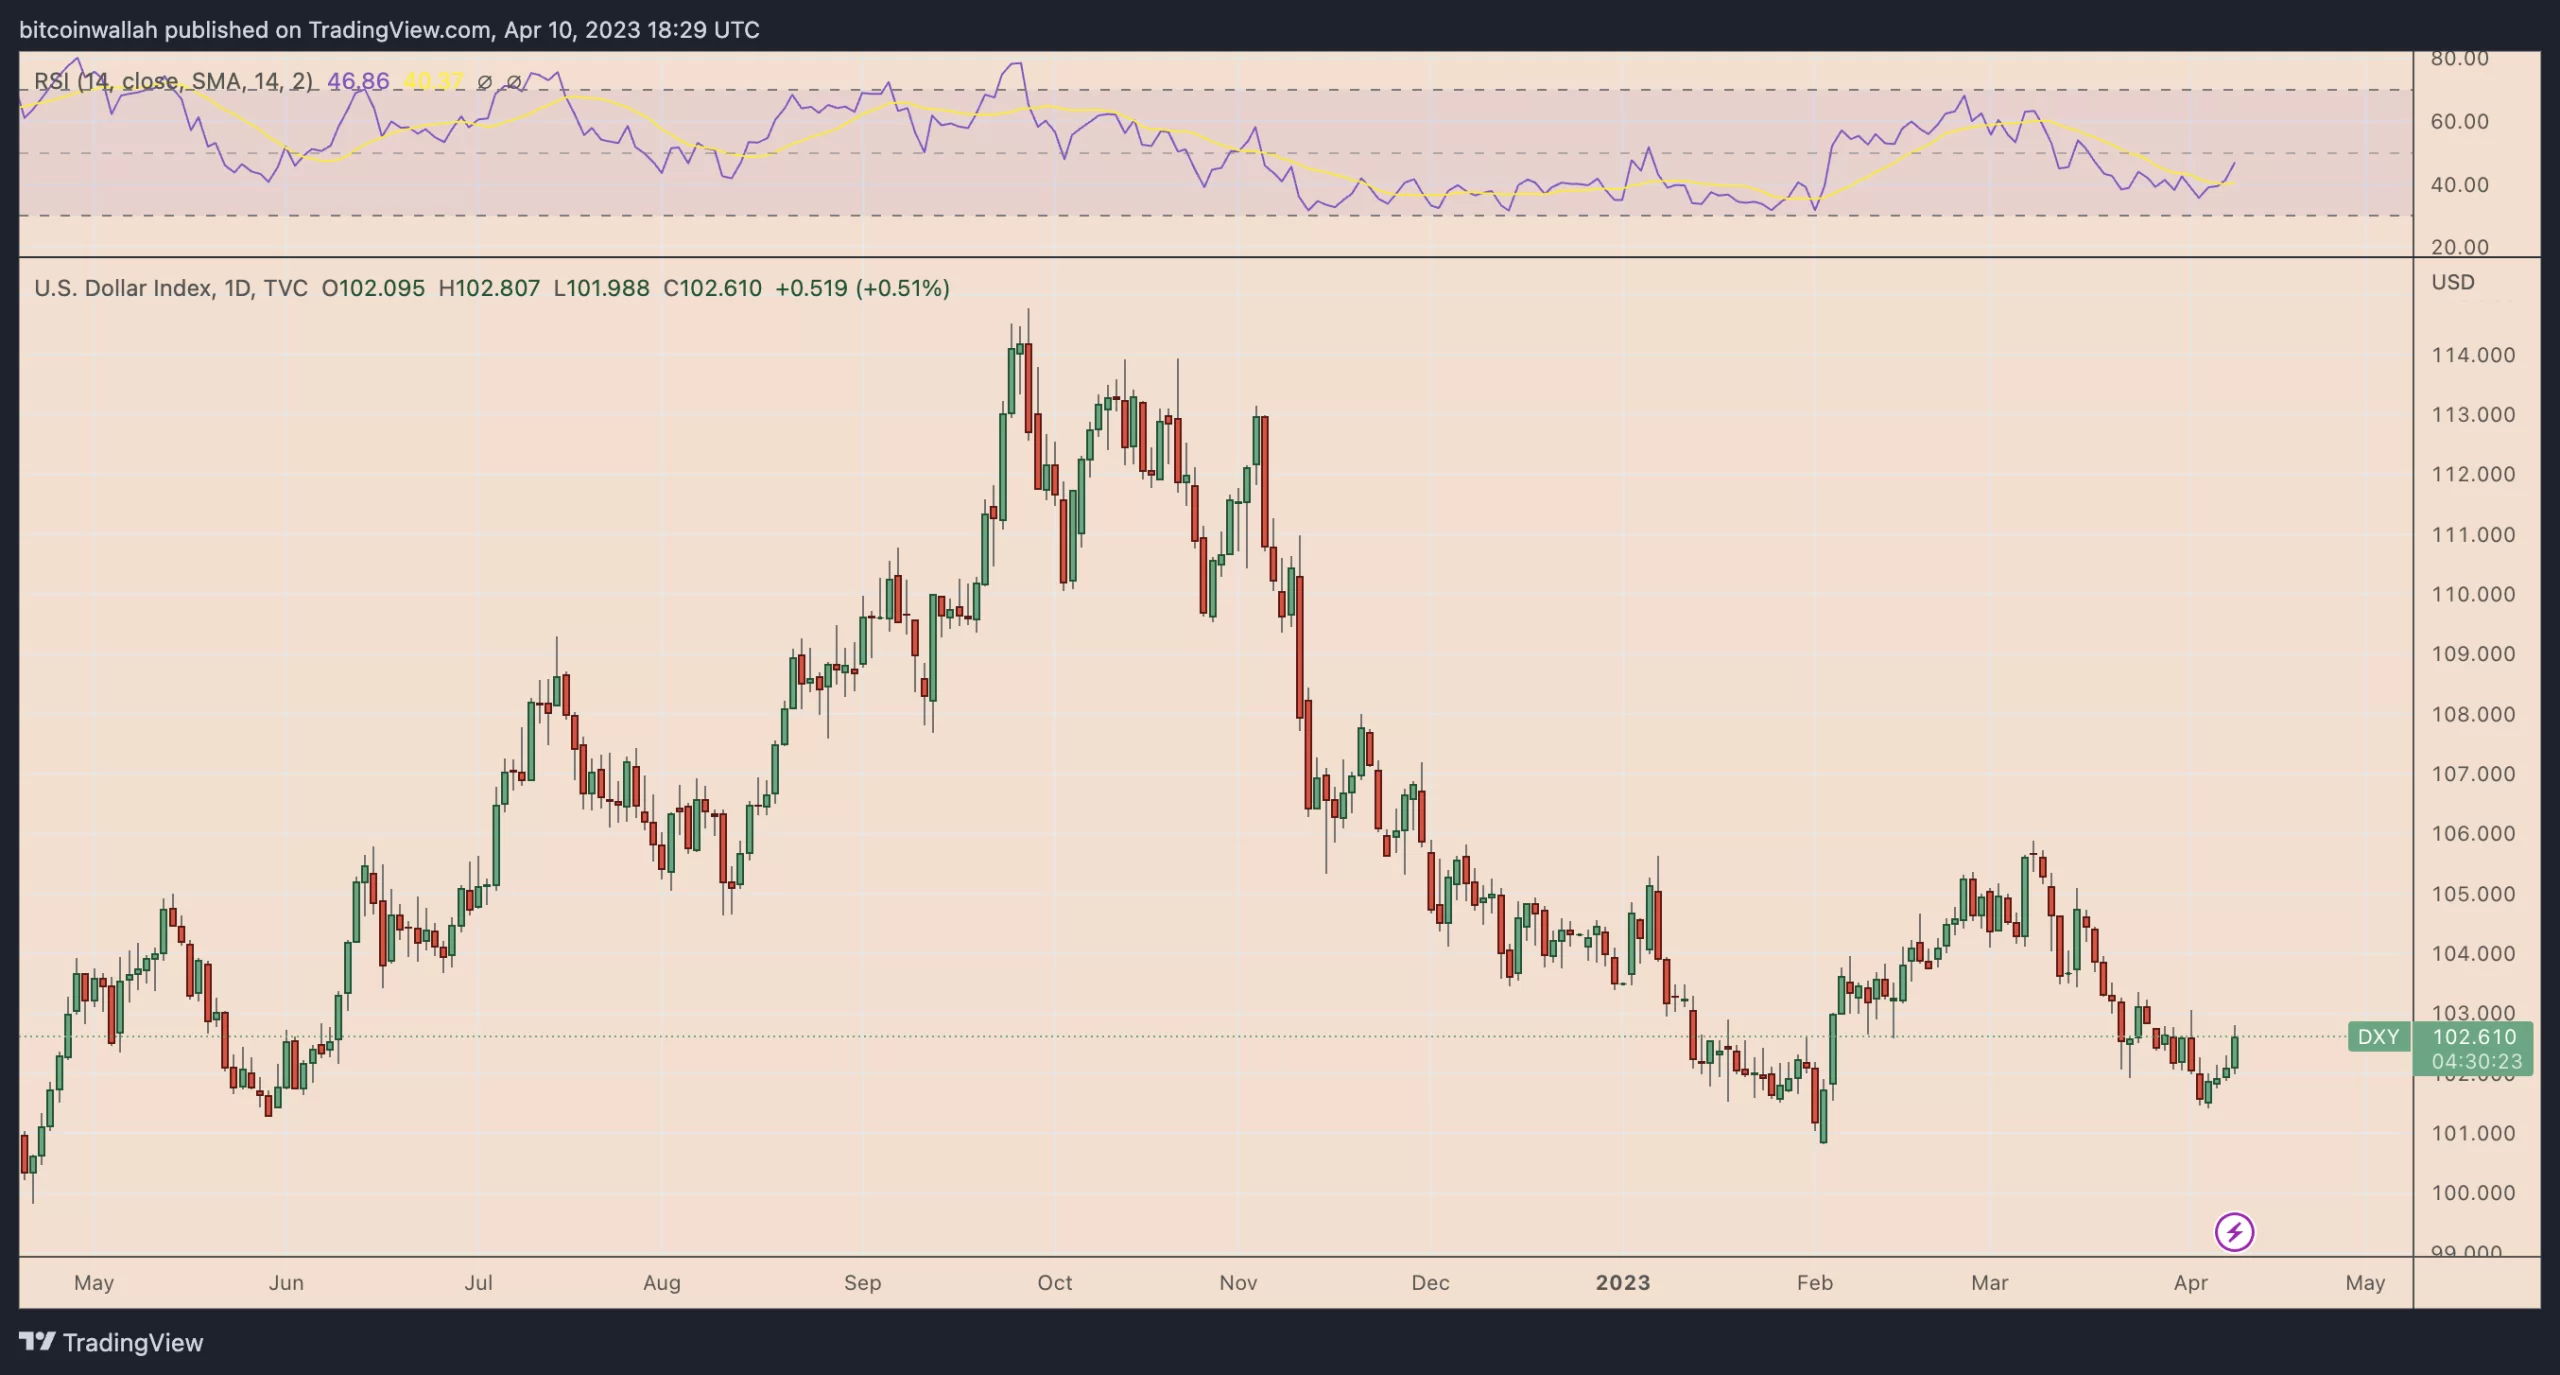
However, the US Dollar Index (DXY), which tracks the greenback's strength against a basket of leading foreign currencies, gained 0.7% on April 10, along with the US stock market weaker, indicating that macro investors see the possibility of a rate hike ahead.
In fact, the market sees a 70% probability the Fed will raise rates by 25 basis points at its meeting in May, according to the CME Fed Watch Tool . That could be because the tightening labor market gives the Fed more incentive to keep raising lending rates going forward.
Can Bitcoin Hit $30,000 in April?
From a fundamental perspective, Bitcoin looks poised to hit $30,000 ahead of the Fed FOMC. However, the ability to keep those gains will depend on inflation data, as mentioned above.
Meanwhile, from a technical analysis point of view, Bitcoin must close above its weekly resistance range – defined by the $29,500 to $32,000 area – to head towards a rally towards $40,000.
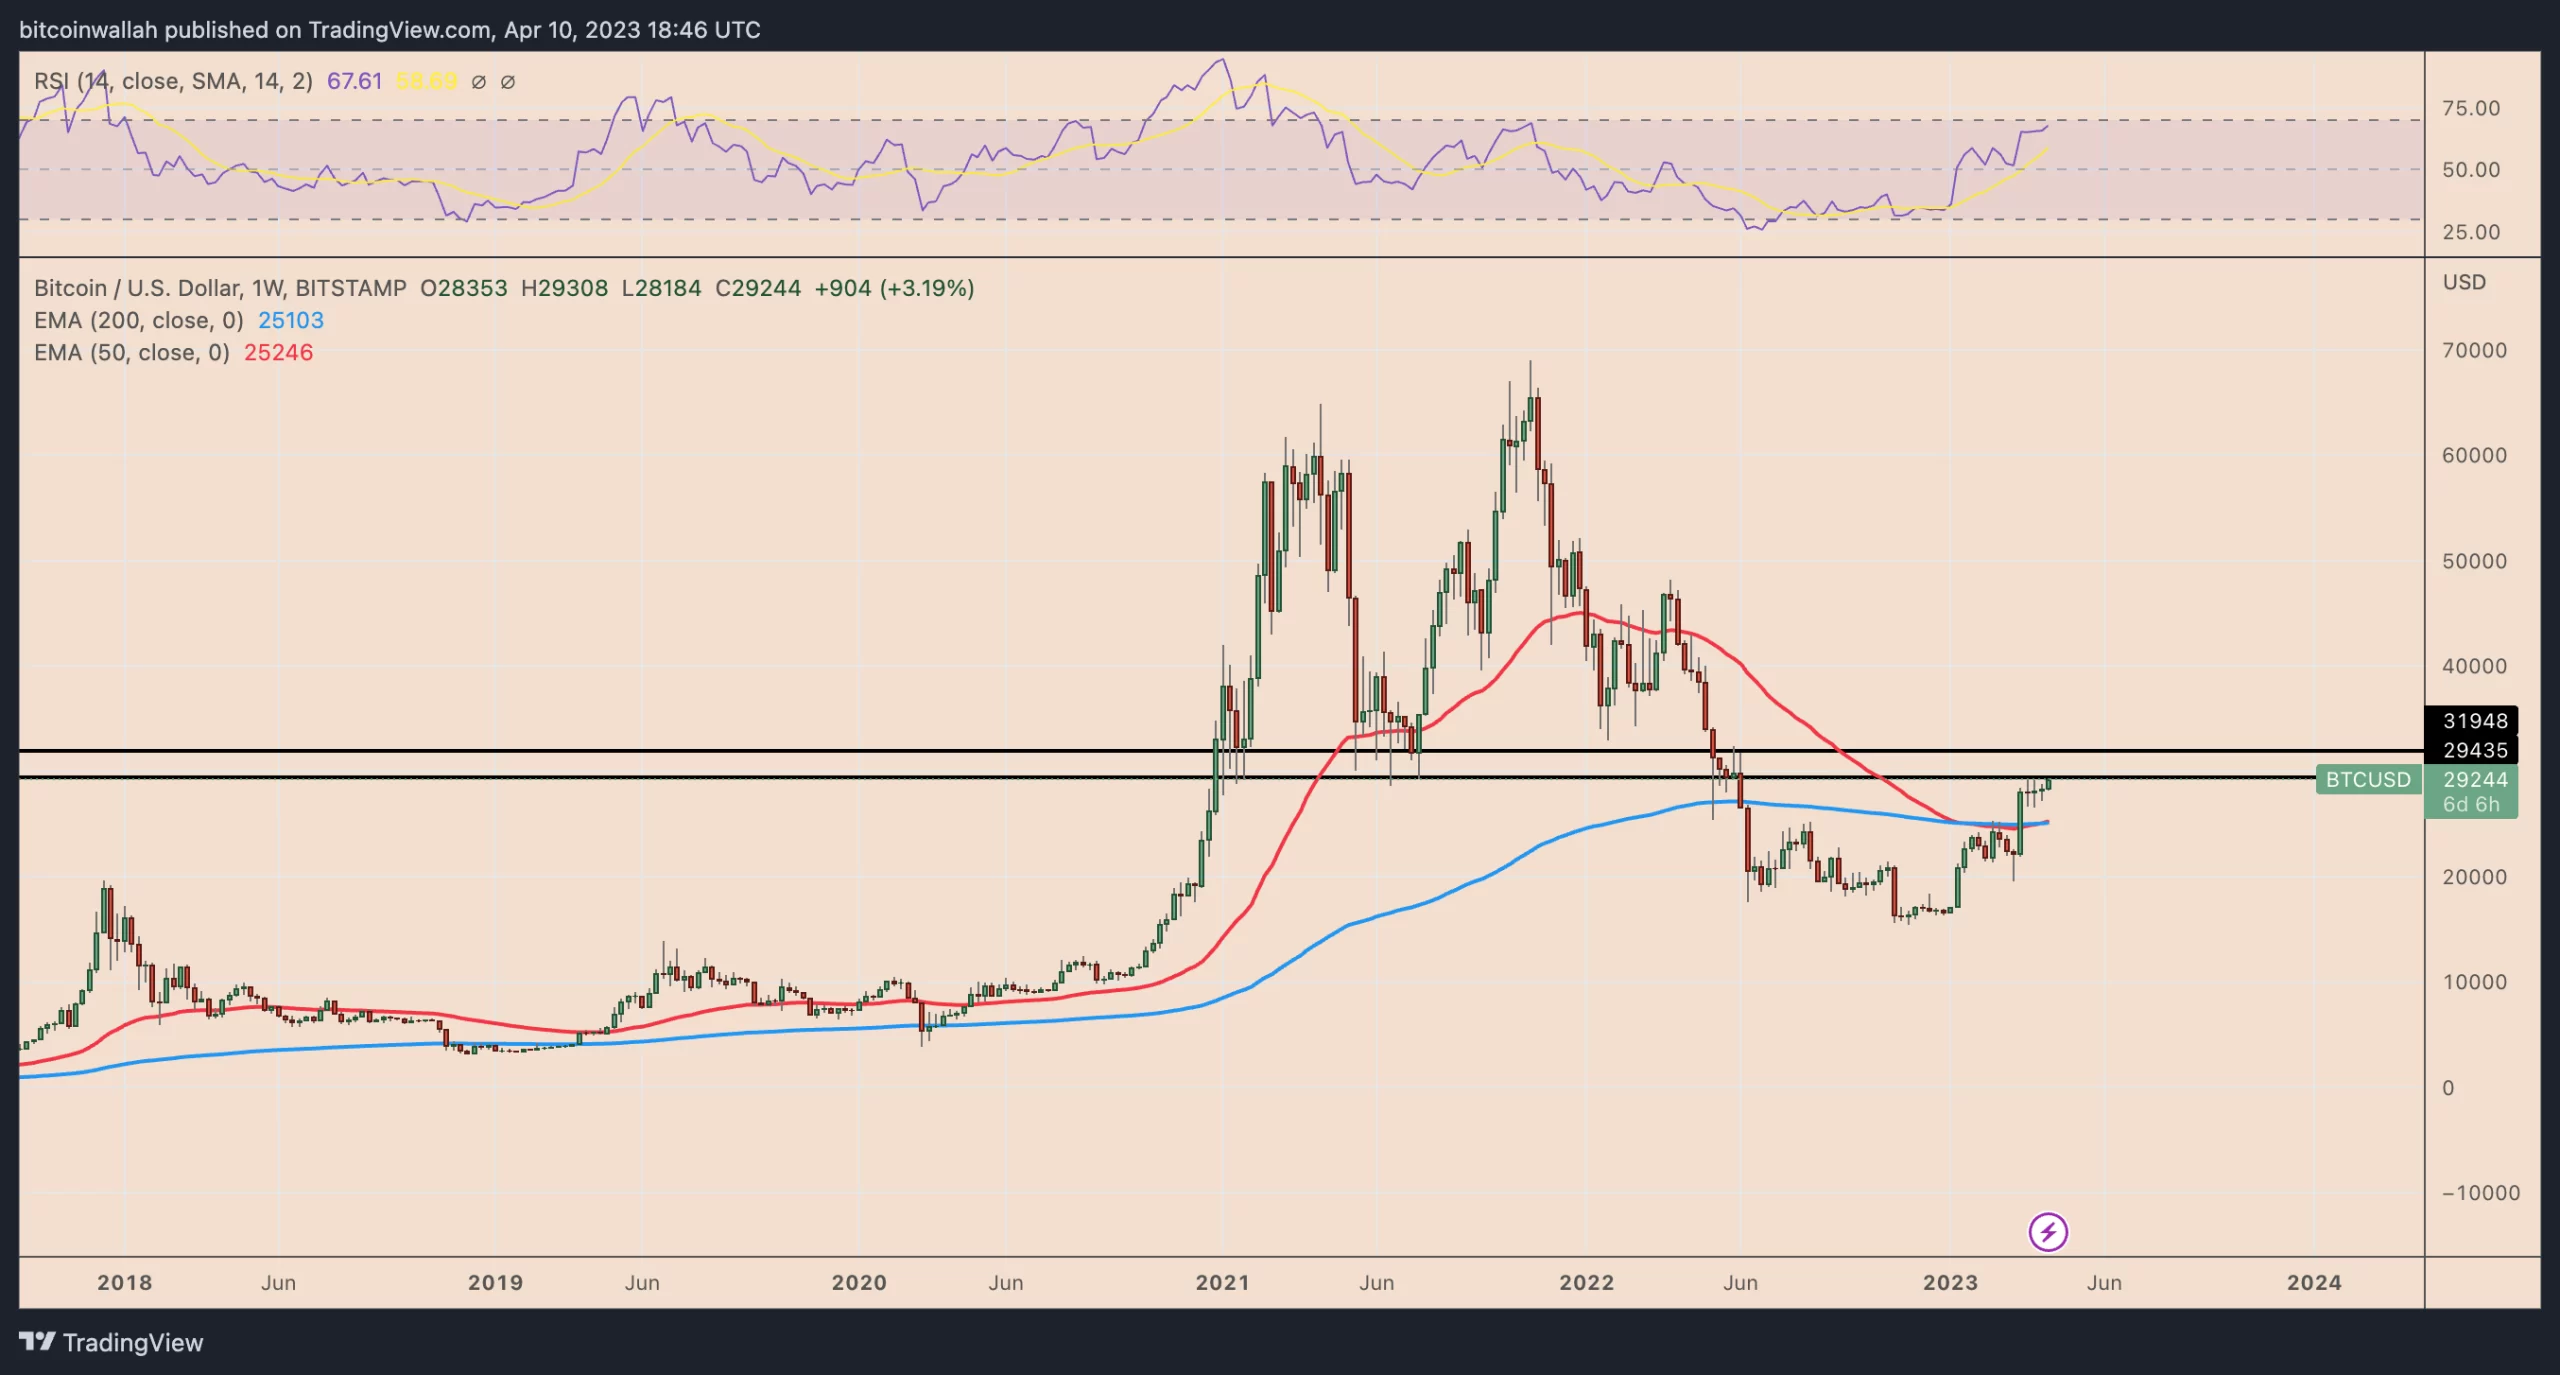
This range acts as support during the sessions from December 2020 to February 2021, May 2021 to July 2021 and January 2022 to March 2022.
In the event of a pullback from the mentioned range, BTC price is at risk of a sharp drop towards the 50-week exponential moving average (50-week EMA; red wave) near $25,250 and the 200-week exponential moving average (200 EMA) week); green wave) nearly $25,000.


