Buyers are not going to give up so easily, according to CoinStats.
BTC/USD
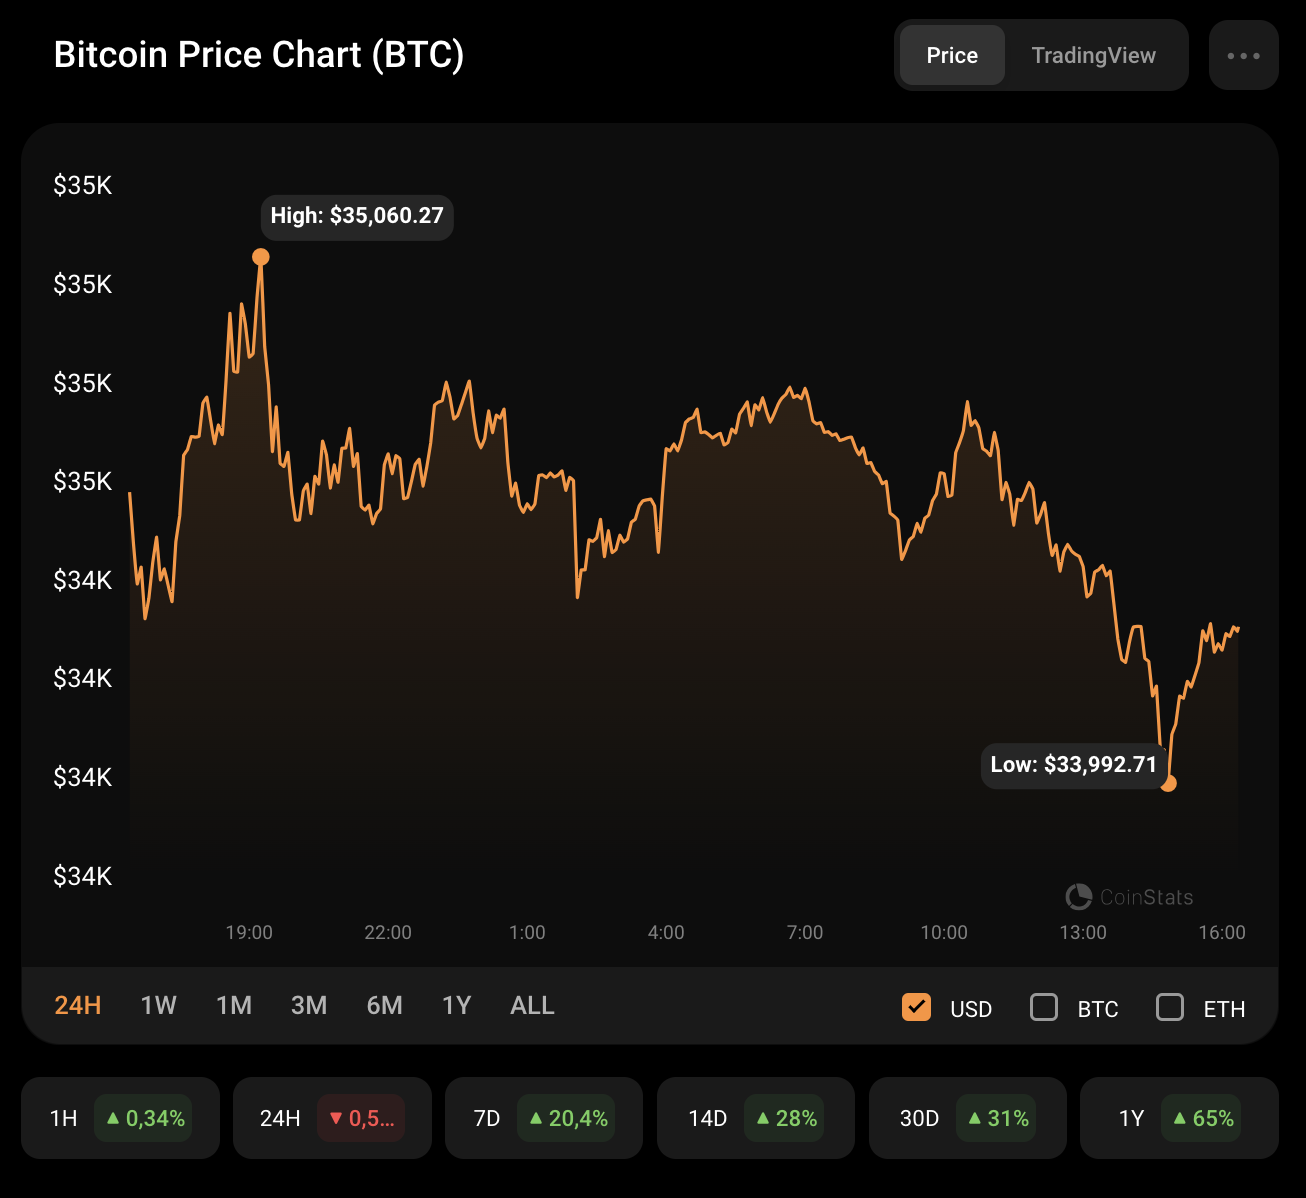
The rate of Bitcoin (BTC) has declined by 0.50% since yesterday.
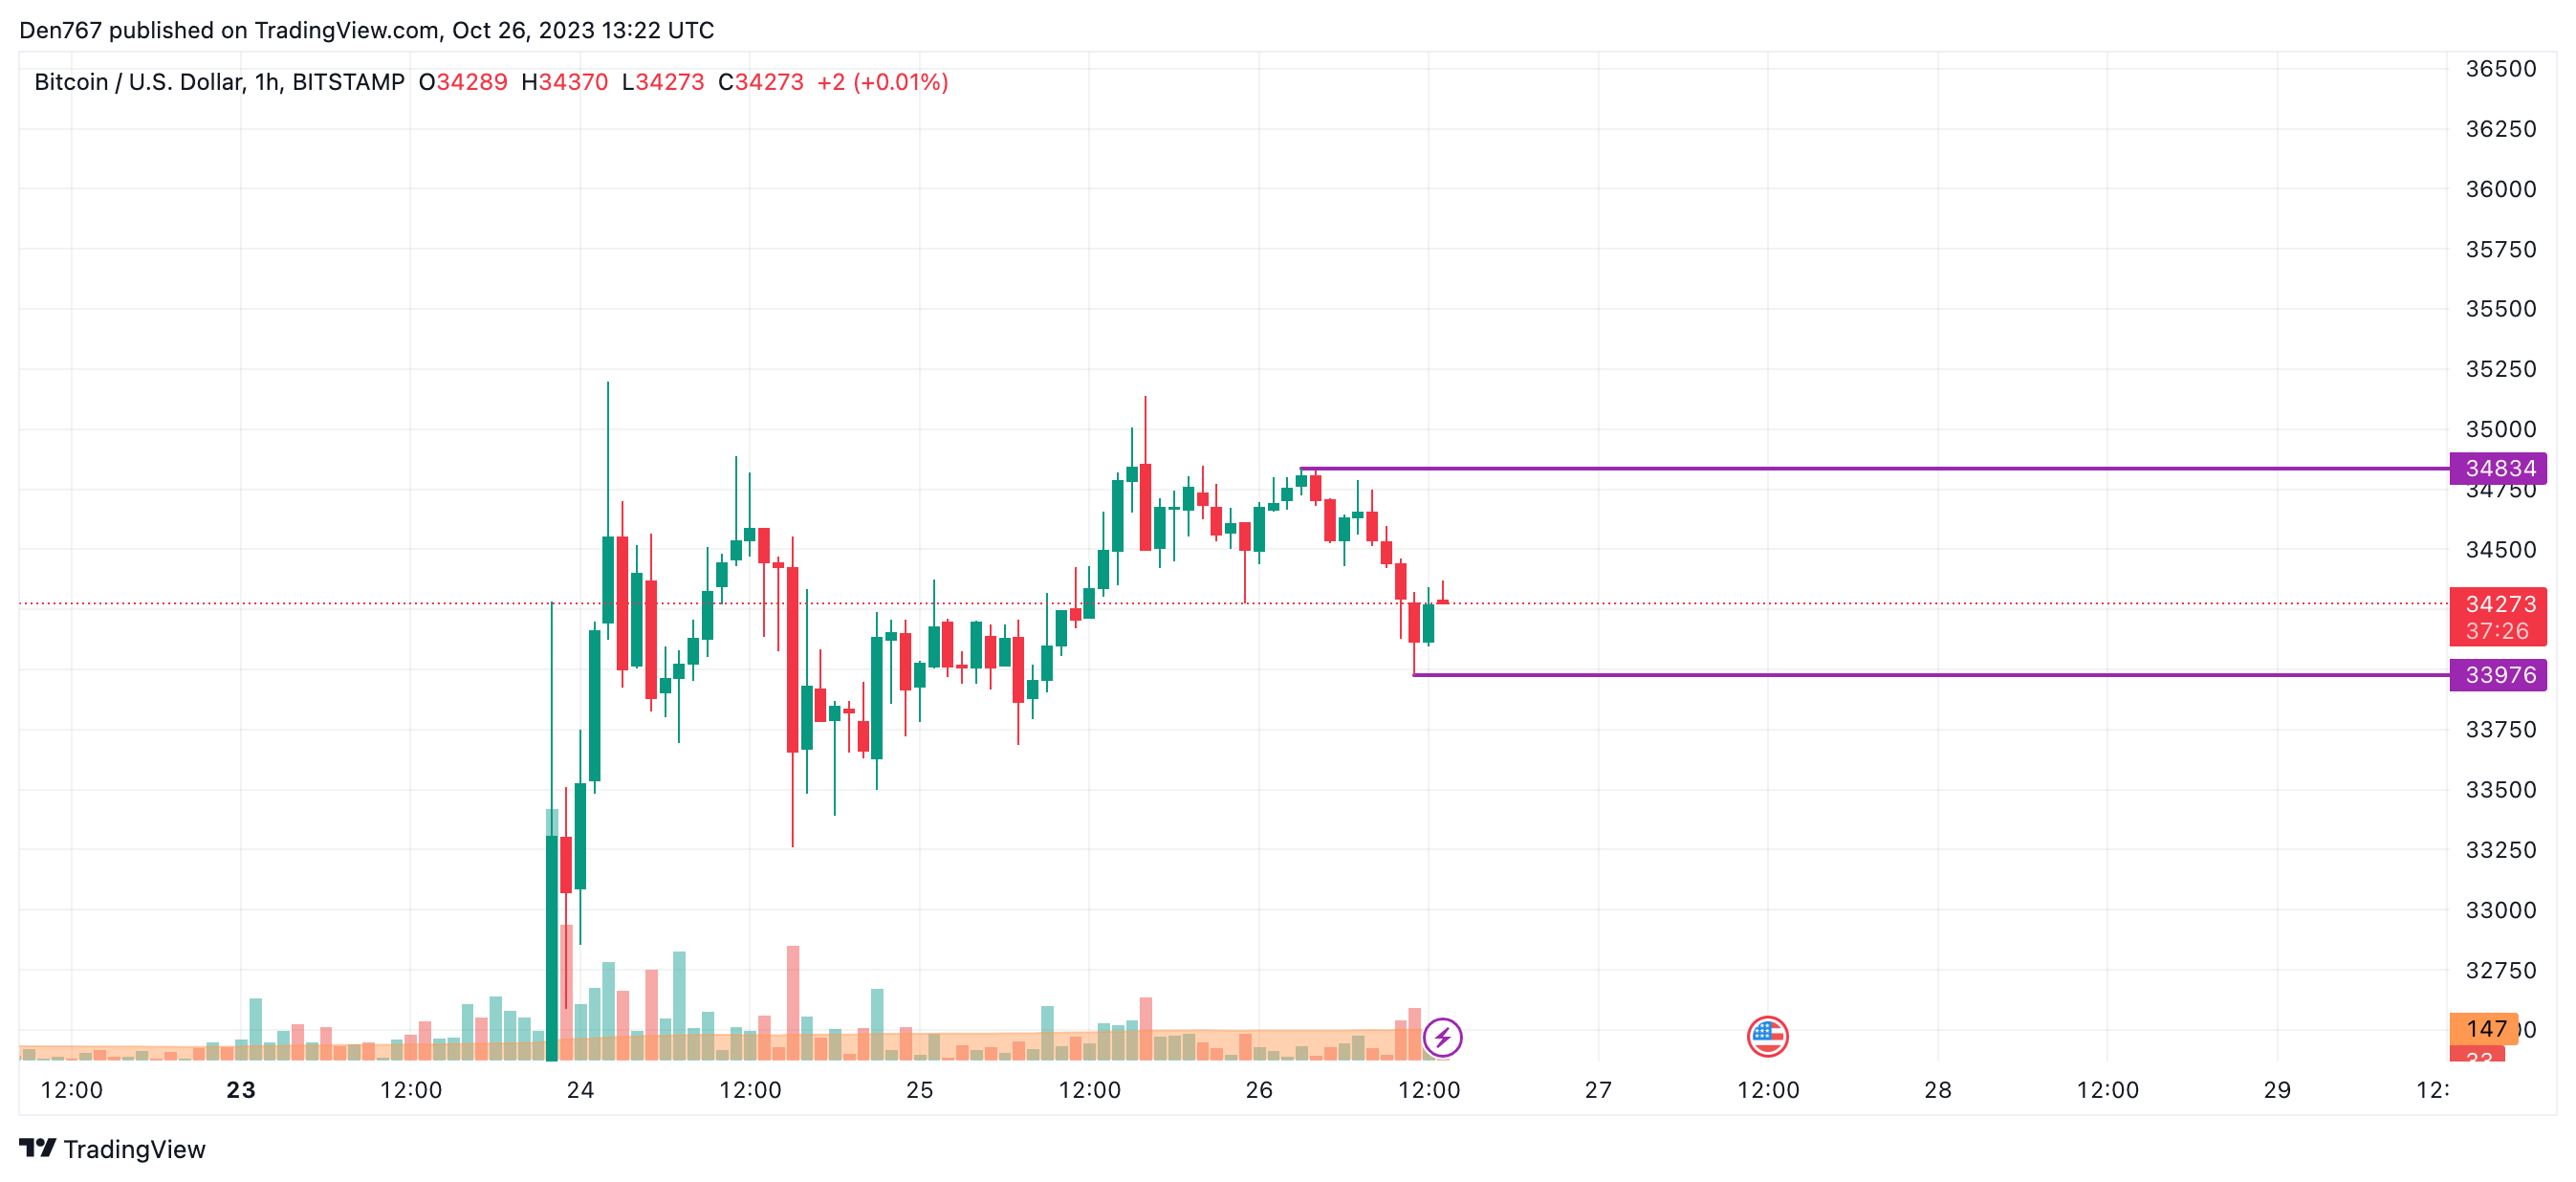
On the hourly chart, the price of BTC is trading near the local support level of $33,976. If the bears' pressure continues, the breakout may lead to a blast to the $33,500 area tomorrow.
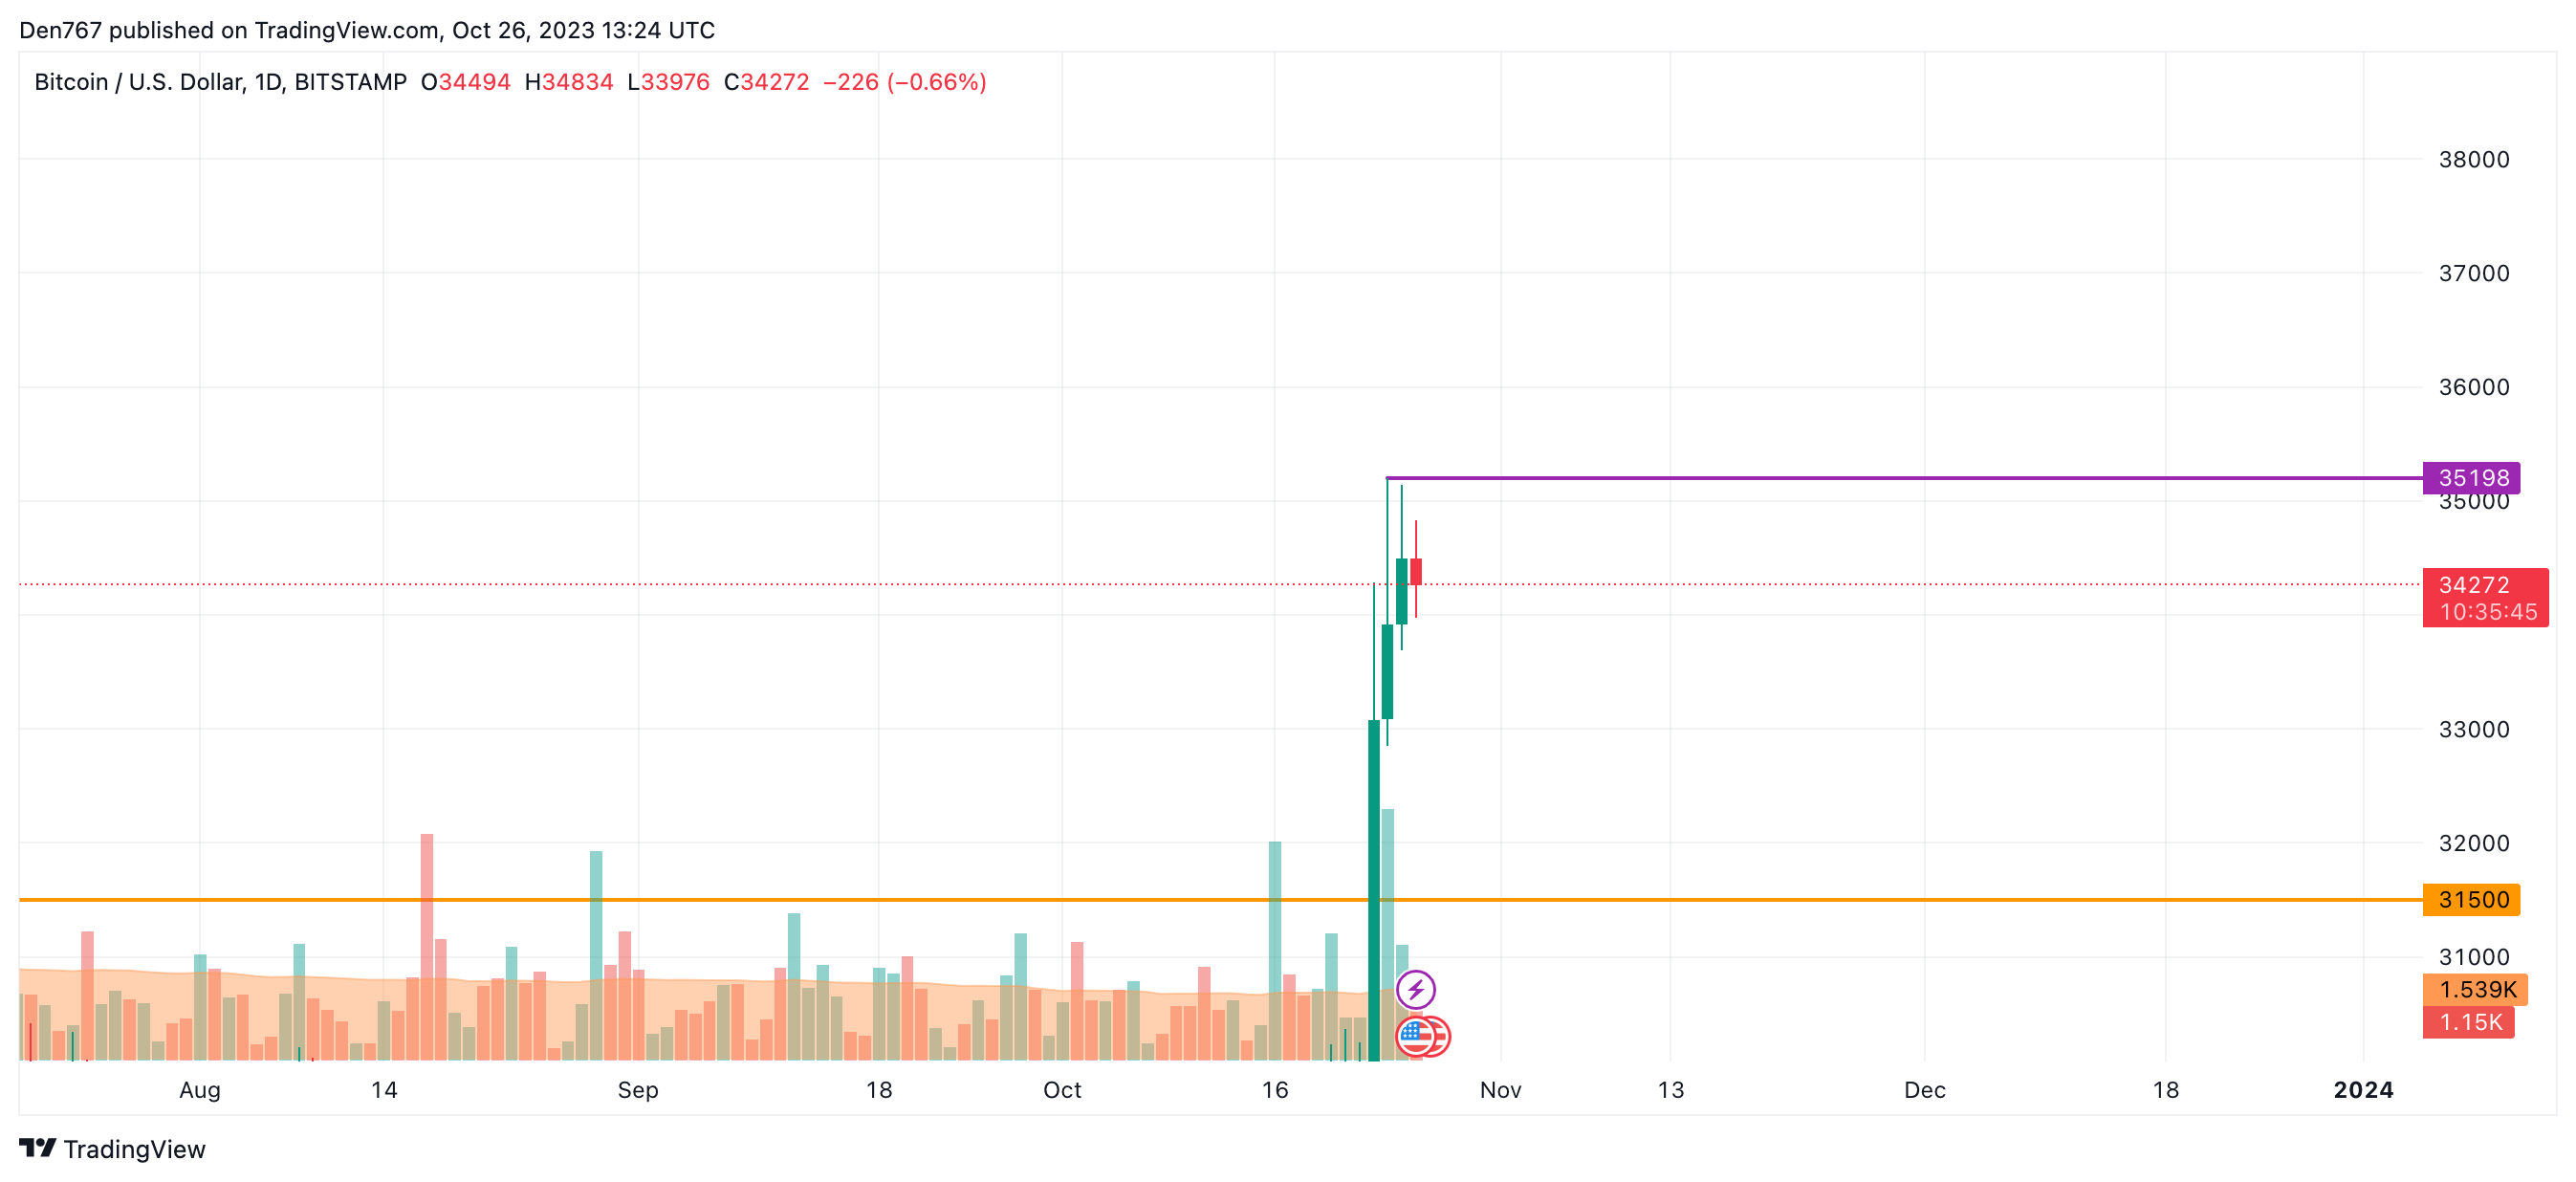
On the bigger chart, traders should pay attention to the level of $35,198. Until the price is below that mark, there is a chance to see a correction as the rate has increased significantly.
If the local drop happens, the decline may continue to the $33,000 zone.
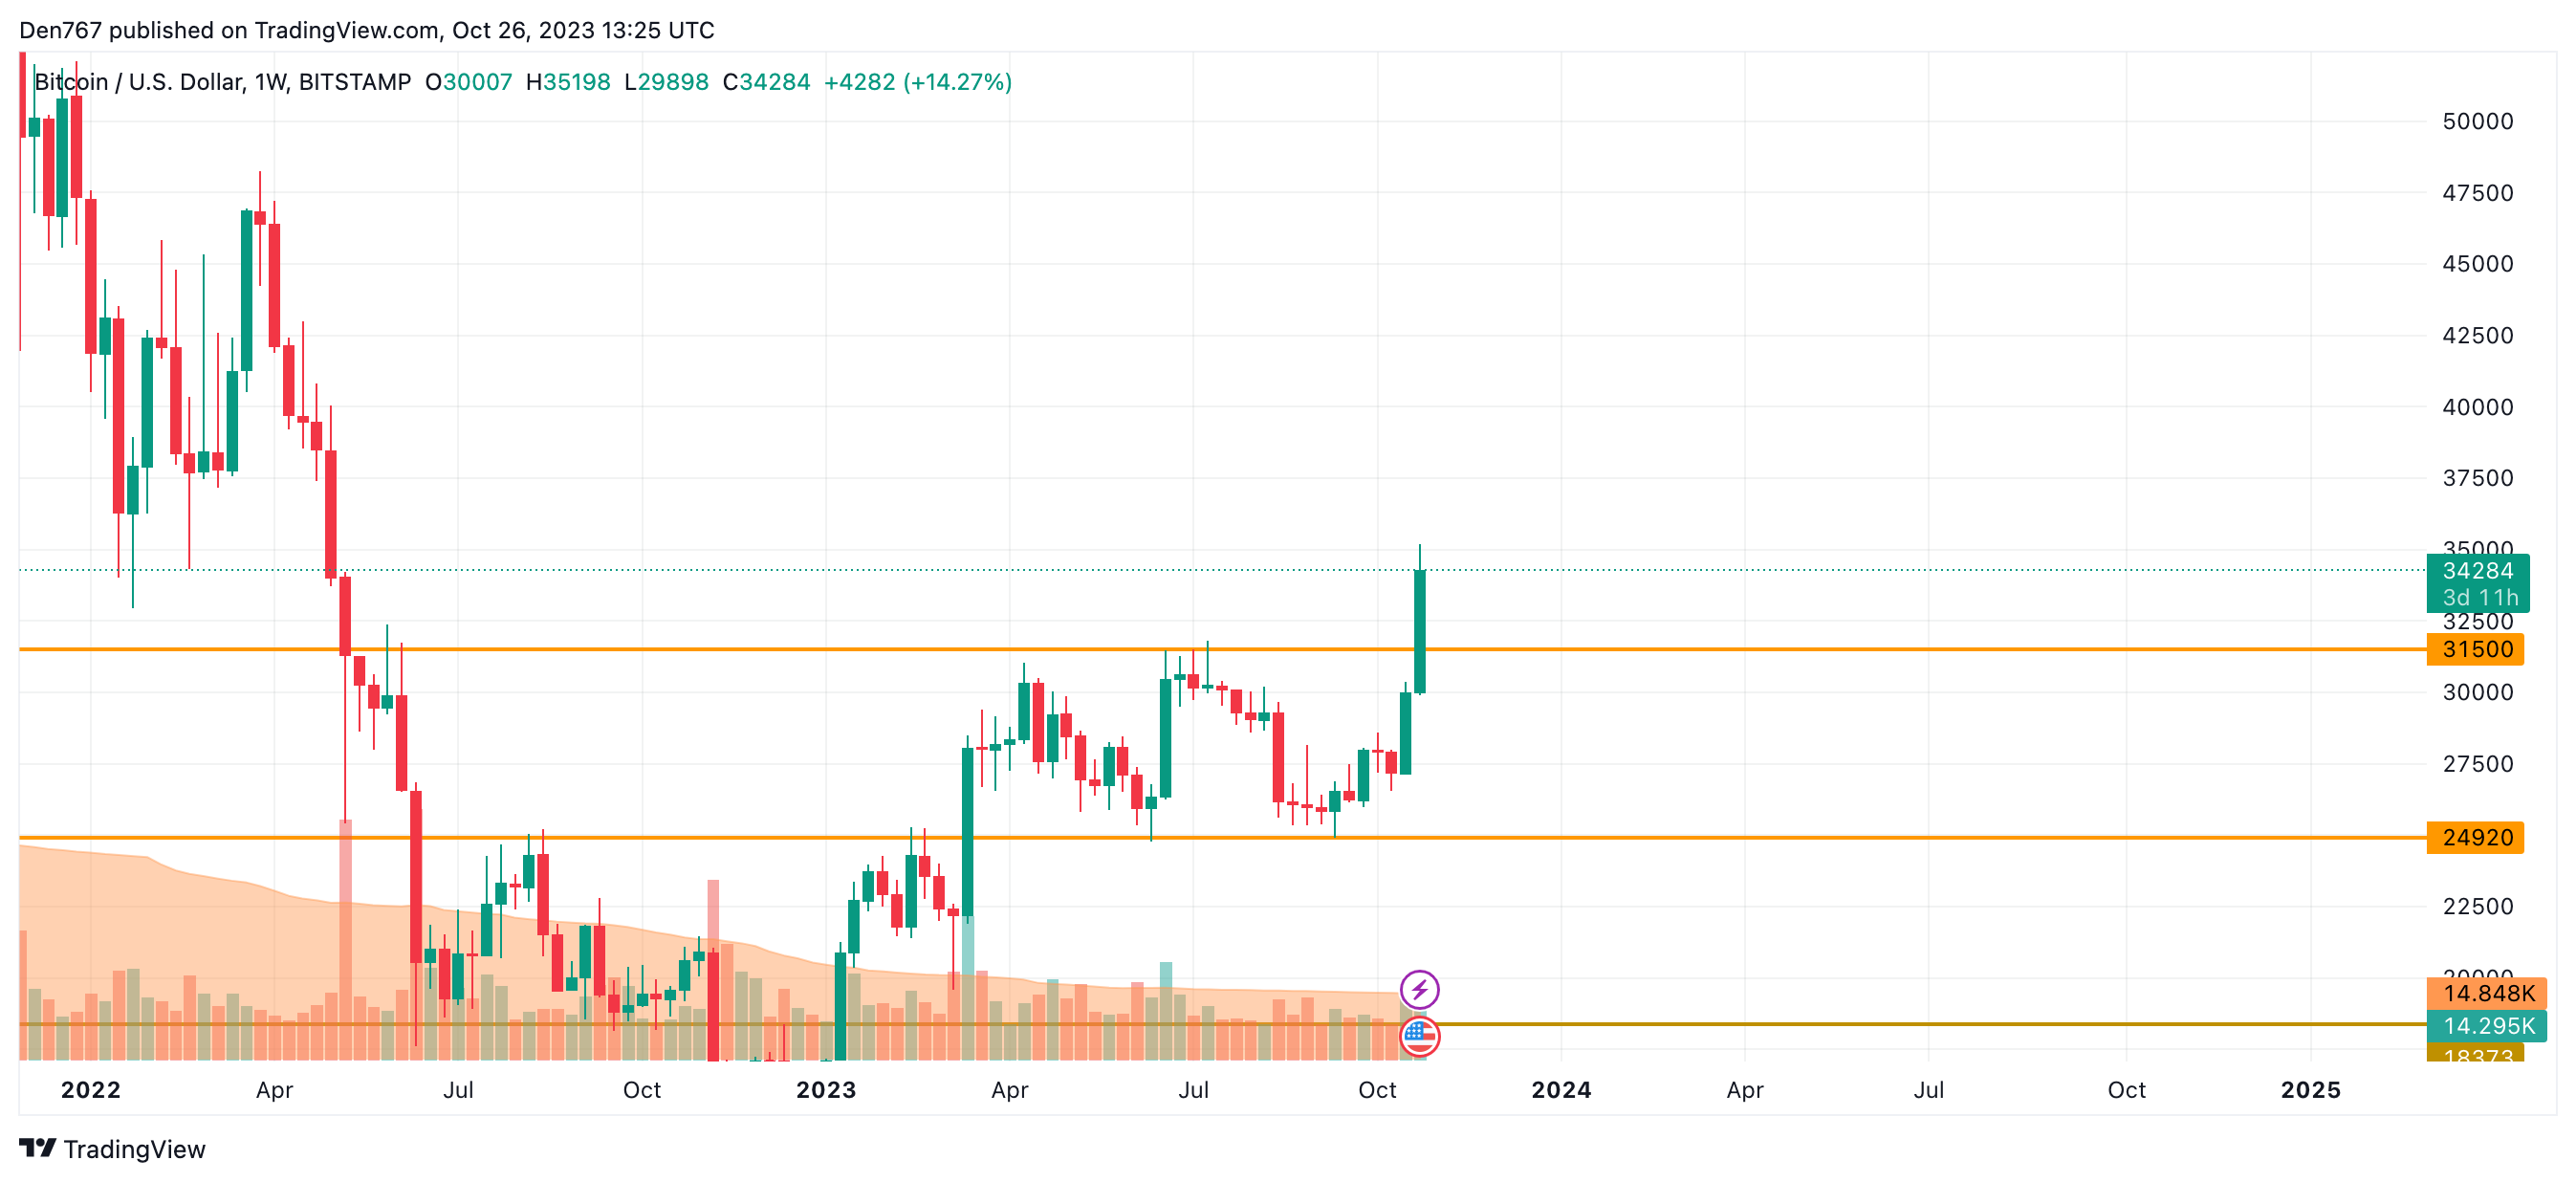
A more positive picture can be seen on the weekly time frame. If the bar closes near the $35,000 mark and with no long wick, the upward move is likely to continue to the $40,000 range next month.
Bitcoin is trading at $34,284 at press time.