

Ethereum ( ETH ) is facing the opportunity to officially set a new high for 2023. Observing price behavior in the short-term time frame shows that it is likely that the price will soon surpass the resistance of 2,130 USD in the early days of December. .
The following are the latest ETH price analysis updates from BeInCrypto from a technical perspective.
ETH price analysis 12h frame: Short-term price model is supporting the bullish scenario
The notable price pattern in the 12-hour frame is the cup and handle pattern. According to classic price model theory, this is a signal that ETH may continue to increase to complete the prediction of this model.
Also Read: 3 trading strategies and 8 common price models in Crypto for newbies
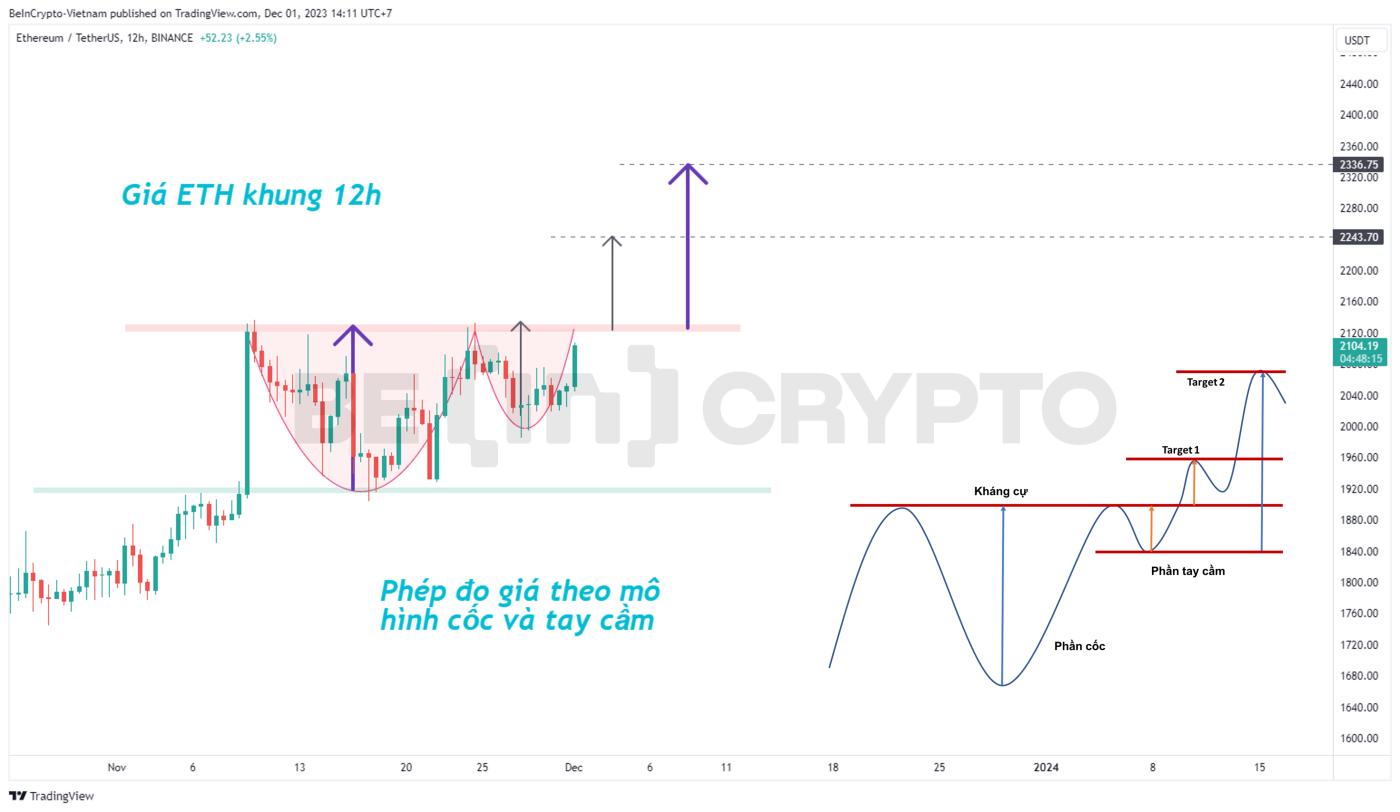 12h frame ETH price analysis with cup and handle model.
- To be able to break through the immediate resistance at 2,130 USD, ETH needs the support of volume. CoinmarketCap data shows that the Medium 24h volume of ETH in recent days is around 9 billion USD. Today alone, volume has tended to increase slightly by 6% (though the day has not yet ended).
- There are two ways to determine the target according to this model, based on the cup or the handle. In both of these ways, the target for ETH when breaking the $2,130 resistance will be the $2,250 area and the $2,330 area.
From a short-term technical perspective, not only ETH but BTC also shows a short-term rising triangle pattern .
ETH price analysis weekly frame: The 2,250 area is identified as a strong resistance area
If we expand our perspective to a larger time frame, the 1W weekly frame, we can see many signs pointing to the $2,250 area as ETH 's strong resistance over the past year.
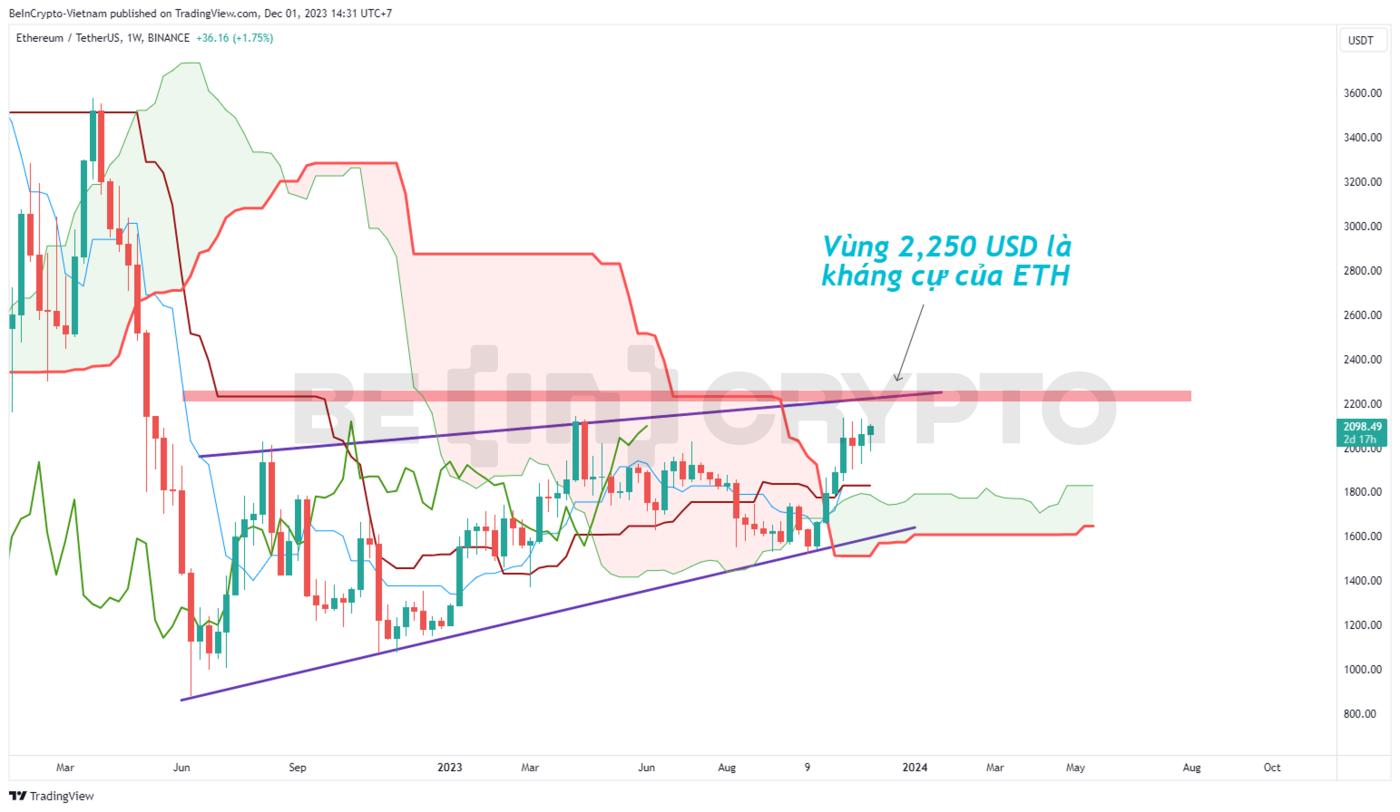 Analyze weekly ETH price with Ichimoku indicator.
- The Ichimoku indicator on the 1W frame shows that the Chiko-span line (green) is tending to approach the flat zone Senko Span B at 2,250 USD. Besides, the trendline (purple) also contributes to confirming that this price range is resistance if pulled from the two highest peaks ETH has created over the past year.
- Thus, from a technical perspective, ETH still has the ability to continue to increase in the short term but will quickly face selling pressure at the immediate resistance.
From here, traders who trade according to technical analysis can determine the range of trading opportunities.
News about Etherem Spot ETF could be a surprise factor for ETH price in the near future
The above are pure technical analysis assessments, sometimes the price line fluctuates very unexpectedly because of the influence of news. Specifically, the recent ETH related news that has caught the community's attention is that Fidelity has joined the Ethereum Spot ETF race.
Yesterday, the community spread the word about the SEC filing for an ETH Spot ETF from Fidelity.
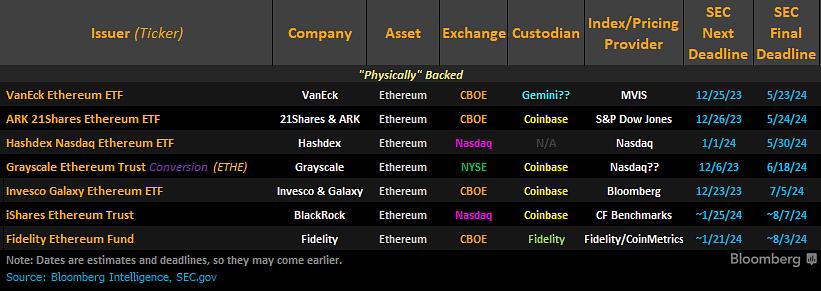 List of Ethereum Spot ETF filings. Source: Bloomberg.
As such, the list of Ethereum Spot ETF filings is growing longer with expectations of a Bitcoin Spot ETF being approved within the next year.
KOL Michaël van de Poppe excitedly predicted that Ethereum could rise to $3,500 in the first quarter of 2024, and of course there will also be Bitcoin shine once the above ETFs are approved by the SEC.
Also Read: Top 5 reputable Ethereum trading floors in Vietnam
What do you think about the above ETH price analysis? Chia your opinion now in our community group Telegram chat | Telegram channel | Facebook fanpage .


