


Market Summary
In terms of U.S. stocks, although Tesla, Apple, and Google among the "Big Seven" stocks have performed poorly this year, other stocks such as Nvidia and Meta have performed strongly, and the overall market continues to hit new highs. However, chip stocks experienced a sharp correction on Friday, with NVDA experiencing its largest single-day decline in more than nine months - 5.6%. Considering that earlier in the session, NVIDIA's stock price rose by 5.1% and AMD's stock price rose by 7.5%, the market seemed There is a tendency to take profits.
Since AI currently dominates the positive sentiment of the entire market, chip stocks lead the entire risk asset market, and NVDA is the leading player, so we must pay close attention to the progress of this stock. Of course, it is difficult to find fault with the company’s current fundamentals. The valuation is high but not exaggerated. The main bearish views are as follows:
- Supply is catching up with demand. Nvidia's chip delivery time shortened from as long as 11 months to three months, indicating an improvement in supply, which may affect its sales growth.
- Facing more intense competition. Because not only AMD is gradually making progress, but more importantly, NVIDIA's major customers, including cloud service providers and Tesla, are designing independent AI chips.
- Technical pullback. Driven by technology stocks, the Nasdaq and S&P Index rose hugely, and the market was fearful of highs. If the Federal Reserve makes unexpected moves, it may trigger a sharp decline in technology stocks.
- Too much profit taking. Since the stock price has been rising unilaterally, some investors who have made huge profits may take profits after the upcoming GTC conference, causing the stock price to fall back.

BTC and gold both hit record highs last week. During the recent rise in Bitcoin and gold prices, the traditional framework's explanatory power has been clearly insufficient. U.S. bond interest rates and the U.S. dollar exchange rate have only fallen slightly, and risk aversion has shown no obvious signs of warming. The logic of alternatives to the existing fiat currency system is dominating these alternative investment markets.
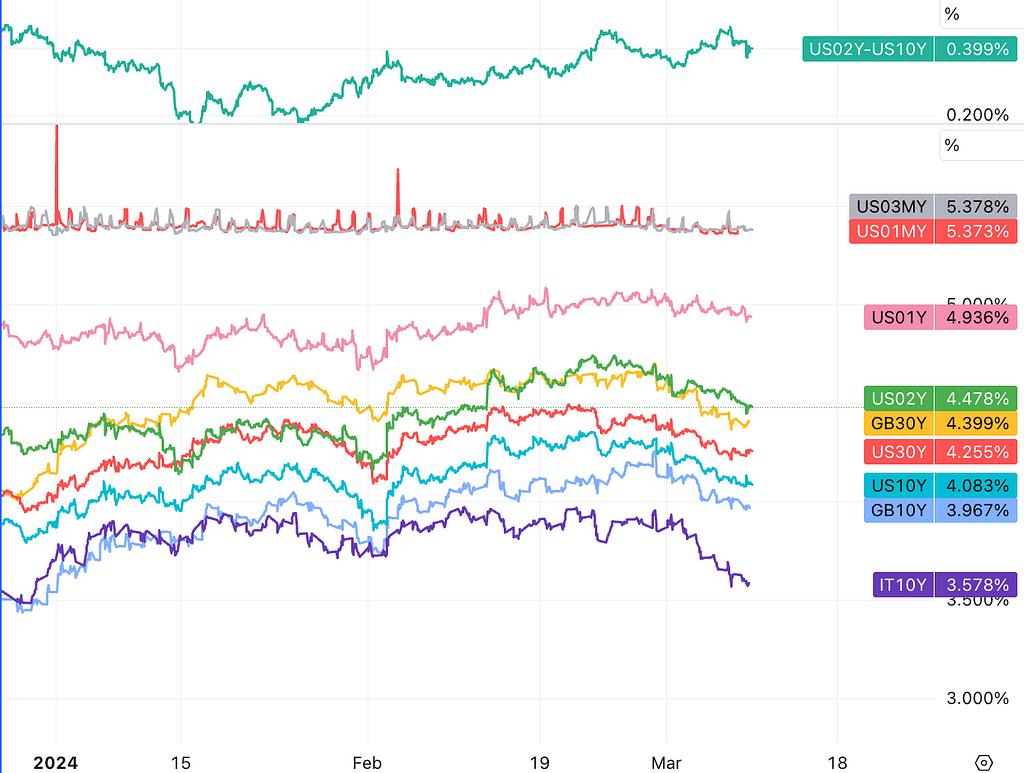
Friday's non-agricultural data was mixed and not enough to change market expectations too much, but it was generally understood to be a dovish signal, advancing the market's expected timing of a Fed interest rate cut. Interest rate market yields edged lower, while stocks rose before falling. Goldman Sachs believes that this pullback is a good buying opportunity given that employment data supports interest rate cuts. Slowing wage growth should be a positive sign for Tuesday's CPI data.
cryptocurrency
BTC ETF almost equals GLD
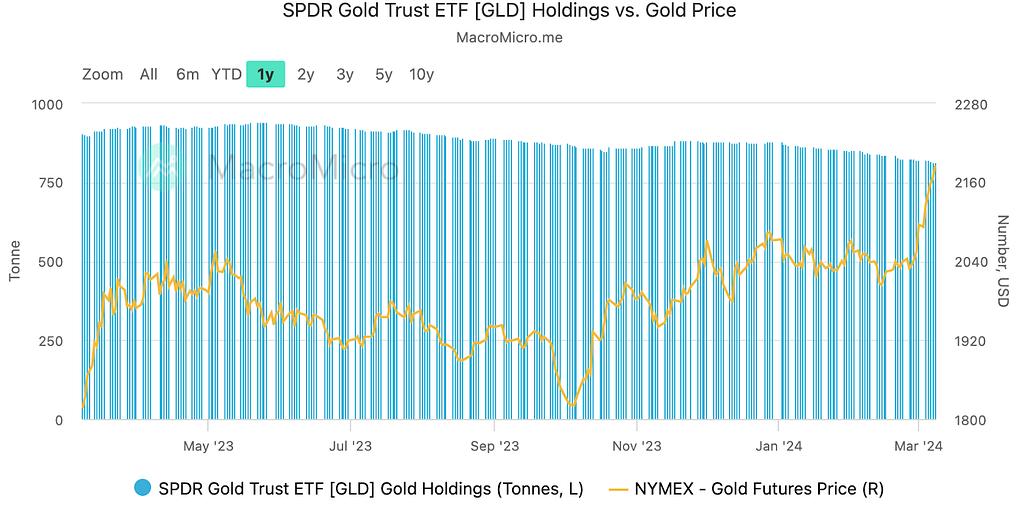
The recently listed spot Bitcoin ETF in the United States continued to accumulate Bitcoin last week - currently holding about 4% of 21 million Bitcoins worth $54.6 billion, almost tying the largest gold ETF GLD's $56 billion AUM.

According to a public filing this week, BlackRock applied to the SEC to add spot Bitcoin ETF exposure to its AMU$18 billion Global Allocation Fund and AUM$36.7 billion Strategic Income Opportunities Fund.
These news show that a new trend is just beginning, namely the allocation of passive asset management. These asset management plans will allocate BTC as an alternative asset into the portfolio. A considerable number of asset managers will adopt a fixed ratio allocation strategy, such as a fixed 1% AUM ratio. When adjusting positions every quarter, the holdings will be reduced if the ratio exceeds it. As for increasing holdings, these strategies often do not consider the absolute valuation of BTC, which will greatly increase the thickness of the BTC market.
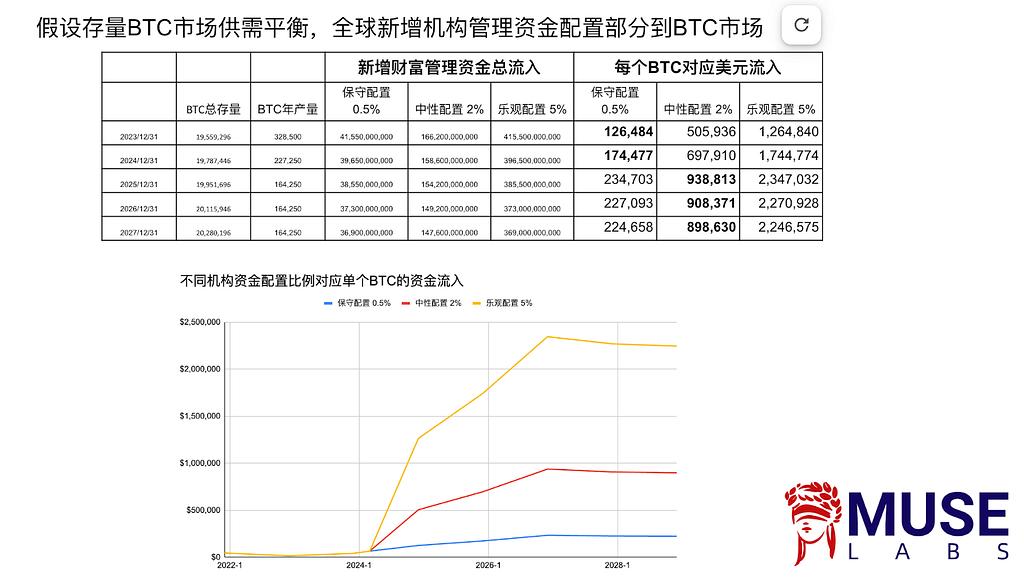
According to our calculations, the total size of open-end funds that can potentially allocate BTC is US$9.7 trillion. A conservative assumption that only 0.5% to 1% will be allocated to BTC may bring in capital inflows of US$48.5 billion to US$97 billion.
If we assume that the supply and demand of the existing BTC market are balanced, and do not consider the transfer of the stock, but only consider the [new] capital allocation part managed by global institutions to the BTC market, we conservatively assume that 0.5% of the new allocation corresponds to the capital flow of each newly produced BTC this year. It may also reach US$174,000. Although this cannot be used as an accurate reference, it does show the potential for capital inflow.


Markus Thielen, founder and CEO of 10X Research, issued an article on Saturday to warn of short-term risks. He believes that the Bitcoin/cryptocurrency market is currently overheated and potential downside risk consolidation should be carefully managed. US ETF flows are no longer the main driver of Bitcoin.
Macro events of the week
Global central banks are currently taking a wait-and-see approach:
The European Central Bank and the Bank of Canada adopted a wait-and-see approach in March, emphasizing data dependence. The ECB forecasts downward revisions to both growth in 2024 and core inflation in 2025.
Most major central banks are expected to start cutting interest rates by mid-2024, with global policy rates falling by an average of 1.4 percentage points.
Europe could cut interest rates faster than the U.S.:
Historically, central banks in developed countries usually cut interest rates three times in a row before slowing down during a soft landing period. The pace of rate cuts tends to accelerate if inflation is below target and economic activity deteriorates or interest rates are well above neutral.
Employment and income growth:
U.S. employment increased by 275,000 in February, significantly exceeding expectations of 200,000. While February's job gains look optimistic, the weak household survey and rising unemployment rate reveal some underlying instability in the job market. Wage growth was lower than expected, with average hourly earnings (AHE) rising 0.14% month-on-month, lower than the 0.2% expected. The unemployment rate rose 0.2 percentage points to 3.9%, higher than the forecast of 3.7%. These breakdowns may be a positive sign for controlling inflation, but they may also put some pressure on consumer spending.
Corporate profit margins are expected to remain high in 2024:
According to Goldman Sachs' latest forecast, non-financial corporate profits will fall from 17% of GDP in 2022 to an average of 16% in 2023, but will still be higher than the 13% in the fourth quarter of 2019. The economy-wide non-financial profit margin is expected to rise slightly to approximately 16.3% in 2024.
China’s macro policy objectives and stance:
Macroeconomic targets: At the National People's Congress, policymakers set a 2024 GDP growth target of 5%, in line with broad expectations.
Fiscal policy: China’s official fiscal deficit target is set at 3.0% of GDP (compared to 3.8% in 2023). The market’s first reaction was to be disappointed with this figure, but then also realized that this official figure may not be fully Reflects the government's actual financial support for the economy. Taking into account a wider range of fiscal activities and policy measures, including but not limited to bond issuance, spending on specific projects, government-guaranteed loans, etc., these may not be directly reflected in the standard fiscal deficit ratio. Goldman Sachs expects this implicit stimulus to be at least an additional 0.7%.
Monetary and real estate policies: Although no major new measures have been announced, China's monetary and real estate policy stance is still supportive, and there are new expressions and new formulations, such as handling hidden risks in a steady and orderly manner, improving basic systems related to commercial housing, and meeting the needs of Diversified and improved housing needs, etc.
Economic data: As a focus of the government's economic strategy, China's exports increased by 7.1% year-on-year from January to February, much higher than the 1.9% expected; China's trade surplus hit a record high of US$125 billion, and imports also increased 3.5%. February's manufacturing purchasing managers' index (PMI) was also slightly better than expected.
Asia and Emerging Markets Economic Data:
Asian February inflation data generally rose and exceeded expectations:
- South Korea’s CPI increased by 30 basis points year-on-year to 3.1%;
-Taiwan’s CPI increased by 130 basis points year-on-year to 3.1%;
- Philippine CPI increased by 60 basis points year-on-year to 3.4%;
- Indonesian CPI increased by 20 basis points year-on-year to 2.8%;
- The CPI in Tokyo, Japan increased by 80 basis points year-on-year to 2.6%;
- Thailand’s CPI increased by 30 basis points year-on-year to -0.8%.
Manufacturing PMI has mixed performance:
- PMIs rose in China, India, the Philippines and Australia;
- PMI fell in South Korea, Japan, Taiwan, Thailand and Indonesia;
- PMI in other regions was generally stable.
Funds and positions
- Two consecutive months of inflows into tech stocks halted;
- Bitcoin and gold futures OI hit record highs, while ETH was slightly behind;
- Growth and Momentum stocks are severely overbought;
- China's stock market is experiencing sharp inflows after a week of brief outflows;
- Nasdaq speculative longs fall to lowest since last fall;
As secondary market yields declined, gold prices and Bitcoin prices both hit record highs, and gold and Bitcoin futures positions increased significantly. Gold open interest has increased by US$20 billion to US$98 billion in the past two weeks, but the momentum of continuous outflows from gold ETFs has not changed. GLD positions have outflowed 11.8 tons during the same period, showing that the buyers are not financial market investors but central banks and physical entities. gold buyer.
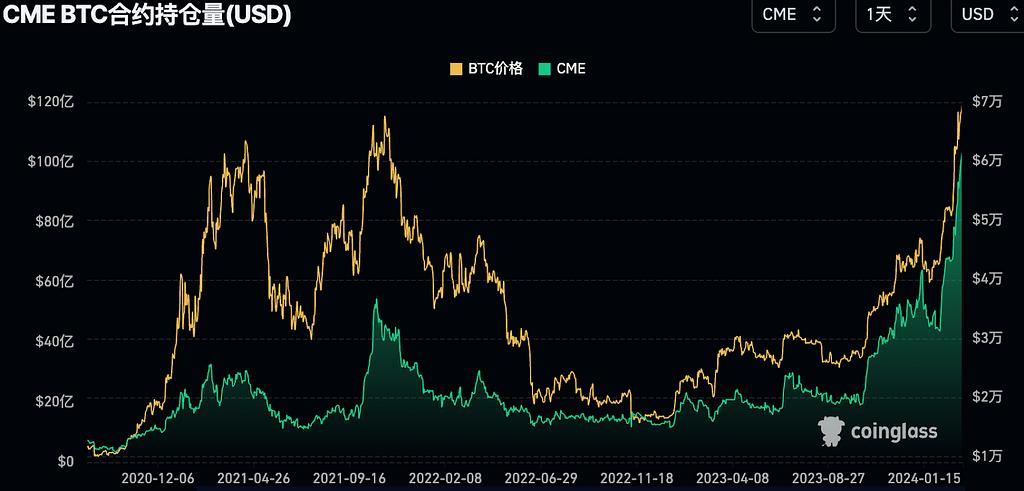
The CME Bitcoin contract increased by US$1.7 billion to US$10.37 billion last week, and the cryptocurrency exchange contract increased by approximately US$5 billion to US$32.36 billion, both of which continued to hit record highs.
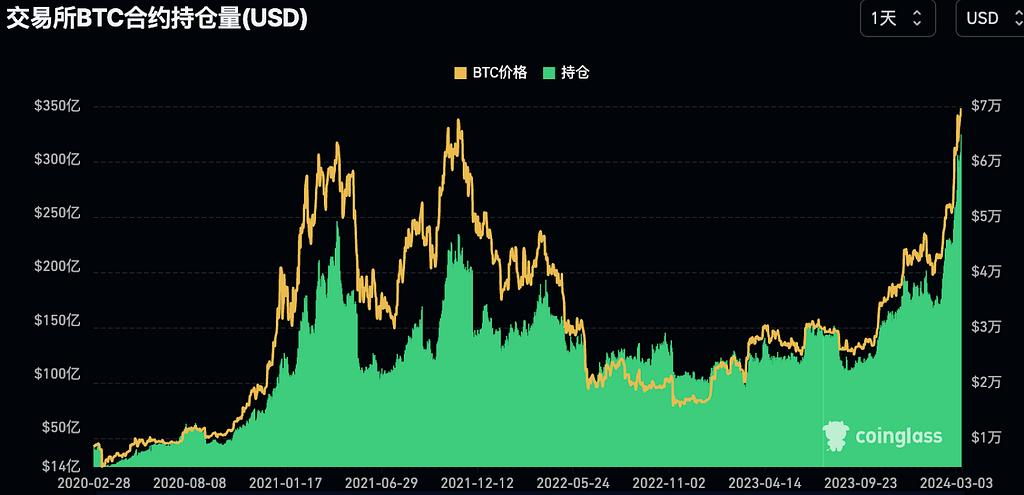
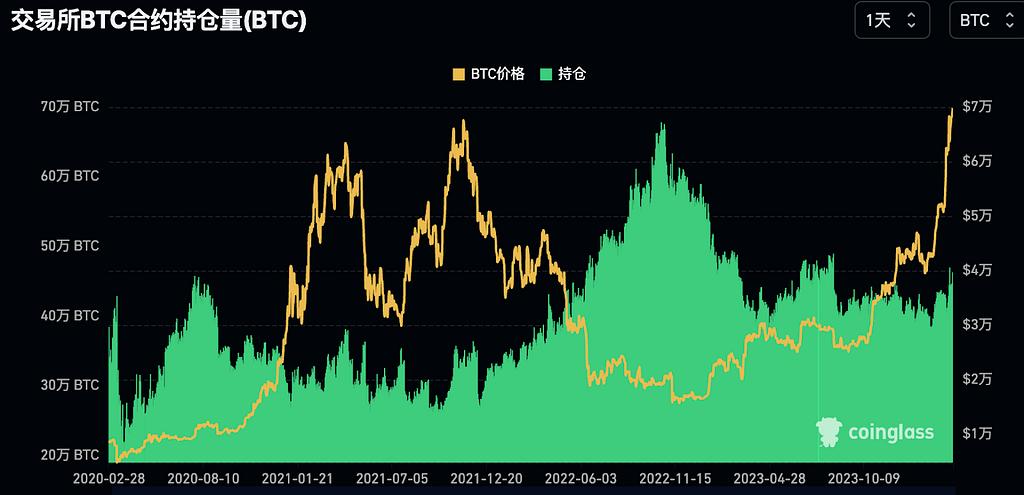
However, the number of positions denominated in BTC, including cryptocurrency exchange contracts, is only 460,000. There is still nearly 50% room for growth from the historical high of 678,000 in November 2022, which also shows the decline of the "traditional"crypto. Market capital and sentiment have yet to return to previously extreme levels:
The CME holdings of Ethereum ETH also hit a record high last week, showing that Wall Street funds are indeed interested in participating in the next physical ETF game. However, the range of new highs is much inferior to that of BTC.

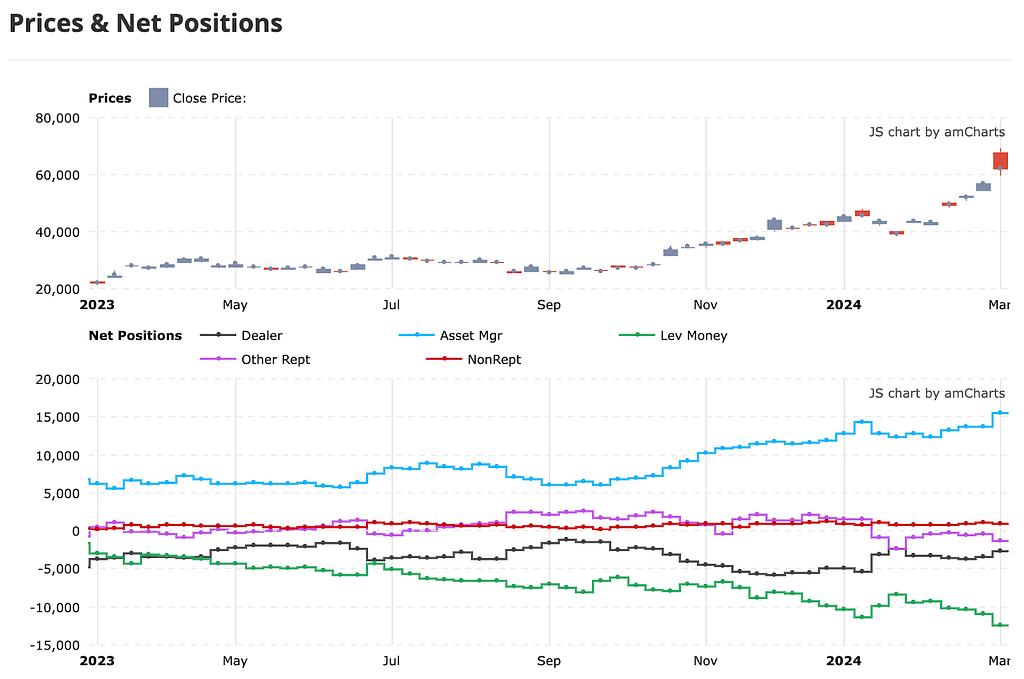
By investor type, the net short positions and net long positions held by hedge funds and asset managers respectively hit record highs last week:
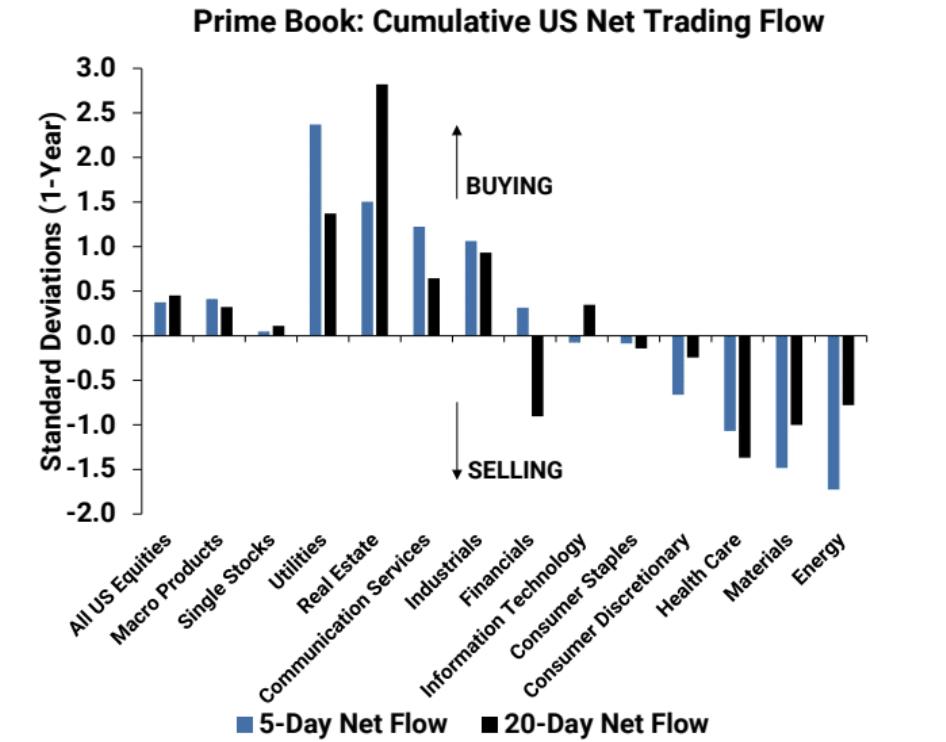
According to Goldman Sachs PB statistical caliber, the U.S. stock market experienced net buying for the second consecutive week, with long buying exceeding short selling, with a ratio of approximately 1.6 to 1. The top net buying sectors were communication services, industrials, utilities and real estate. The largest net selling sectors were energy, health care, consumer discretionary and materials. Communications Services last week saw its largest notional net buying in more than five months +1.2 standard deviations.
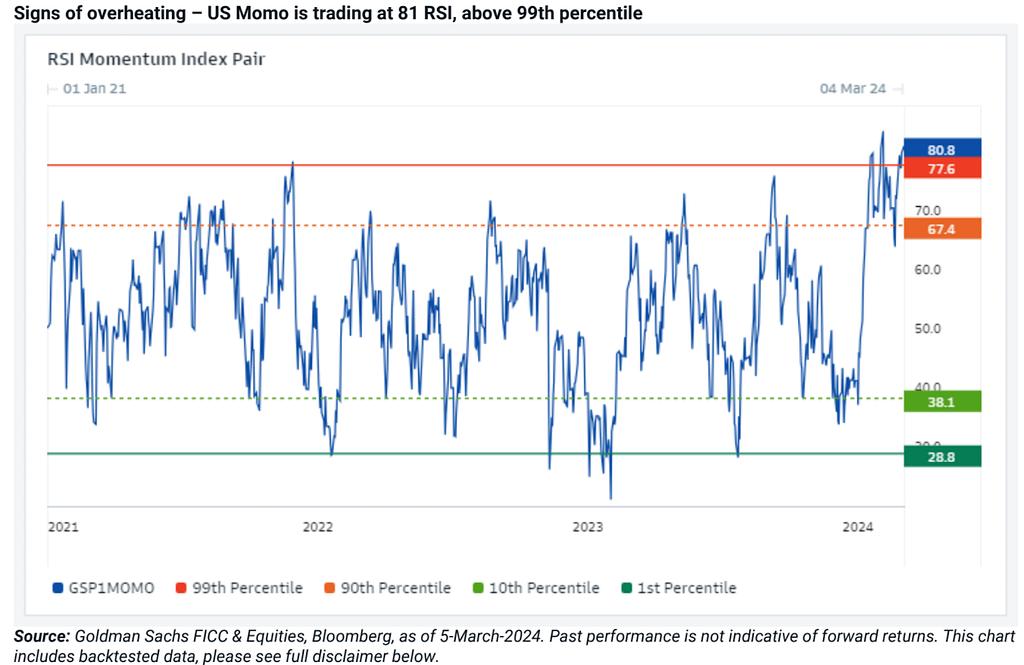
Momentum stock continues to perform strongly, and everyone has been worried that the rally in stocks with strong momentum will fail. However, the market still shows confidence in long-term themes such as artificial intelligence, improving corporate profits, receding fears of recession, and cryptocurrency reaching new highs. The momentum factor calculated by Goldman Sachs has risen by more than 20% this year, setting the best performance for the same period in history. Judging from the Relative Strength Index (RSI), Momentum US stocks have entered the severely overbought zone, higher than the 99% historical quantile level.

From the perspective of long and short positions, hedge funds are extremely fond of momentum factors and growth stocks, and the level of crowded trading has reached a record high:
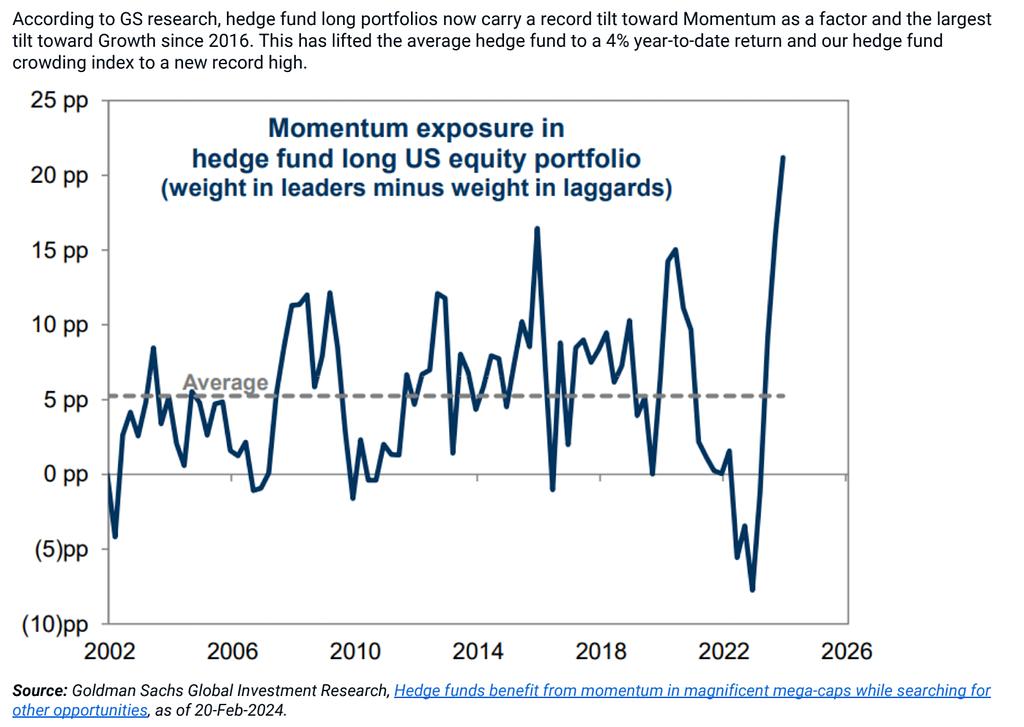
Large-cap growth stock positions enter the 96th percentile of history since 2009:

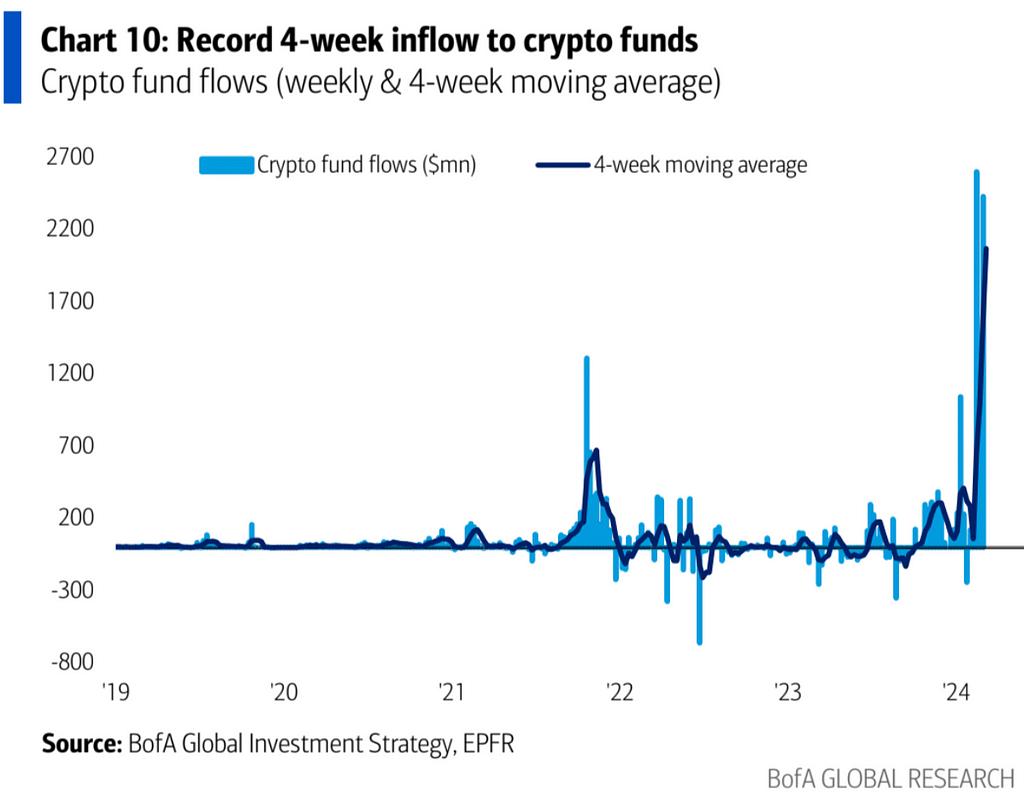
According to the EPFR statistical caliber, funds have flowed into currency funds, investment-grade debt funds and stock funds significantly, with record inflows into cryptocurrency funds and outflows from technology and energy stock funds.
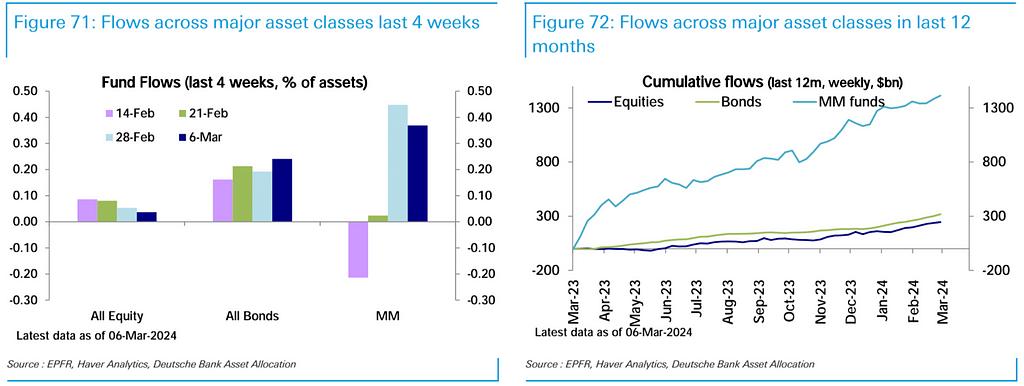
Tech funds see record $4.4 billion outflow, ending two months of inflows

Chinese stocks continued to see huge inflows of $3.8 billion last week after a brief week of outflows

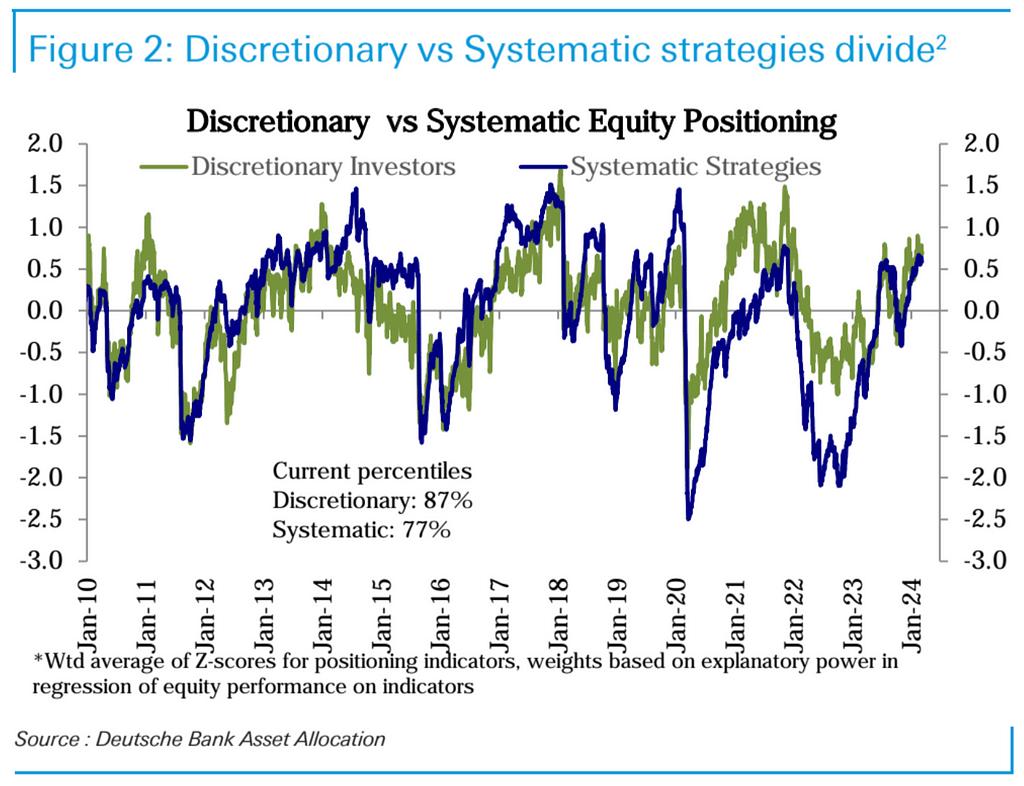
The positions of subjective investors remained basically unchanged, while the positions of systematic investors decreased slightly:
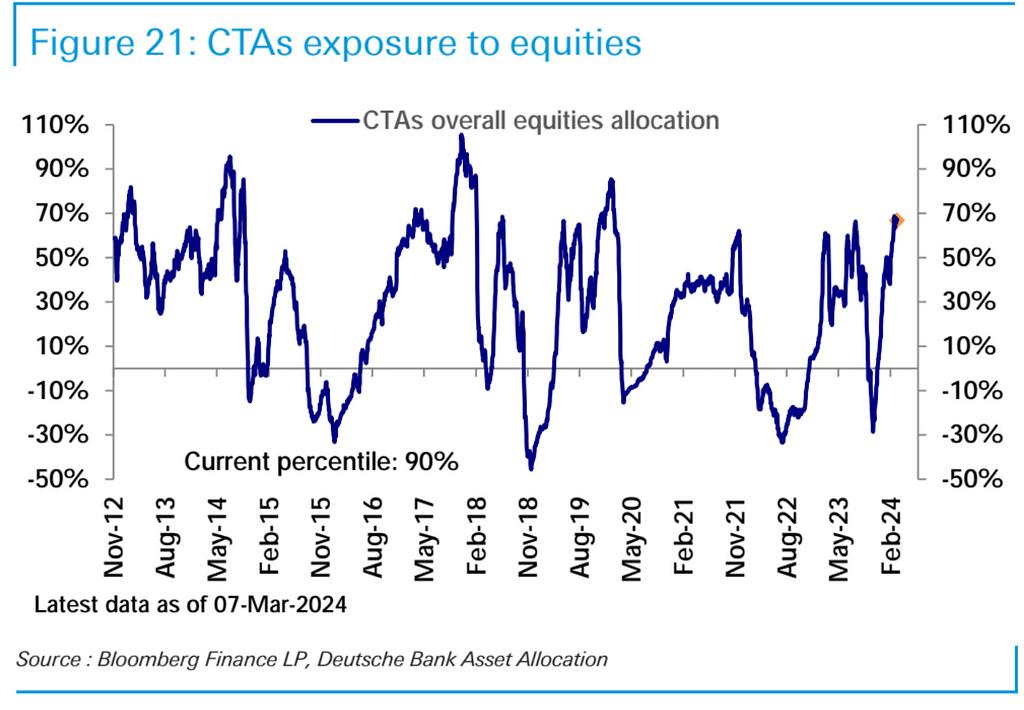
CTA fund positions remained flat last week, at the 90th percentile historically
Nasdaq futures net longs declined for the third consecutive week, falling to last fall's levels:
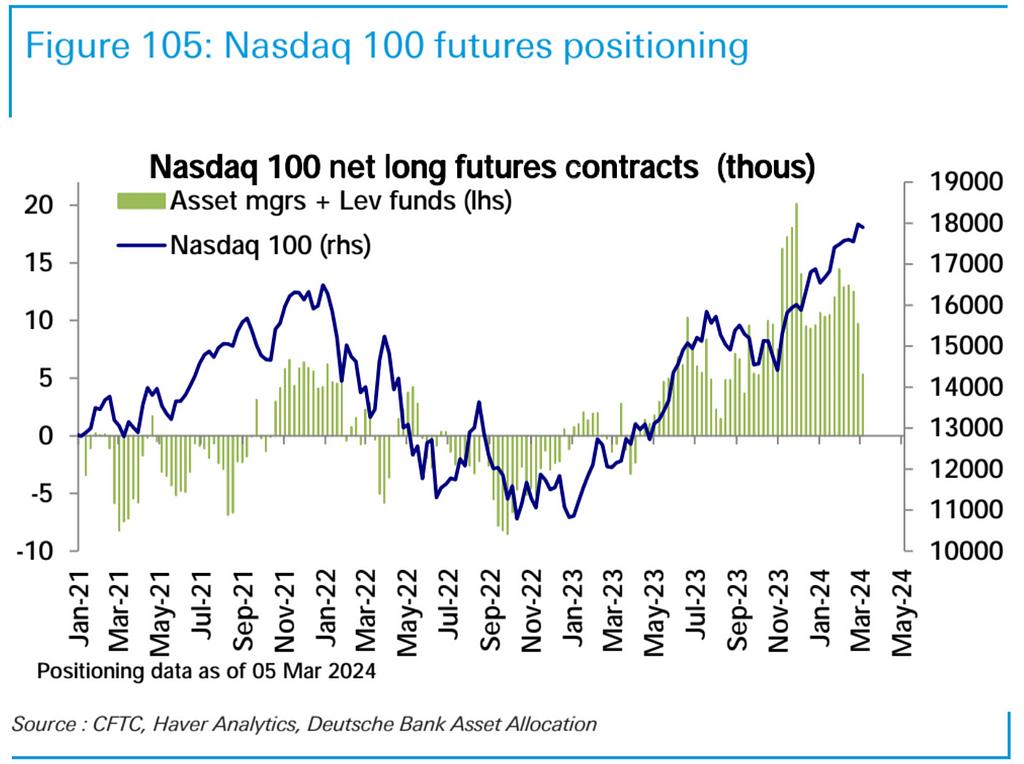
Mainly caused by hedge fund short, the current short level is close to the highest level in the past three years:

election impact
Over the past three presidential elections, which of course coincided with the halving cycle, so the U.S. elections in 2012, 2016 and 2020, Bitcoin's average return in those years was 192%, and Bitcoin rose in each of those years More than 100%. So based on 192%, we will start this year at US$40,000, and Bitcoin can reach US$125,000 by the end of the year.
Trump is currently leading the polls. If he wins, possible monetary and economic policies include:
- There is no large-scale tax reform like last time
- Emphasize "protectionism", increase tariffs, and expand trade wars (bad for the stock market)
- Deregulate financial and environmental sectors (good for stocks)
- After Trump is elected, he may put pressure on the Federal Reserve to maintain lower interest rates (good for the stock market)
- Fed hopes to prevent recession by keeping political low profile ahead of election (good for stocks)
- Pay more attention to suppressing inflation than maintaining employment (good for the bond market)
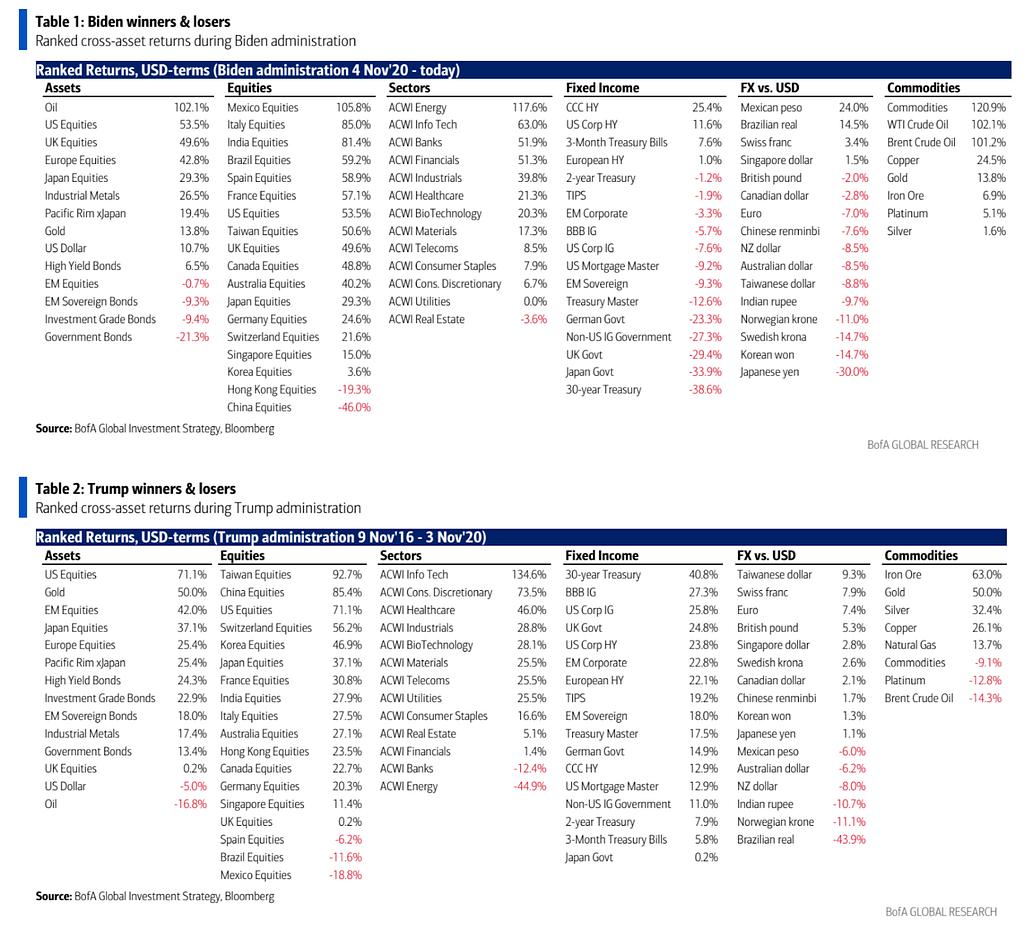
Historically, the best-performing assets during the election periods of Biden and Trump did not include BTC. BTC rose by 400% during the Biden period and 1,900% during the Trump period. What is interesting is crude oil, the U.S. dollar, and South American stock markets. The returns on Asian stocks and bonds were almost completely opposite during the two presidents’ administrations:
market sentiment
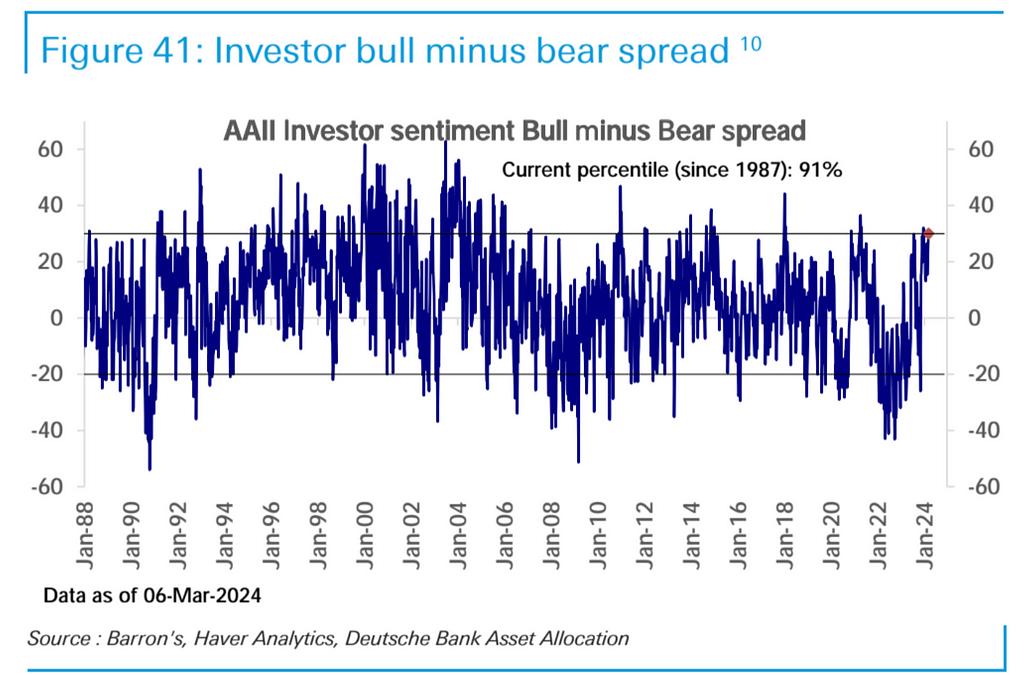
Investor survey sentiment climbed to an 11-week high, entering the top tenth percentile historically.
institutional perspective
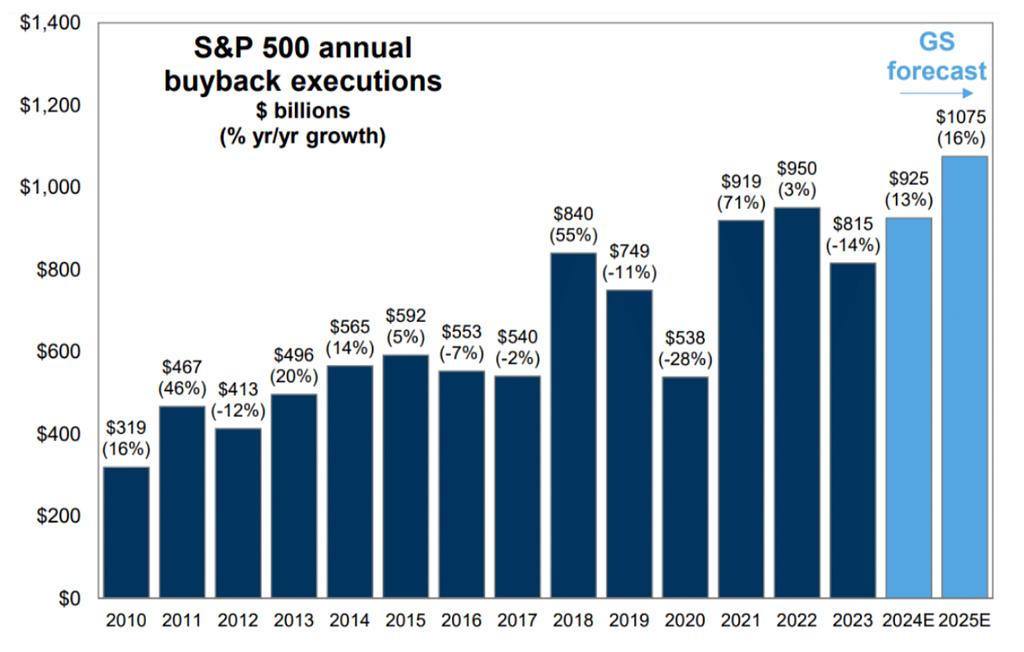
[GS: Buyback volume is expected to increase significantly this year and next year]
The current scale of corporate buybacks far exceeds the scale of corporate new stock financing. A Goldman Sachs report predicts that the scale of stock repurchases implemented by U.S. listed companies will reach $925 billion in 2024, a year-on-year increase of 13%. Looking forward to 2025, Goldman Sachs expects the scale of repurchases to further increase to US$1.075 trillion, a year-on-year increase of 16%. Buybacks remain one of the most important supporting forces for U.S. stocks.
[JPM: Is the allocation ratio of Bitcoin higher than that of gold? 】
JPMorgan Chase mentioned in a report last week that of the US$3.3 trillion invested in gold, only 7% or US$230 billion is held in ETF format. If the Bitcoin ETF can reach 230 billion, the market value of Bitcoin may increase from US$1.3 trillion to US$3.3 trillion.
But considering that Bitcoin is 3.7 times more volatile than gold, Bitcoin should account for a lower proportion of the investment portfolio. Simply use 3.3 trillion US dollars / 3.7 = 0.9 trillion US dollars, which corresponds to a Bitcoin price of 45,000 US dollars. So the current price of more than 60,000 means that the implicit allocation to Bitcoin in everyone's investment portfolio has exceeded that of gold.
Still using the so-called "vol ratio" (volatility ratio), divide the gold ETF's market value of $230 billion by the volatility ratio of 3.7 = $62 billion. The author believes that this is an asset management goal that Bitcoin ETF can achieve conservatively. It’s already 52 billion.
LD Capital
As a global blockchain investment firm, we have built a portfolio of over 250 investments since 2016, spanning across various sectors, including infrastructure, DeFi, GameFi, AI, and the Ethereum ecosystem. We focus on investing in projects with disruptive innovations, actively taking on the role of primary investors, and providing comprehensive post-investment services to these projects. We employ a combination of direct investment from our own funds and a distributed fund model to cover all-stages of investment.
Trend Research
Trend Research division specializes in crypto hedge funds focusing on secondary areas within the crypto market. Our team members come from top platforms and institutions like Binance and CITIC. We excel in macroeconomics, industry trends, and project data analysis, with trend, hedge, and liquidity funds.
Cycle Trading
We specialize in Web3 project investment and service, with a strong emphasis on Infra, applications, and AI. We have a team of nearly 20 senior engineers and dozens of crypto experts as advisors, assisting projects in strategic design, capital platform relations, and liquidity enhancement.
website: ldcap.com
twitter: twitter.com/ld_capital
mail: BP@ldcap.com
medium:ld-capital.medium.com


