executive Summary
- Bitcoin prices fell 15.4% from the latest all-time high of $73,000 to as low as $61,000. This price action is very consistent with the previous 2018-21 cycle.
- Multiple on-chain indicators show that investors have sold for more than $2.6 billion in profit as the market reached resistance levels, marking an increase in profit-taking events.
- The overall Bitcoin market shares several similarities with previous all-time high (ATH) breakouts, particularly related to selling pressure from the long-term holder group.
Bitcoin markets are taking a breather after a strong uptrend over the past two weeks, having corrected and consolidated above $61,000. Bitcoin price retreated -15.4% from a new high of $73,100 hit on March 13, falling to a local low of $61,800 on March 20 before recovering to $70,000.
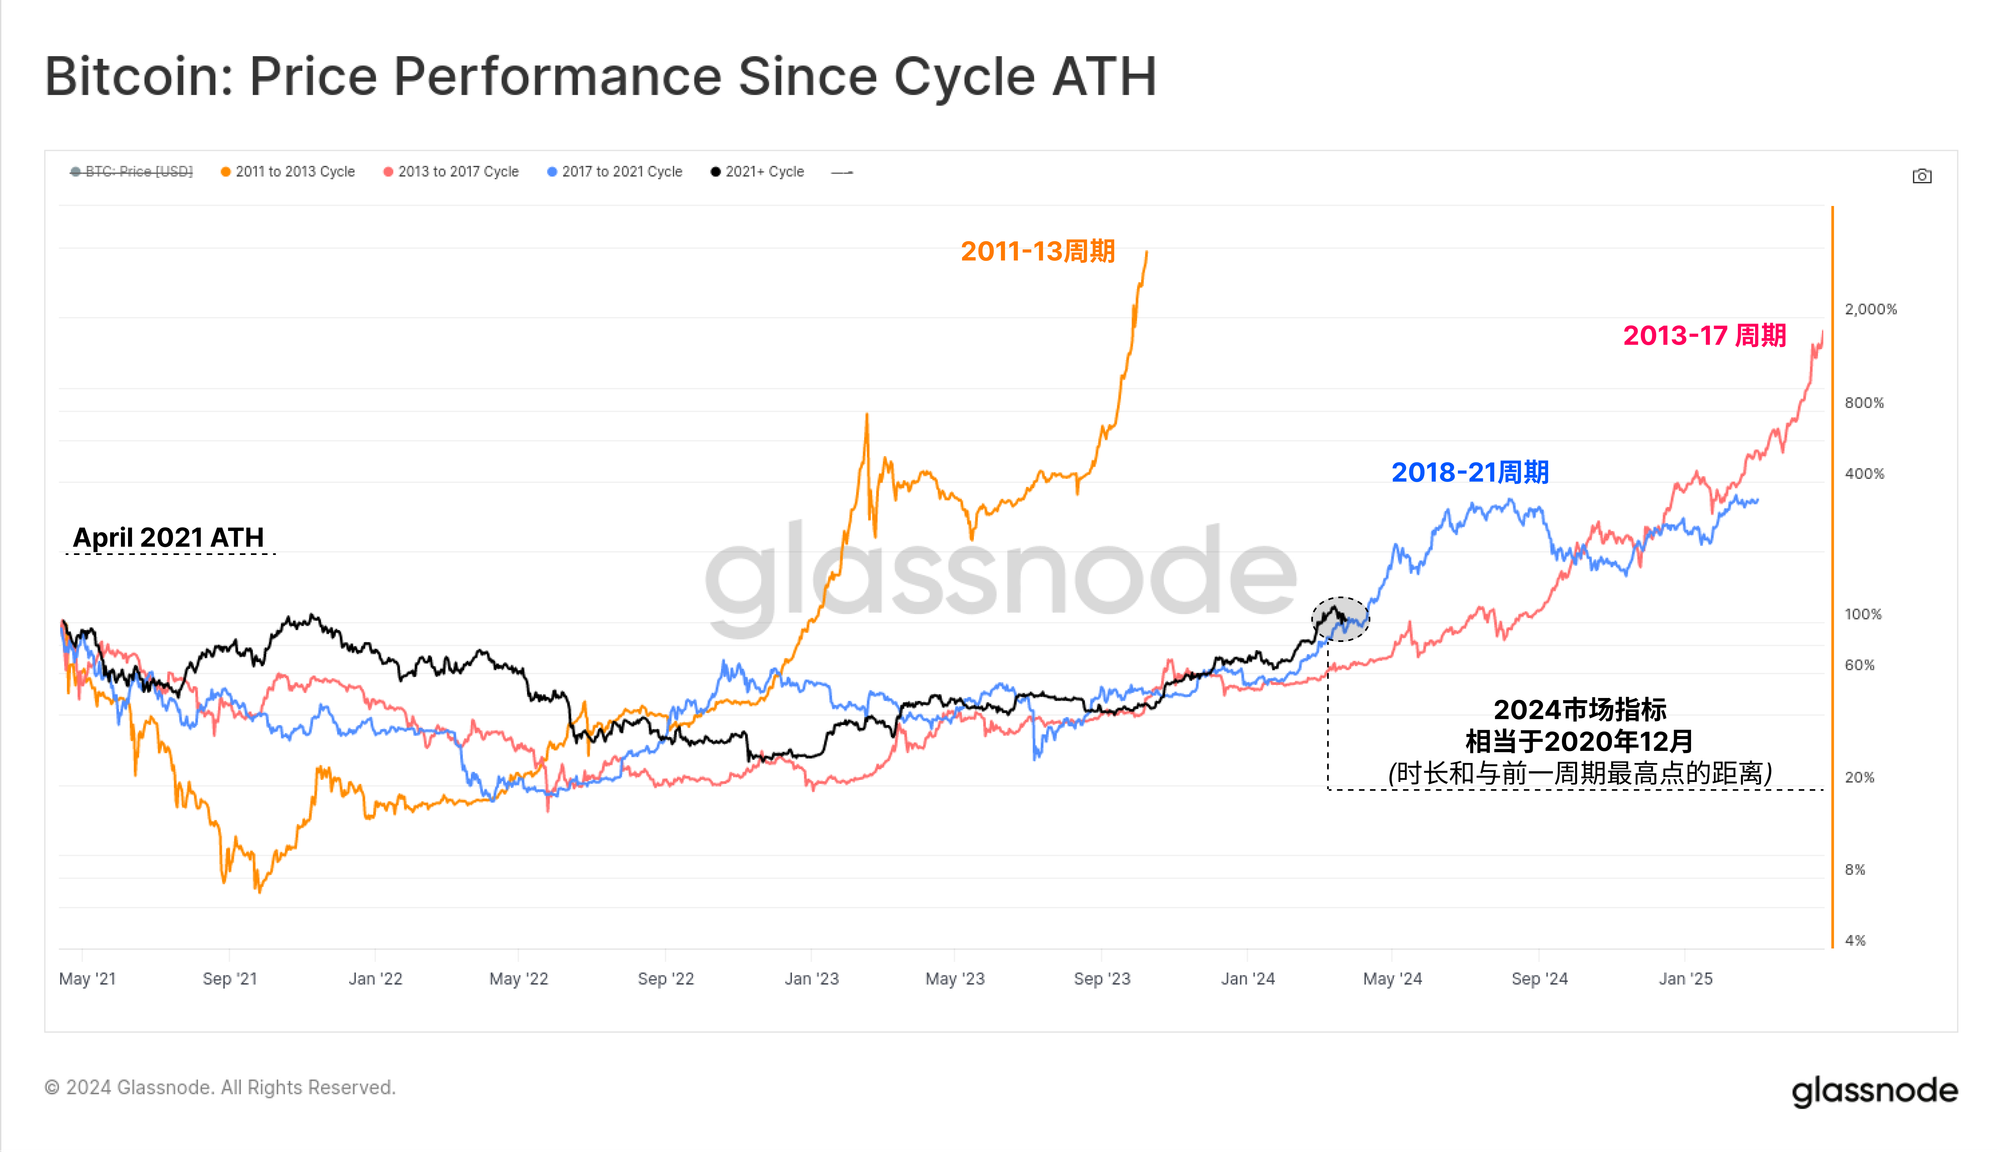
If we index price performance (black) since the all-time high in April 2021 (the period we believe bear market sentiment began), we can see a striking similarity to the previous cycle (blue). In terms of duration and distance from the April 2021 peak, the market is almost in the exact same position relative to the 2018-2021 cycle as it was in December 2020.
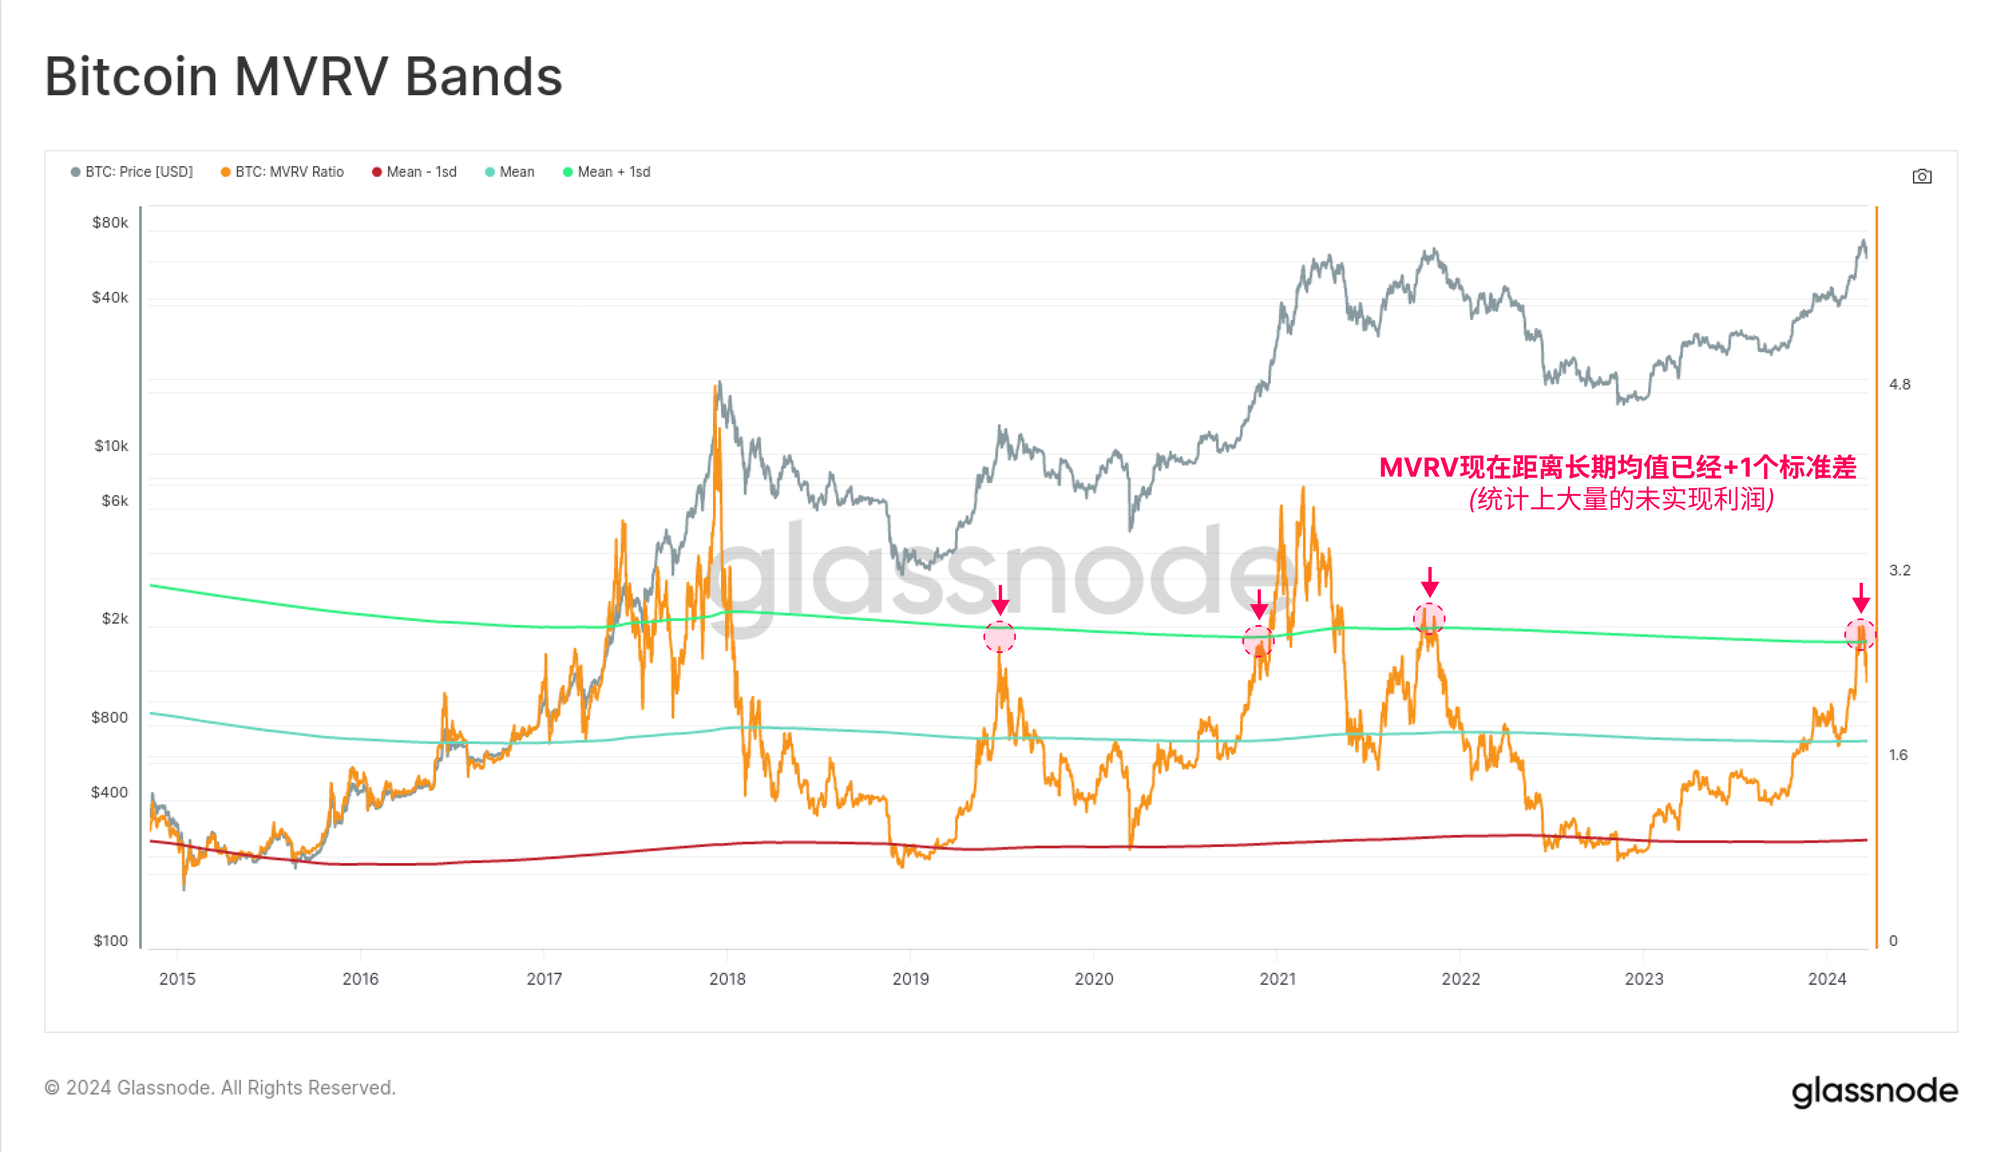
In our video report last week , we explored how the Bitcoin market reached several statistically significant levels regarding unrealized profits held in supply. Indicators like MVRV and AVIV ratio reached levels +1 standard deviation from their long-term average.
Past instances have historically been points of concern where the market found a level of resistance and some investors began to take profits.
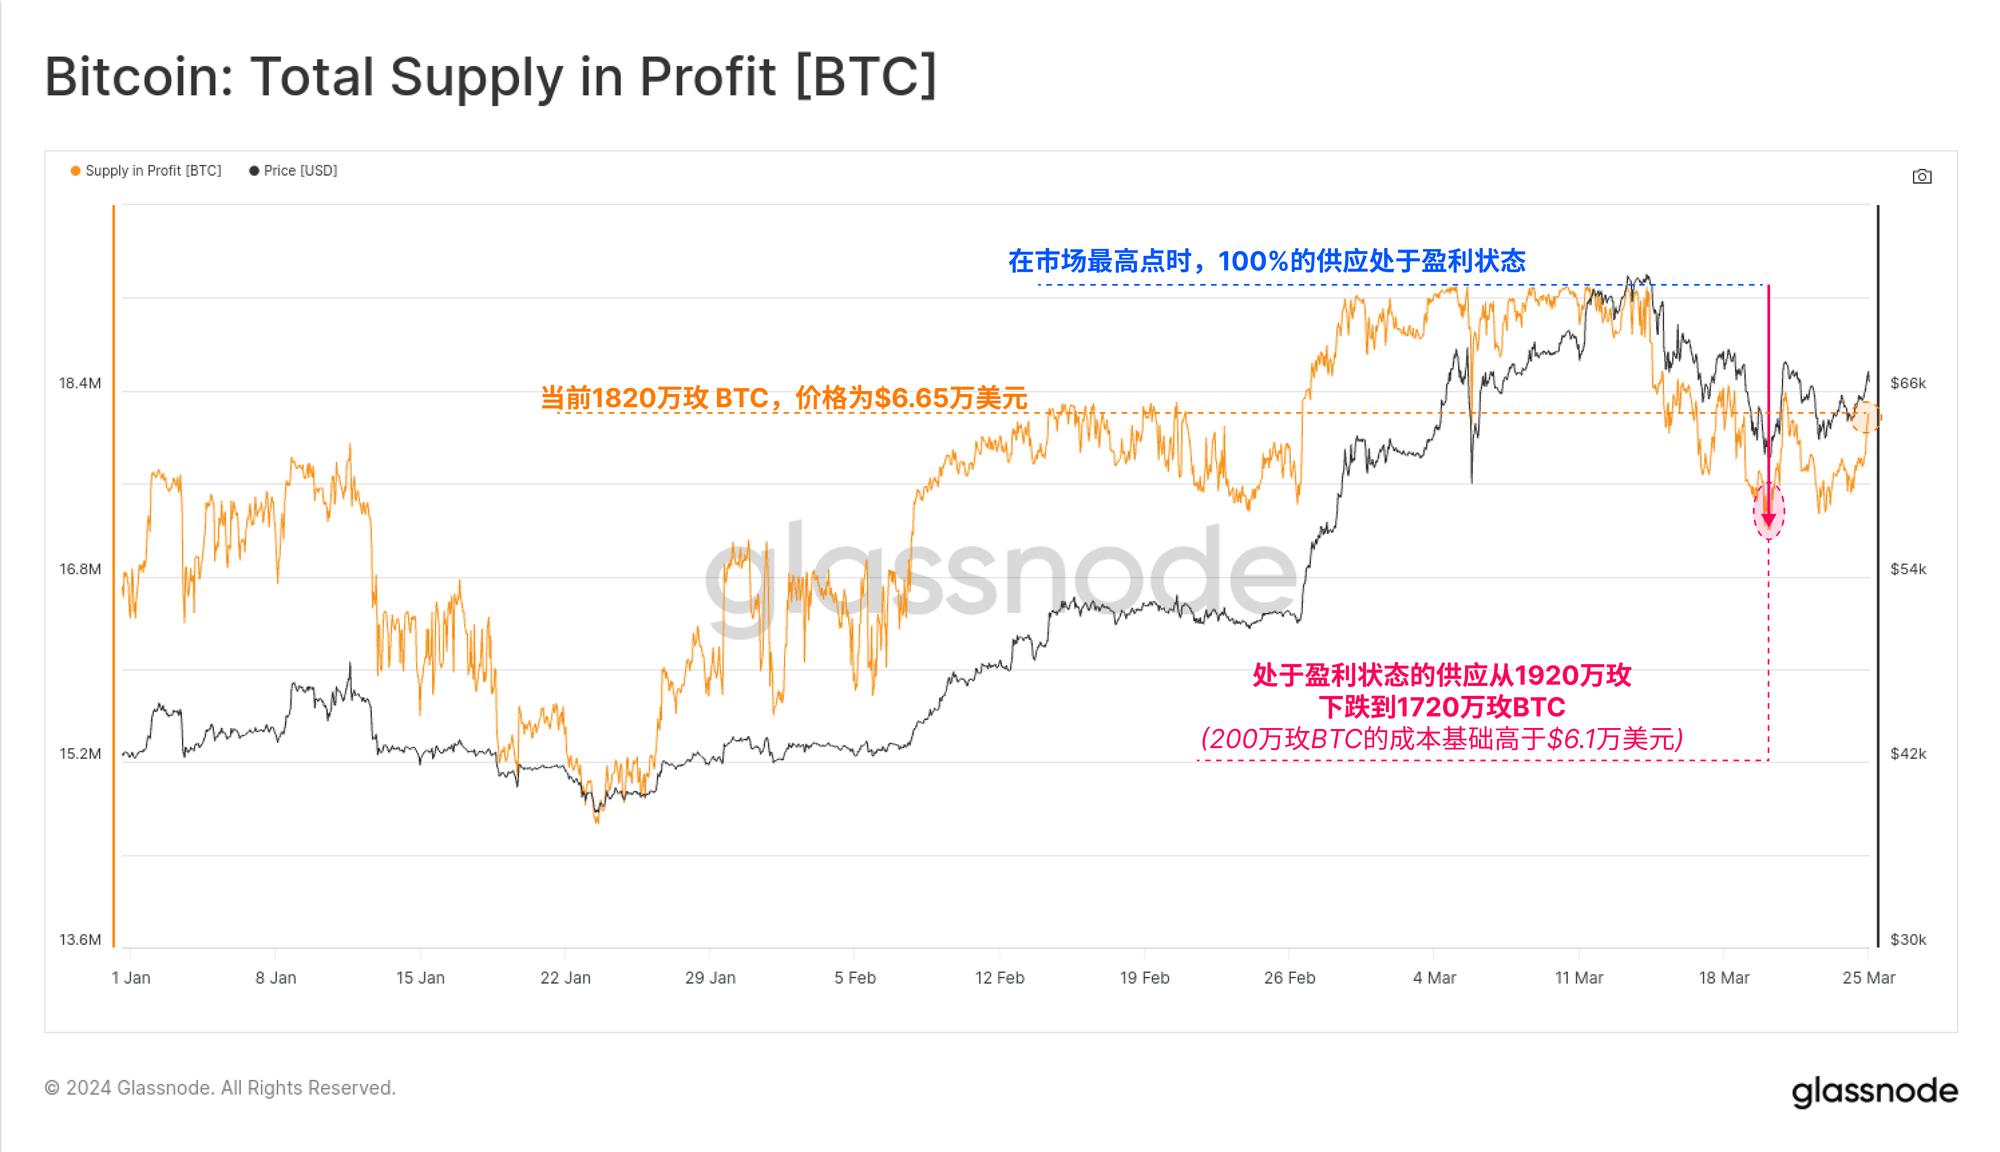
As the price retreated from its all-time high to its recent low of $61,200, a total of 2 million Bitcoins moved from "profitable" status to "lossy" status. This provides an indication of the amount of Bitcoin coins that have been transacted at the new boosted cost basis.
As the market rebounded to $66,500, approximately 1 million Bitcoin coins returned to "profitable" status. From these two observations we can determine:
- The cost basis of approximately 1 million Bitcoins ranges from $61,200 to $66,500.
- The cost basis of approximately 1 million Bitcoins ranges from $66,500 to an all-time high of $73,200.
This is one of the larger “supply clusters” encountered during a pullback since the 2022 lows, indicating an acceleration in the amount of Bitcoin on-chain in recent months.
Take the chips from the poker table
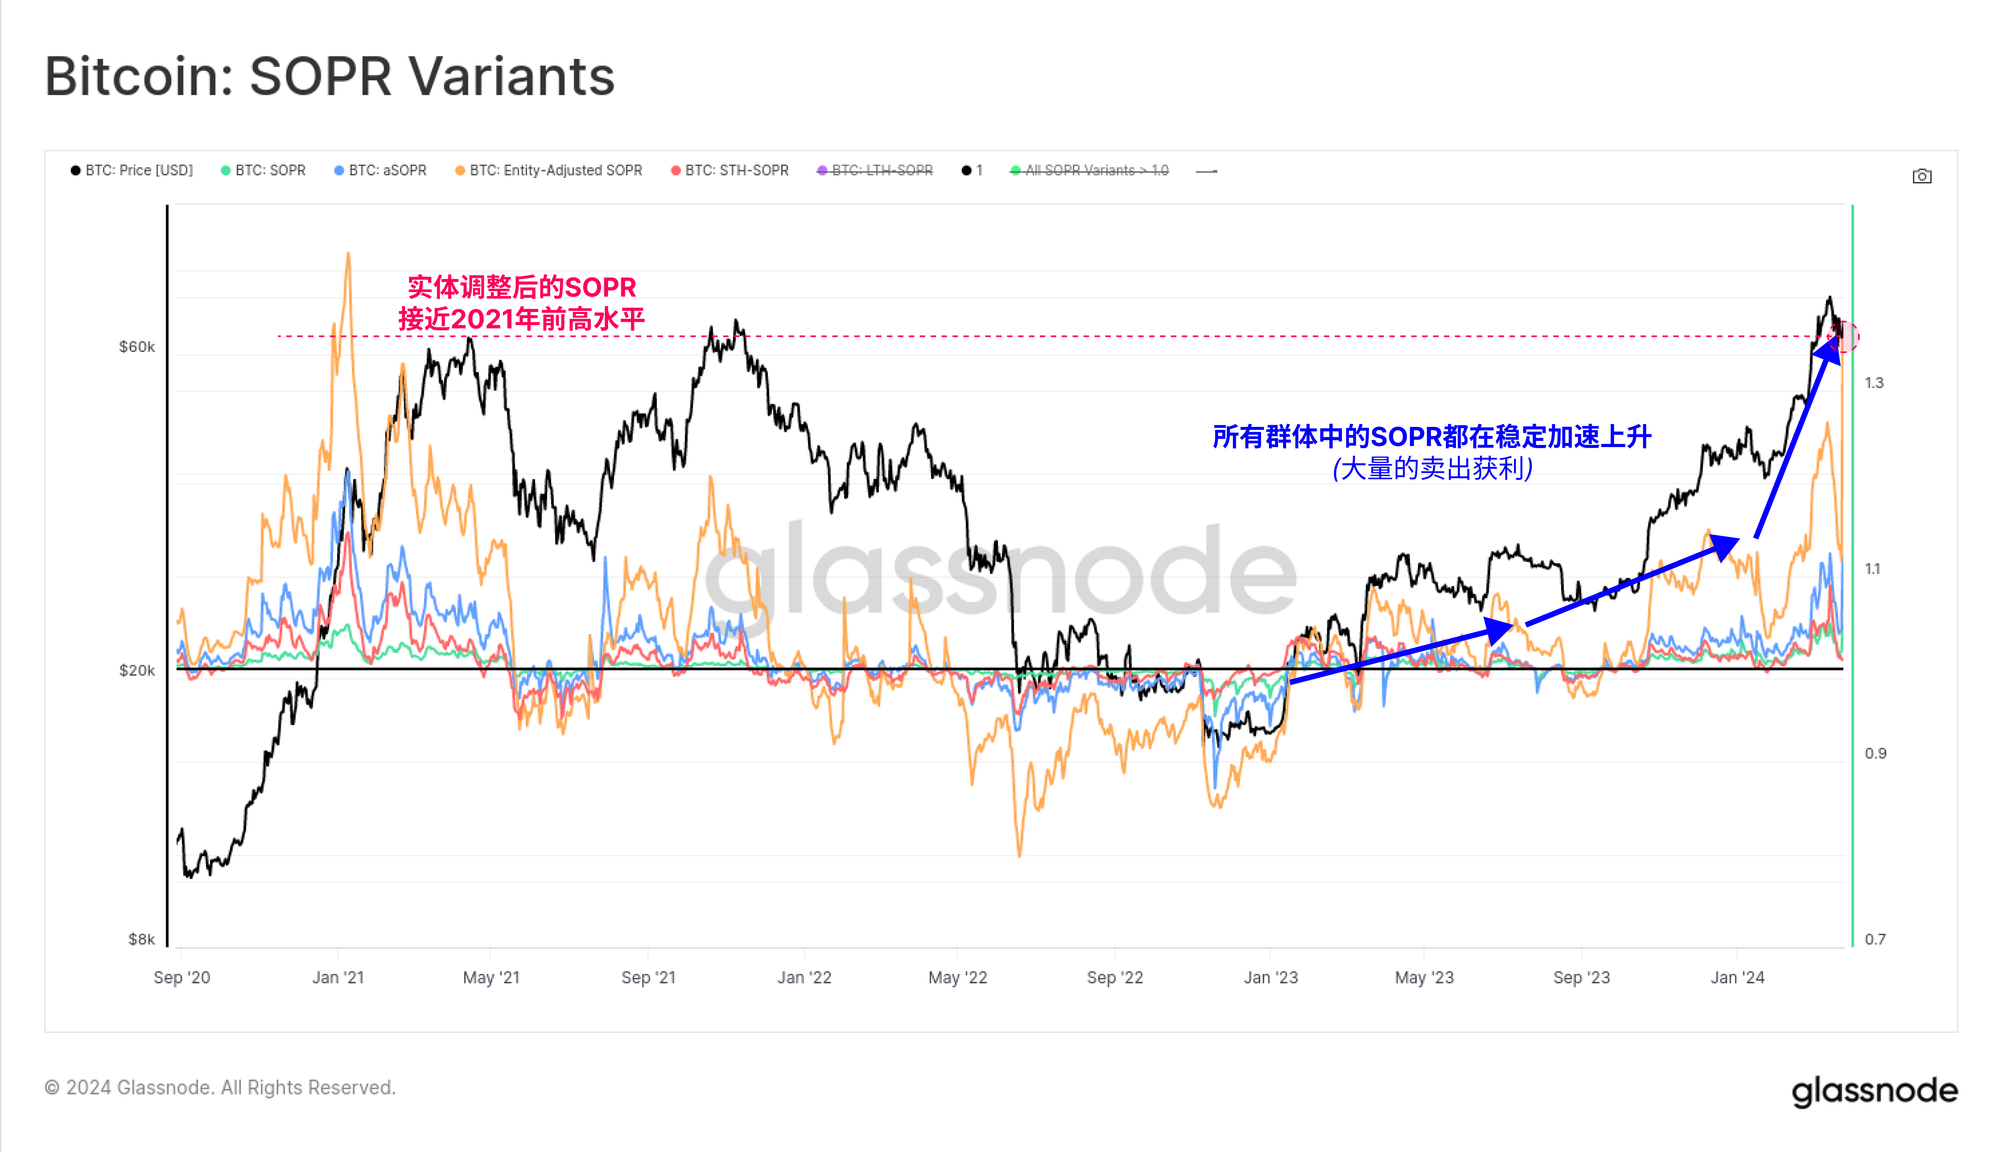
There are now 2 million Bitcoins with a cost basis in excess of $61,200 that have recently changed hands, with previous owners selling them to lock in profits. The chart below shows several variations of the SOPR indicator that describe this profit-realizing behavior.
SOPR describes the average realized profit/loss multiple locked in within the considered group and is the "sold" analogue of MVRV (unsold, which measures average unrealized profit/loss). All four variants have reached relative highs, with our real correction variant approaching levels seen during the 2021 bull market highs.
This suggests that the market is accelerating the volume and magnitude of profit-taking in its spot markets.
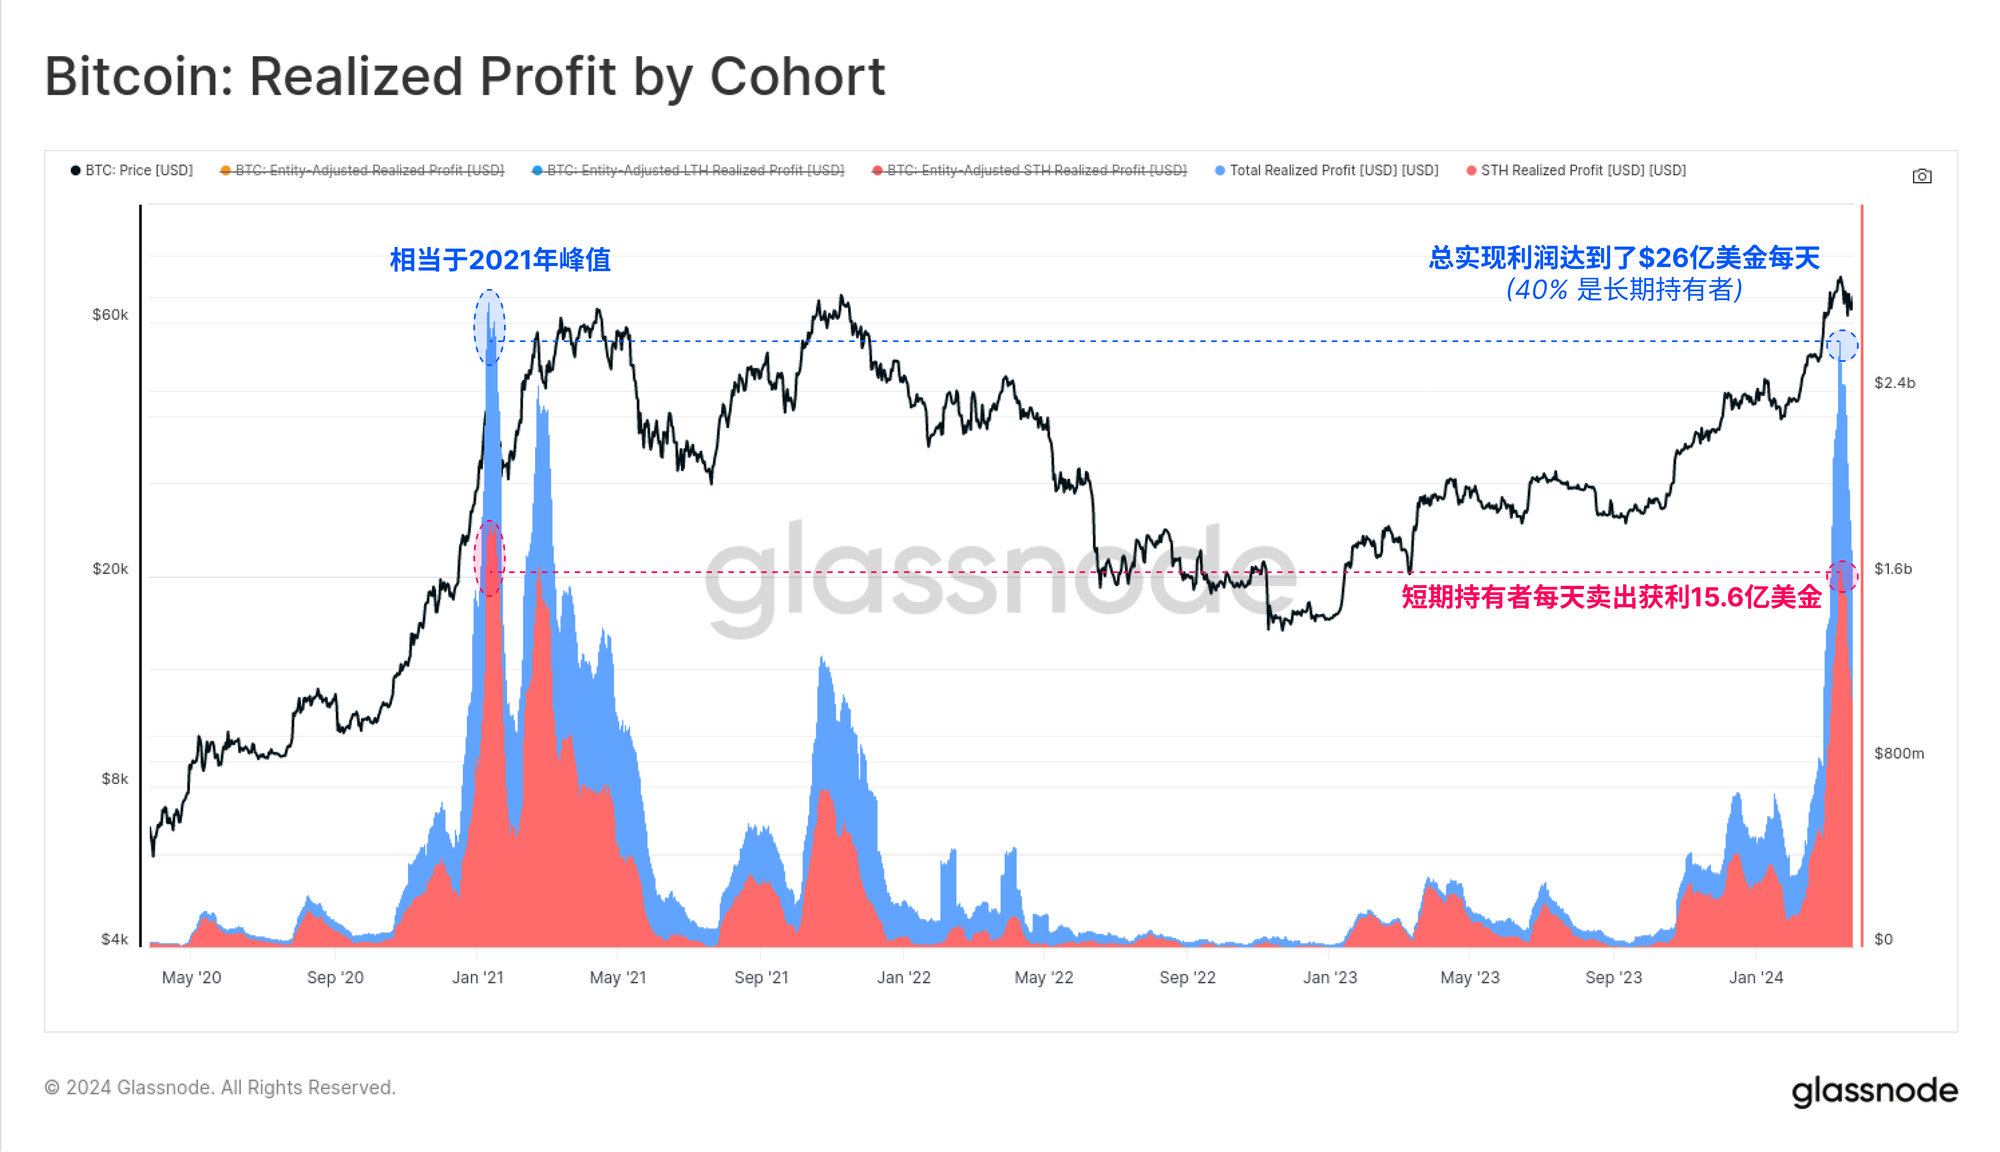
When the market reached an all-time high (ATH) of $73,200, investors sold on-chain, locking in over $2.6 billion in realized profits. About 40% of this profit-taking can be attributed to the long-term holder group, including investors who withdrew their money from the GBTC trust.
The remaining $1.56 billion in realized profits was locked in by short-term holders, with traders taking advantage of incoming liquidity and market momentum. Realized profits for both groups have reached similar magnitudes as during the peak of the 2021 bull market.
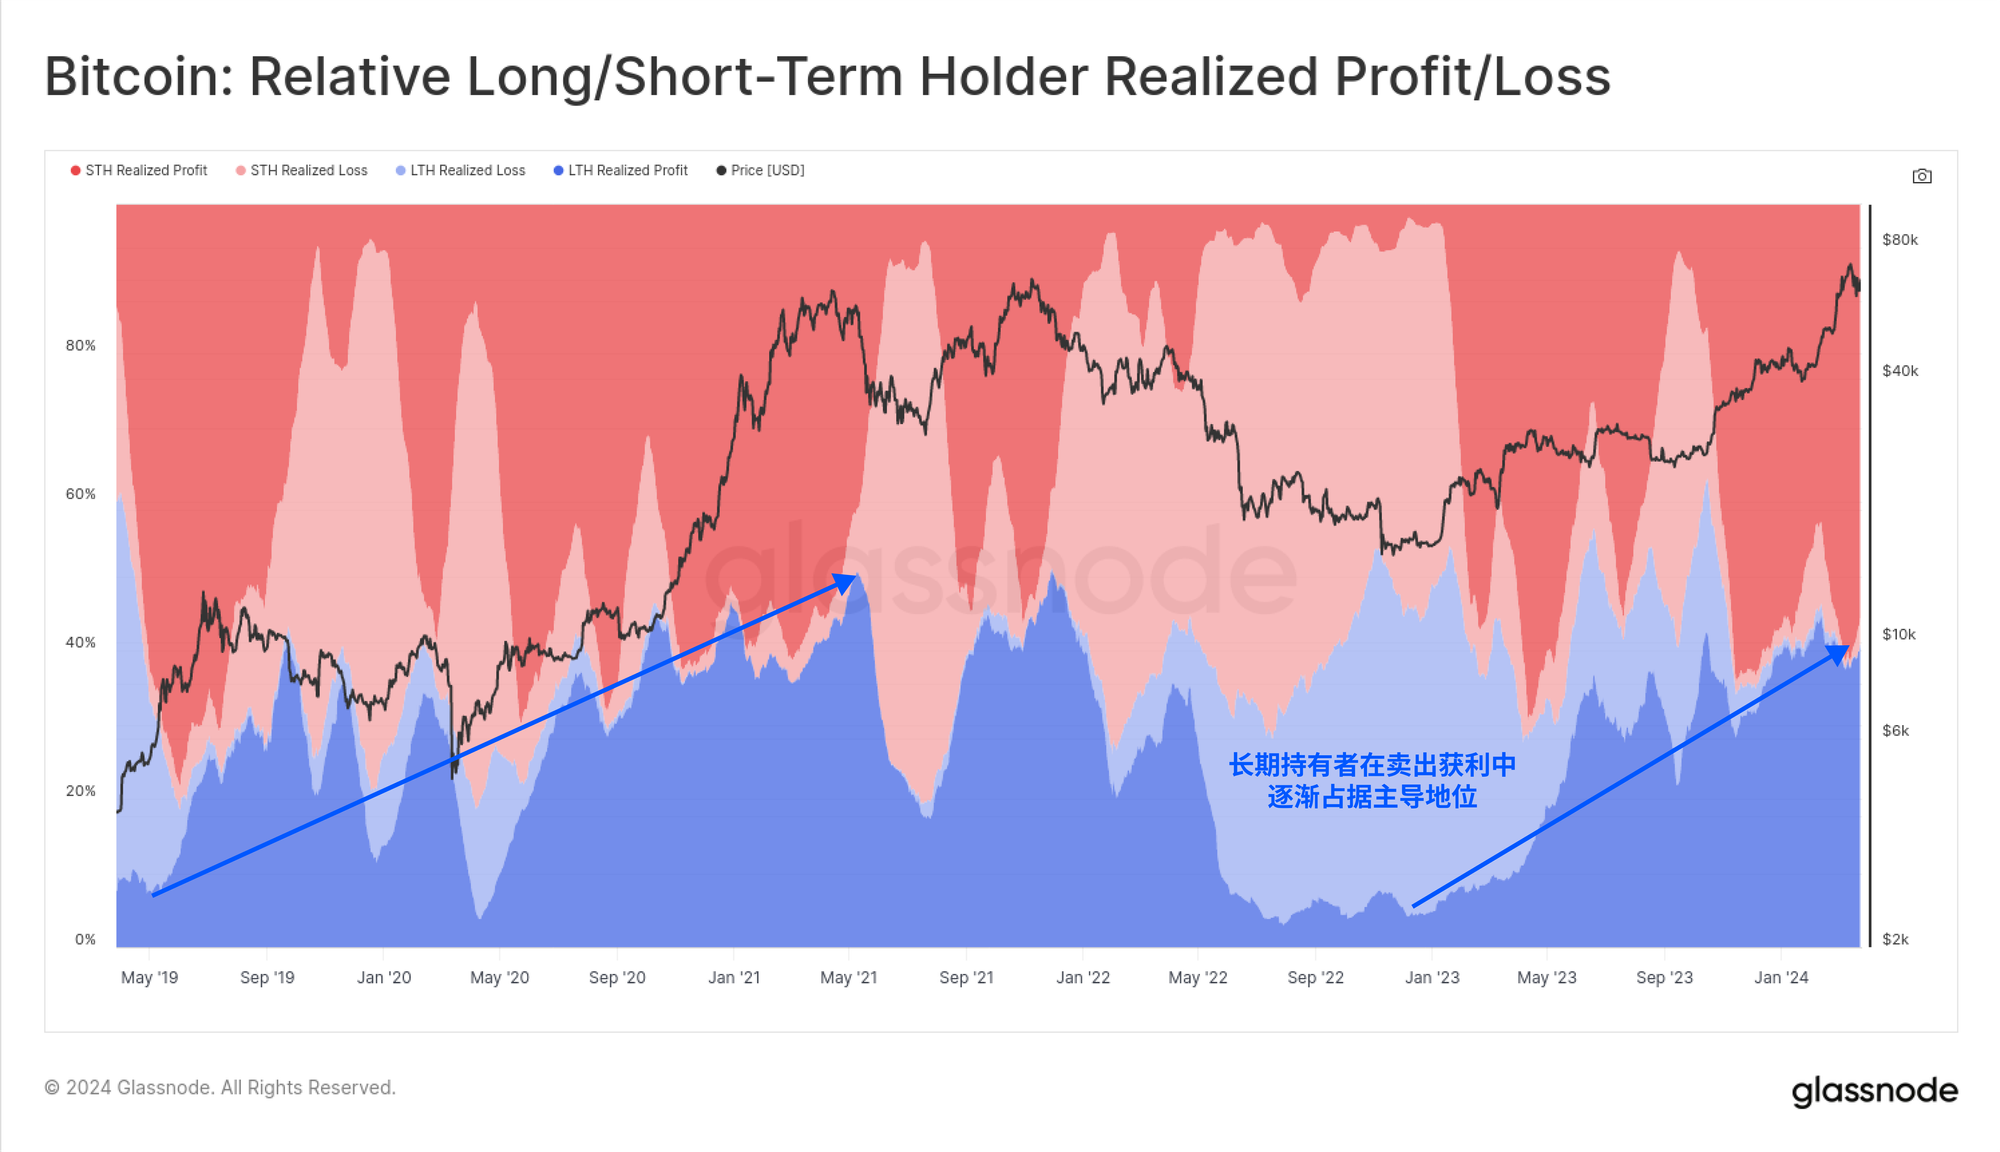
We can also see that the dominance of long-term holders is strengthening compared to all profit-taking events. This is consistent with our previous report ( Week 11 On-Chain Report ), in which we noted increased selling by long-term holders (LTH) as the market broke above new all-time highs (ATH).
This pattern of behavior is typical of all previous Bitcoin cycles and we documented it in our previous report; Tracking the Smart Money . From this perspective, analysts can begin to view LTH as an increasingly important group when assessing the magnitude of future sell-side supply pressure.
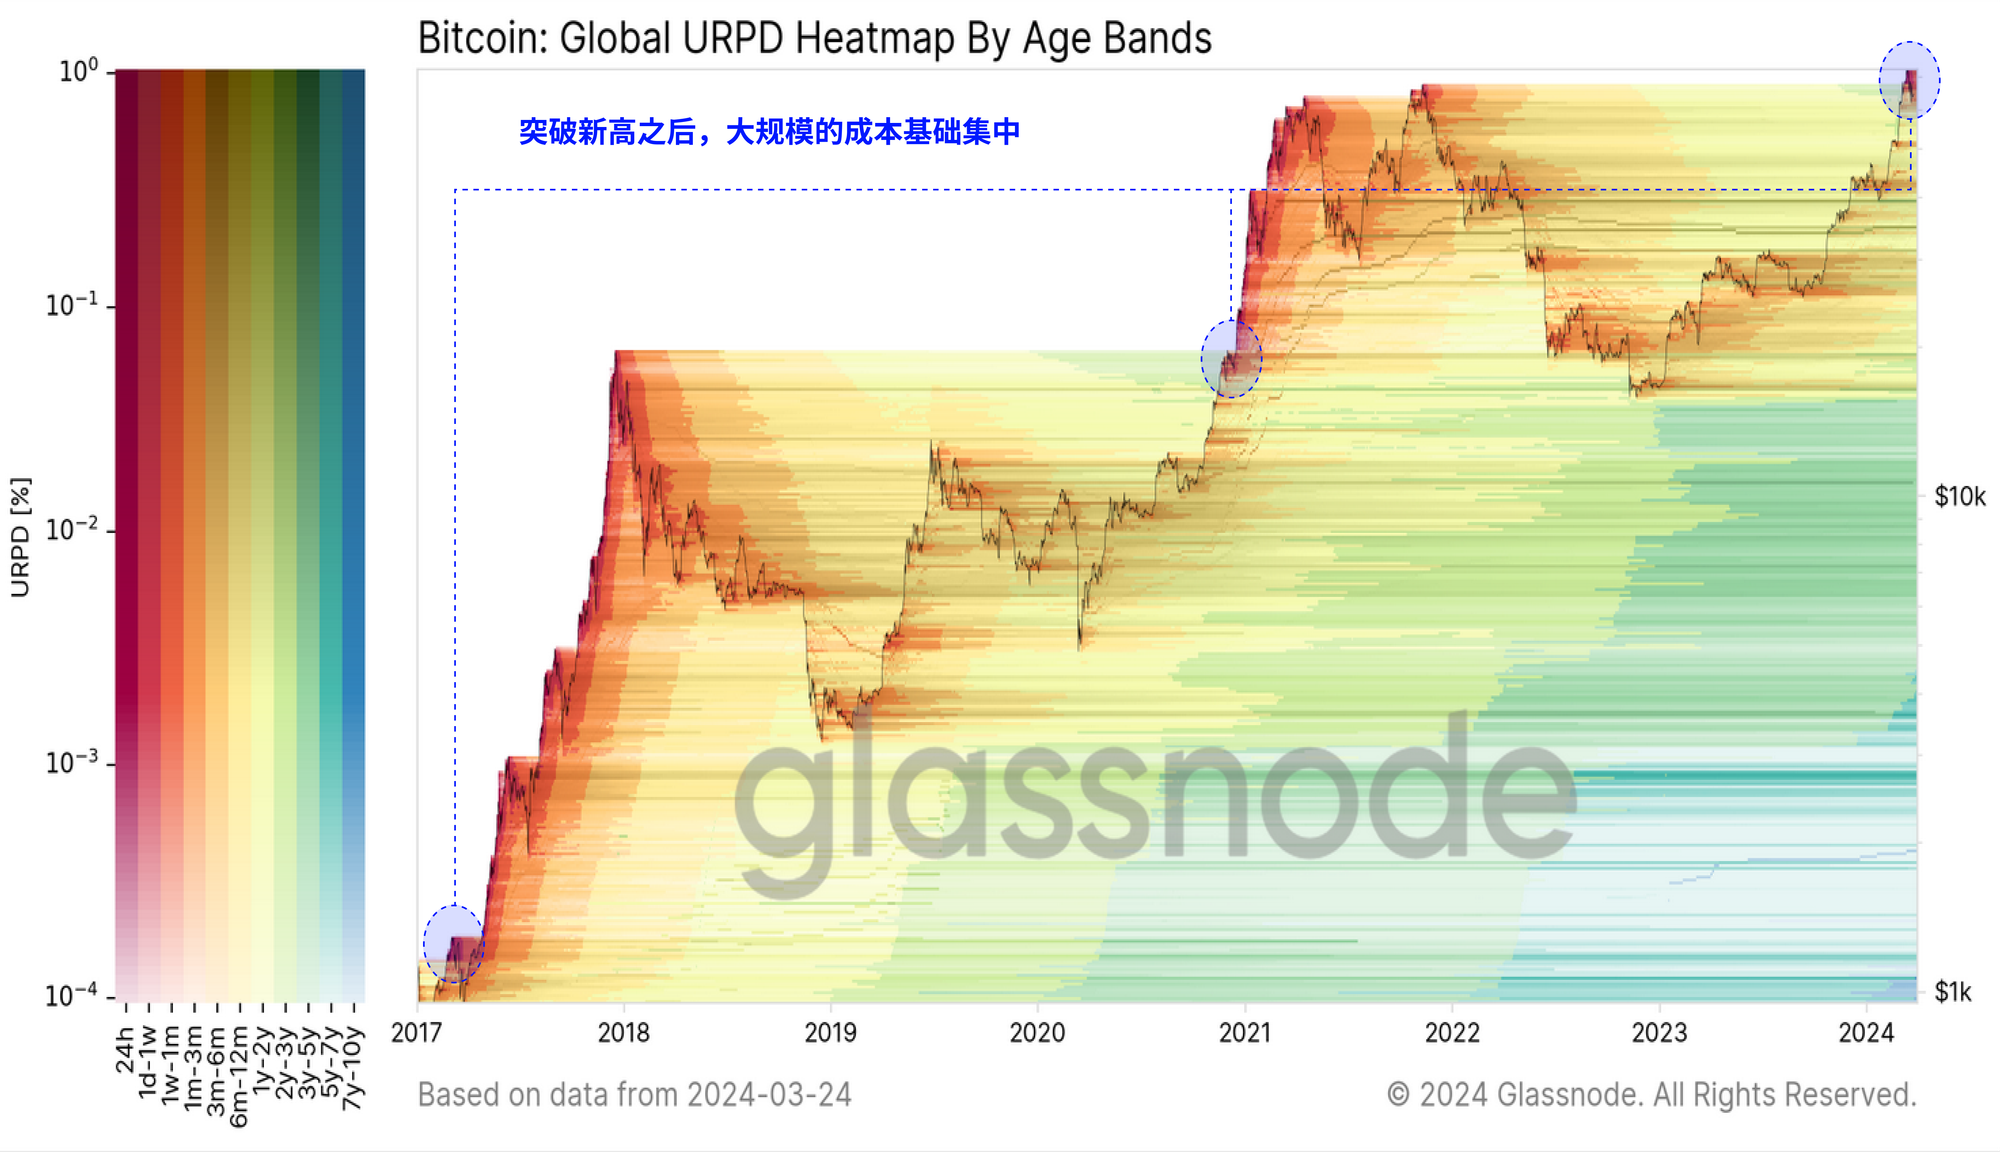
Finally, we can refer to a rather attractive chart that shows the supply population over time and coin age. We've highlighted in blue the previous price breakout to all-time highs, which catalyzed a clear transition to "red hot supply".
These warmer colors indicate that a large amount of older supply is starting to trade, change hands, and be revalued back to the current spot price. We can see that this has often characterized the “mania phases” of previous Bitcoin bull markets, and so far a very similar pattern is playing out.
From this perspective, we can conclude that higher prices tend to activate more dormant supply, bringing older illiquid supply back into the liquid cycle.
This reflects a wealth transfer event, with long-term holders selling at a profit to satisfy a wave of new inflows of demand.
 Summary and conclusion
The Bitcoin market has surpassed a new ATH of $73,000, triggering an increase in profit-taking events among long-term holder groups. The market is currently realizing profits of more than $2.6 billion per day, indicating that many investors are beginning to withdraw their chips. However, this is not typical market behavior and fits well with the market pattern observed with previous high breakouts in all previous cycles.


