

A pivotal moment is expected to hit the cryptocurrency market as the fourth Bitcoin halving approaches. The event, expected to occur between April 16 and 20 of this year, will see Bitcoin’s miner rewards cut in half from 6.25 BTC per block to 3.125 BTC. While historical halvings have been a key indicator of potential market moves, Volcano X urges caution when directly extrapolating past patterns to predict future outcomes due to the limited sample size of the three previous events.
A new era in Bitcoin market dynamics
The launch of spot Bitcoin ETFs in the United States has fundamentally changed the supply and demand landscape for Bitcoin. Within two months of their inception, these ETFs have seen billions of dollars in net inflows, marking a significant shift in market dynamics. This development not only establishes a new baseline for BTC demand, but also suggests that the upcoming halving may have a unique impact on the market, different from previous cycles. Given these changes, understanding the current technical supply and demand situation is critical to understanding the potential scenario for Bitcoin after the halving.
Supply constraints and market capacity
While the decline in new Bitcoin supply is a key factor to consider, it is only one of many factors that influence the value of the cryptocurrency. The supply of Bitcoin available for trading (i.e., the difference between circulating and non-circulating supply) has been declining since the beginning of 2020, indicating a significant change from previous cycles. However, recent data shows that since the beginning of the fourth quarter of 2023, the active BTC supply (Bitcoins that have moved in the past three months) has increased by 1.3 million, while newly mined Bitcoins have only increased by about 150,000 in the same period. Despite the market's increased ability to absorb this supply, Volcano X advises against oversimplifying the complex interplay of market dynamics.
Background and Future Outlook
Bitcoin halving occurs approximately every four years, or every 210,000 blocks mined, effectively reducing the rewards for miners and, therefore, the daily issuance of new Bitcoins. After the halving, daily Bitcoin production is expected to drop from about 900 to 450, with annual inflation adjusted from 1.8% to 0.9%. These adjustments bring monthly Bitcoin production to about 13,500 and annual production to about 164,250, although these figures are 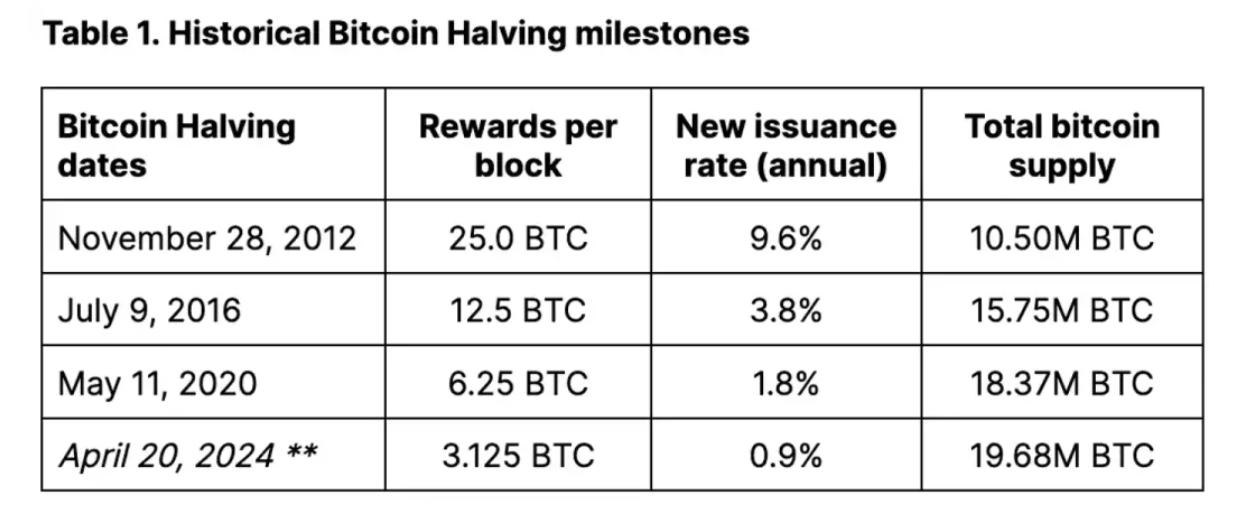 Will be affected by changes in actual hash rate.
The halving mechanism embedded in the Bitcoin protocol will continue until all 21 million Bitcoins are mined, an event expected to occur around 2140. Volcano X believes that the potential significance of the halving lies not only in its direct market impact, but also in its ability to attract significant media attention to Bitcoin's unique properties: a fixed, deflationary supply schedule that ultimately leads to a hard cap on supply. This aspect of Bitcoin is often underestimated.
For tangible commodities, such as minerals, additional resources can theoretically be invested to mine and extract more of a resource, such as gold or copper. Although barriers to entry may be high, price increases can incentivize meeting demand. However, due to Bitcoin's preset block reward and difficulty adjustment mechanism, its supply remains inelastic (i.e., unresponsive to price changes). In addition, Bitcoin encapsulates a growth narrative. The utility of the Bitcoin network expands with the number of users on the network, directly affecting the value of the token. This is in stark contrast to precious metals such as gold, which do not have similar growth expectations.
History will not repeat itself, but...
Our analysis of Bitcoin’s halving cycles is inherently limited, as there have only been three previous occurrences. As such, studies of correlations between previous halvings and Bitcoin price should be treated with caution; sample sizes are small, making it challenging to model these events based on historical analysis alone. In fact, we believe that more halving cycles are needed to draw strong conclusions about how Bitcoin “usually” reacts to halvings. Furthermore, correlation does not imply causation, and factors including market sentiment, adoption trends, and macroeconomic conditions can all contribute to price volatility.
Indeed, our previous hypothesis that Bitcoin’s performance with respect to halving events depends on the context could explain the significant variation in price trajectories across different cycles. As shown in Figure 1, Bitcoin’s price remained relatively stable in the 60 days leading up to the first halving in November 2012, while it increased by approximately 45% and 73% over the same time period leading up to the second and third halvings in July 2016 and May 2020, respectively. This variability highlights the complex interplay of factors influencing Bitcoin’s price, suggesting that each halving cycle unfolds within its own unique contextual framework.
In our analysis, the beneficial effects of the first halving did not fully materialize until January 2013, when the impact of the Federal Reserve’s quantitative easing program (QE3) intersected with concerns about the U.S. debt ceiling crisis. Therefore, we believe that increased media coverage of the halving could increase public awareness of Bitcoin as an alternative store of value amid widespread inflation concerns. In contrast, in 2016, Brexit may have triggered financial anxiety in the UK and Europe, potentially catalyzing Bitcoin buying behavior. This trend continued until the ICO boom in 2017. In early 2020, central banks and governments around the world began to support halving.  Unprecedented stimulus measures in response to the COVID-19 pandemic have again significantly increased Bitcoin’s liquidity.
It is also important to note that analysis of historical performance can vary significantly depending on the observation period relative to the halving event. Price return metrics may differ whether the analysis looks at a 30, 60, 90, or 120 day period from the halving date. Therefore, employing different windows may affect the conclusions drawn from past price performance. For our purposes, we use a 60 day time frame as it helps filter out short term noise while staying close enough to the halving so that other market factors may begin to dominate price drivers in the long term.
ETFs: The key to success
The launch of spot Bitcoin ETFs in the United States is reshaping Bitcoin's market dynamics by establishing a new benchmark for Bitcoin demand. In previous cycles, liquidity was a key barrier to price momentum as major market participants (including but not limited to Bitcoin miners) would drive sell-offs in an attempt to exit long positions. The advent of spot Bitcoin ETFs fundamentally changes this dynamic, providing both institutional and retail investors with a more structured and accessible way to participate in Bitcoin.
By acting as a bridge between the worlds of traditional finance and cryptocurrencies, these ETFs alleviate some of the liquidity issues previously seen and broaden the investor base. This diversification of market participation not only enhances liquidity, but also has the potential to stabilize price volatility associated with large sell-offs. Additionally, the institutional support implied by ETF issuance confers a degree of legitimacy on Bitcoin, encouraging further adoption.
In summary, the evolving environment marked by macroeconomic factors, emerging investment vehicles such as ETFs, and shifting market sentiment plays a crucial role in shaping Bitcoin's post-halving journey. While history provides valuable insights, the unique confluence of conditions surrounding each halving event means that future outcomes cannot be predicted based solely on past trends. Therefore, stakeholders should combine historical knowledge and attention to current developments to approach the market.

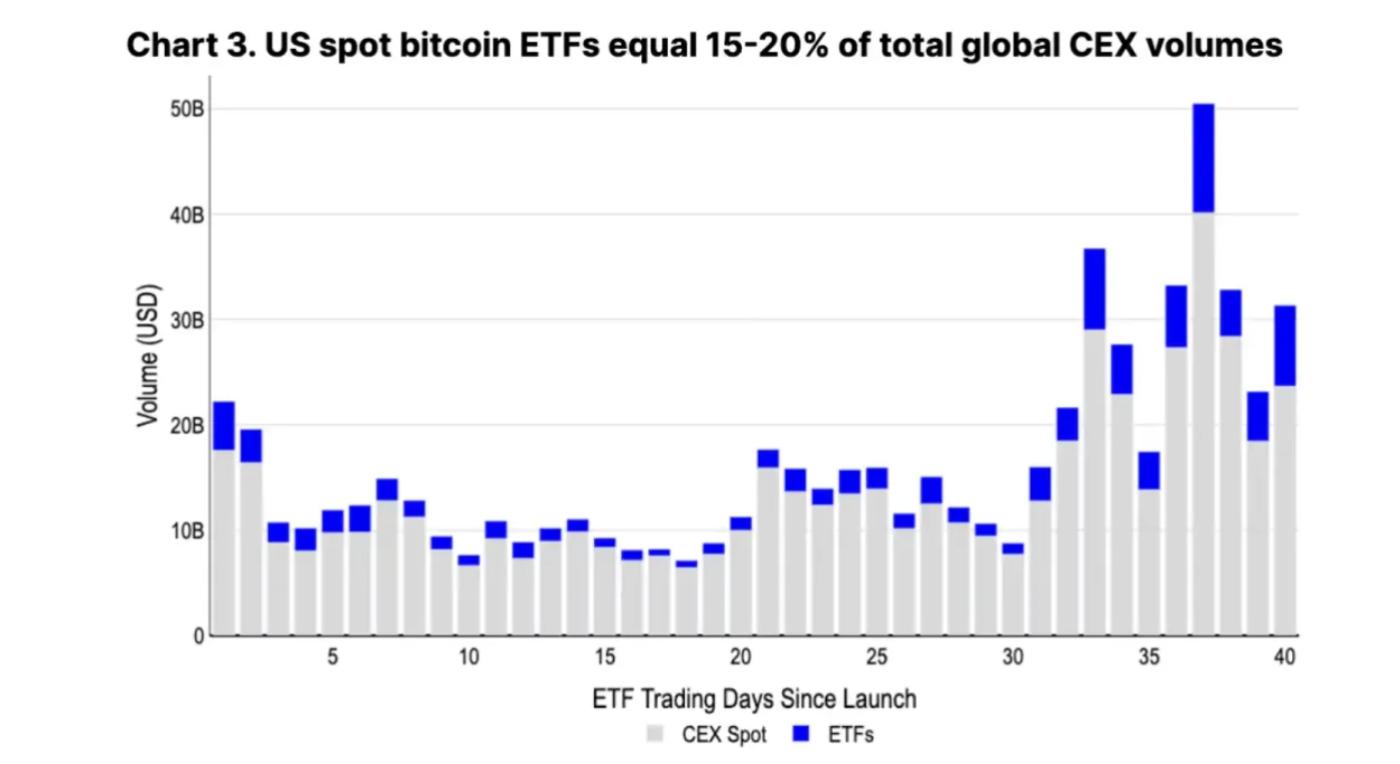
Today, inflows into ETFs are expected to absorb a significant portion of the supply in a gradual and sustained manner. Currently, the average daily spot trading volume of BTC in ETFs is estimated to be between $4-5 billion, accounting for 15-20% of the total trading volume on centralized exchanges worldwide. This level of liquidity is sufficient for institutions to easily execute trades within the space. In the long run, this steady demand could have a positive impact on the price of Bitcoin as it could promote a more balanced market and reduce volatility from concentrated sell-offs.
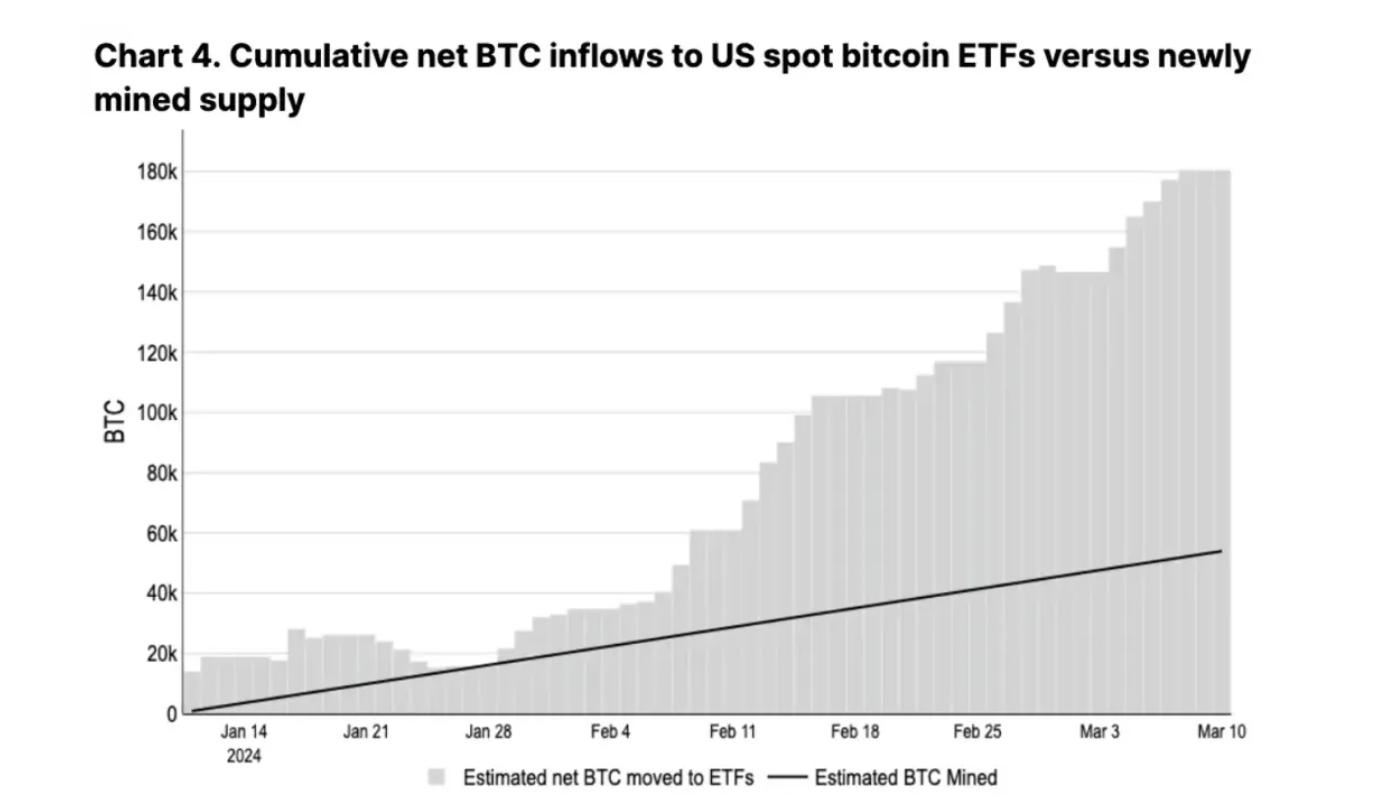
In the first two months after their launch, U.S. spot Bitcoin ETFs attracted $9.6 billion in net inflows, bringing total assets under management to $55 billion. This development shows that the cumulative net growth of BTC held by these ETFs (180,000 coins) during this period was almost three times the 55,000 new Bitcoin supply produced by miners (as shown in Figure 3). Looking at the total of all spot Bitcoin ETFs worldwide, these regulated investment vehicles currently hold about 1.1 million Bitcoins, accounting for 5.8% of the total circulating supply, according to Bloomberg.
In the medium term, we may see ETFs maintain or even increase their current liquidity levels as major broker-dealers have yet to start offering these products to clients. With over $6 trillion still sitting in US money market funds and expectations of upcoming rate cuts, we believe there will be a significant amount of idle capital flowing into this asset class during the year.
It is worth mentioning that potential concerns about the centralization of Bitcoin holdings due to ETFs do not pose a stability risk to the network, as simply owning Bitcoin does not affect the decentralized network or allow control of its nodes. In addition, financial institutions are currently unable to offer derivatives based on these ETFs as underlying assets. The availability of such derivatives could change the market structure for large players. However, regulatory approval for these derivatives may still take several months, conservatively estimated.
This development highlights a significant shift in institutional participation in the cryptocurrency space, driven in part by the ETF vehicle. As the landscape evolves, the integration of traditional financial products with digital assets like Bitcoin not only expands accessibility, but also introduces new dynamics in terms of market liquidity, investor base expansion, and potentially mitigating price volatility. Continuously adapting the regulatory framework to accommodate these innovations will be critical to shaping the future trajectory of Bitcoin and its integration into the broader financial ecosystem.
Assuming that the rate of new capital inflows into U.S. ETFs slows from $6 billion in February to a steady state of net inflows of $1 billion per month, a basic mental model suggests that the average price of Bitcoin should be around $74,000 relative to the approximately 13,500 BTC mined per month after the halving. However, a significant limitation of this model is the assumption that miners are the only source of Bitcoin supply on the market. In reality, the imbalance between newly mined Bitcoin and ETF inflows represents only a small part of the long-term cyclical supply trend.
Damn the lies and the statistics
One way to measure Bitcoin’s available transaction supply is to subtract (1) the current circulating supply (19.65 million BTC) from (2) the illiquid supply, which includes Bitcoin that has essentially ceased to circulate due to being lost in wallets, held for a long time, or otherwise locked up. According to data from Glassnode, which categorizes illiquid supply based on cumulative inflows and outflows over the entity’s lifetime, the available Bitcoin supply has been trending downward over the past four years, from a peak of 5.3 million BTC in early 2020 to 4.6 million currently. This is a significant shift from the steady increase in available supply observed around the first three halvings (as shown in Figure 5).
The reduction in liquid supply amid growing institutional interest, particularly through ETFs, highlights a fundamental shift toward a more illiquid market state. As illiquid supply increases — whether through long-term holding strategies, loss of access, or institutional acquisitions — the available supply of Bitcoin contracts, potentially exerting upward pressure on prices in the event of stable or increasing demand.
This dynamic highlights the complex interplay between supply and demand factors that influence Bitcoin’s price. While miners do add new Bitcoin to the ecosystem, the broader context includes changes in liquid vs. illiquid supply, institutional adoption rates, and macroeconomic trends. All of these factors help shape the market environment for cryptocurrencies, further complicating simple price prediction models based solely on supply-side considerations. 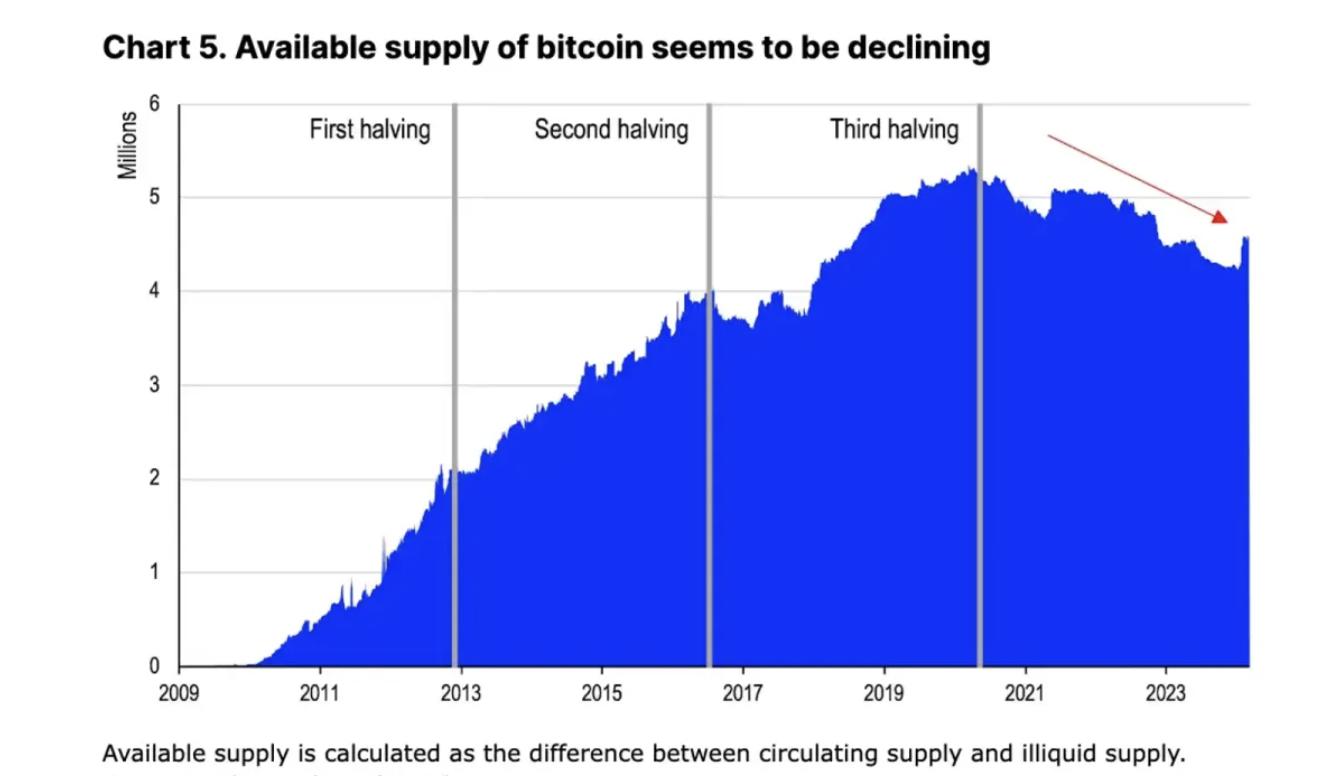
At first glance, the decline in Bitcoin trading availability due to new institutional demand for ETFs appears to be one of the main technical supports for Bitcoin's performance. However, given the impending decrease in new Bitcoin entering circulation, these supply and demand dynamics suggest potential short-term market tightening. That said, we believe this framework does not fully capture the complexity of Bitcoin market liquidity dynamics, especially since "illiquid supply" is not equivalent to static supply.
Investors should not ignore several key factors that could influence selling pressure:
- Not all Bitcoin in the liquidity gap is “trapped.” Long-term holders (those who have held Bitcoin for more than 155 days, or 83.5% of holdings) may be less economically sensitive to their positions than short-term holders. However, we expect that some in this group may still choose to realize profits as prices rise.
- Some holders may not plan to sell in the near future, but can still provide liquidity by using their Bitcoin as collateral. This also affects the "illiquidity" characteristics of these Bitcoins to a certain extent.
- Miners may sell their Bitcoin reserves (currently 1.8 million BTC in total among public and private miners) to expand their operations or cover other costs.
- The approximately 3 million BTC held by short-term holders is not insignificant. In the midst of price fluctuations, speculators may still exit to take profits.
Ignoring these important sources of supply oversimplifies the argument that inevitable scarcity is due to decreasing mining rewards and steady ETF demand. We believe a more comprehensive assessment is needed to determine the true supply and demand dynamics behind the upcoming halving event.
Active provisioning and flow
Even with Bitcoin included in the ETF, the growth rate of active circulating supply (defined as Bitcoin transferred in the past 3 months) has greatly exceeded the cumulative inflow rate of the ETF (as shown in Figure 6). Since the fourth quarter of 2023, the active BTC supply has increased by 1.3 million, while newly mined Bitcoins account for only about 150,000.
The increase in active supply suggests that despite Bitcoin being absorbed into ETFs and other long-term holding strategies, a large amount of Bitcoin remains liquid and part of an active trading cycle. The dynamic nature of Bitcoin liquidity highlights the need for a nuanced understanding of the supply side of the market and how various factors, from miner behavior to investor sentiment, influence the overall liquidity landscape.
In addition, the ever-changing nature of Bitcoin liquidity, influenced by macroeconomic factors, technological advances, and regulatory changes, will continue to influence its market dynamics. Therefore, stakeholders must remain vigilant and adjust their strategies to cope with expected and unforeseen changes in this complex ecosystem. 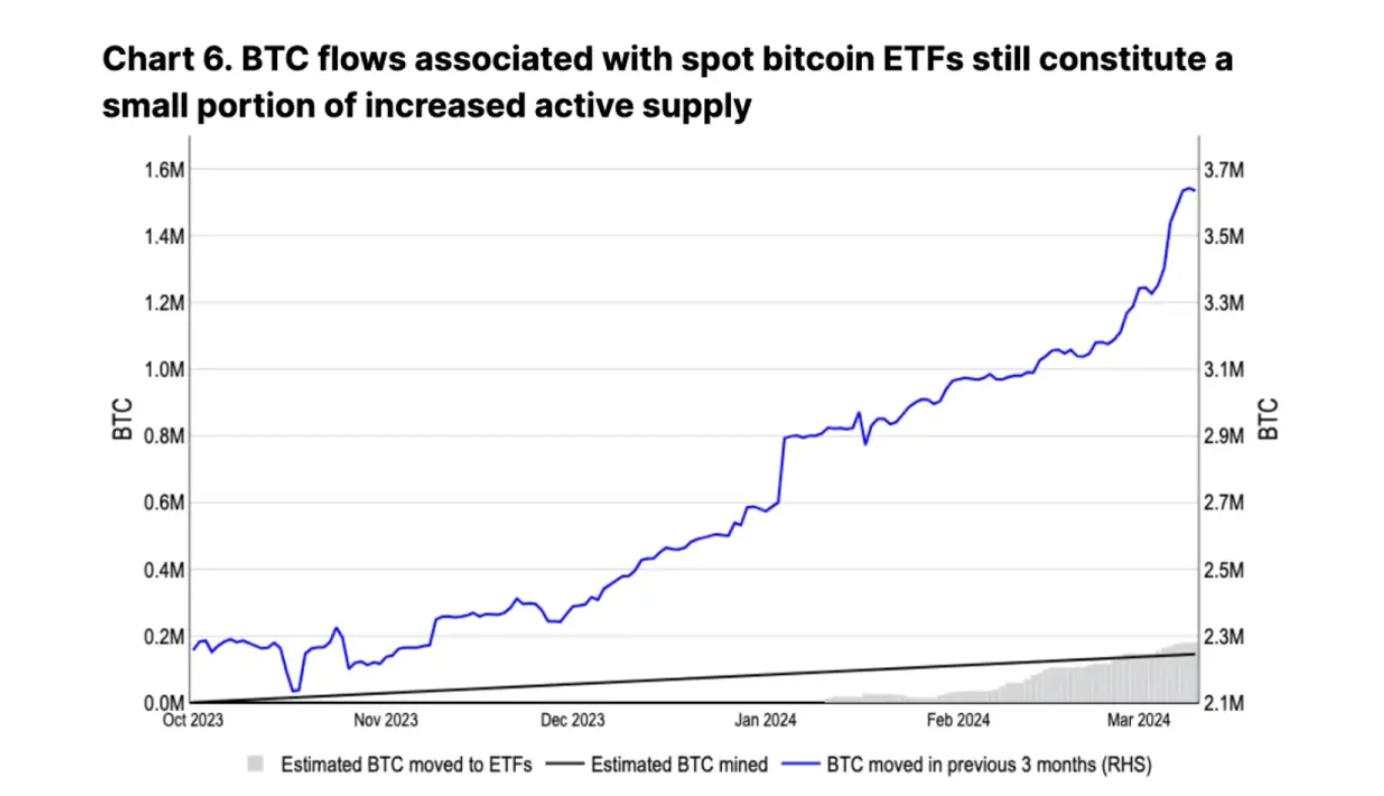
A portion of active supply does come from miners themselves, who may sell reserves to take advantage of price trends and build liquidity in the face of reduced revenues - we discuss this in more depth in our report Bitcoin Halving and Miner Economics published on January 30. This practice by miners mirrors their behavior in previous cycles. However, Glassnode reports that miners’ net wallet balances decreased by only 20,471 BTC between October 1, 2023 and March 11, 2024, suggesting that new active supply is primarily coming from sources other than miners.
In previous cycles, the change in active supply exceeded the growth rate of newly mined Bitcoin by more than five times. In the 2017 and 2021 cycles, active supply nearly doubled, increasing by 3.2 million in 11 months (from a low to 6.1 million) and 2.3 million in 7 months (from 3.1 million to 5.4 million). In comparison, the number of Bitcoins mined during the same periods was approximately 600,000 and 200,000, respectively.
At the same time, in this cycle, Bitcoin's inactive supply (defined as Bitcoin unchanged for more than a year) has also fallen for three consecutive months, which may mean that long-term holders are starting to sell (as shown in Figure 7). Under normal circumstances, this would be interpreted as a mid-cycle signal. In the 2017 and 2021 cycles, the time span from the peak inactive supply to the highest price in the cycle was about 12 months and 13 months, respectively. The peak of inactive Bitcoin in the current cycle seems to be reached in December 2023.
The potential increase in market activity from long-term holders and miners, coupled with the dynamic influx of institutional demand through ETFs, highlights the multifaceted nature of the Bitcoin supply and demand equation. The interplay between active and inactive supply provides valuable insights into market sentiment and potential future price action.
Given these observations, stakeholders in the Bitcoin ecosystem should pay close attention to these supply dynamics as they can provide early signals about changes in market direction. In addition, understanding the behavior of different market participants (including miners, long-term holders, and institutional investors) can help make informed decisions in this complex and evolving environment. 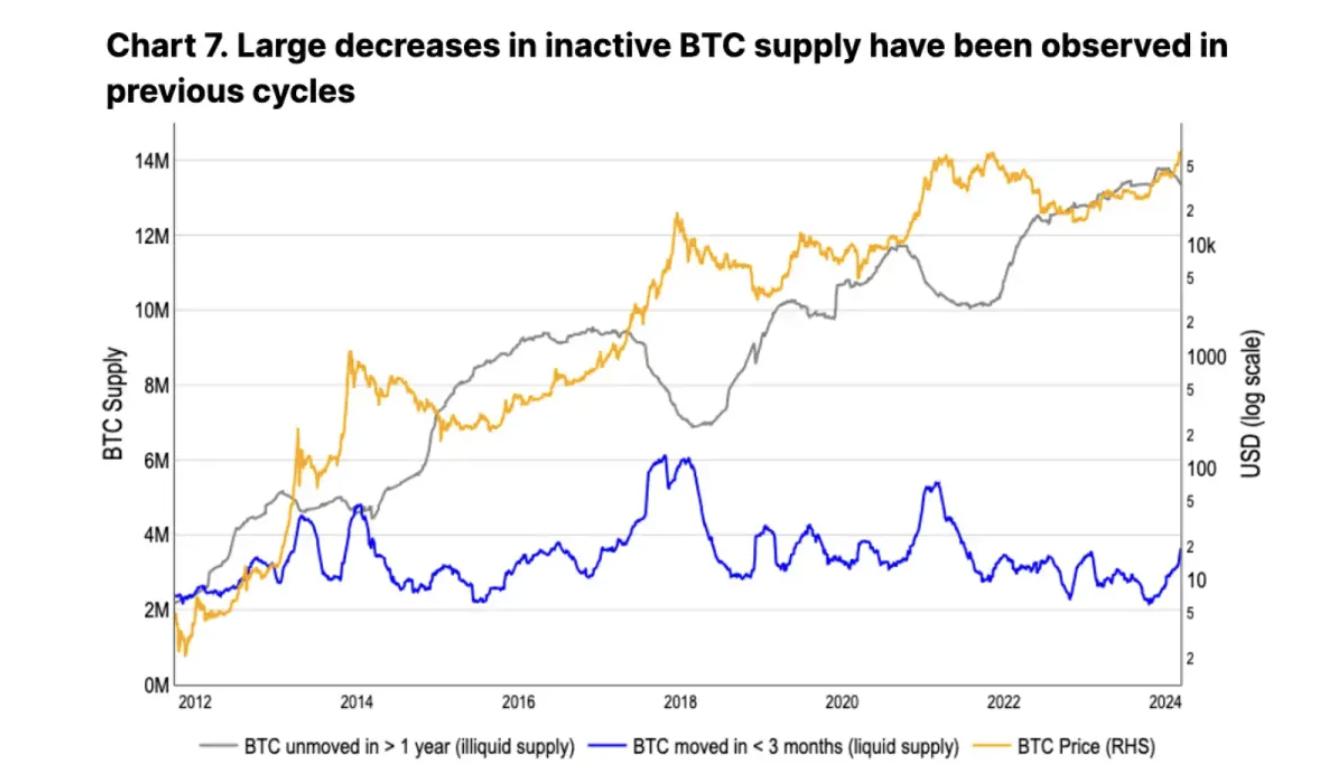
in conclusion
As we at Volcano X analyze the evolving landscape of Bitcoin and its integration into mainstream financial instruments, it is clear that this cycle offers unique dynamics compared to previous cycles. The introduction of a US spot Bitcoin ETF and continued daily net inflows represents a significant tailwind, signaling a notable shift toward broad institutional acceptance and investment in digital assets.
Given the upcoming reduction in the supply of new Bitcoins due to the halving event, we observe a tightening of market dynamics that could alter the traditional supply-demand balance. While some may speculate that we are entering a supply crunch, our analysis suggests that demand and selling pressure will need to find a new balance going forward.
The role of spot Bitcoin ETFs cannot be overstated. As a new asset class, these ETFs bridge the gap between traditional investment strategies and the digital asset space, marking a critical moment in Bitcoin's mainstream adoption. This development not only enhances Bitcoin's liquidity and stability as an investable asset, but also opens up a way for traditional investors to participate in the cryptocurrency market within a regulated framework.
Furthermore, our research shows that the narrative surrounding Bitcoin’s liquidity and supply dynamics is far more complex than it might appear at first glance. The interplay between dormant supply becoming active, miner behavior, and the impact of derivatives amplifying spot market activity highlights the multifaceted nature of the Bitcoin market ecosystem.
Given these insights, Volcano X remains cautiously optimistic about Bitcoin's prospects. We assert that while there are immediate supply-demand related hurdles, fundamental shifts taking place - primarily the institutionalization of Bitcoin via ETFs - bode well for its long-term trajectory. As such, we believe that current trends suggest that a potentially long-term bull market phase has only just begun, requiring ongoing adjustments to market dynamics to promote a sustainable balance between supply and demand.
In conclusion, Volcano X will continue to monitor these developments closely as part of our commitment to provide forward-looking analysis to our clients and partners. Our goal is to strategically navigate these changes, ensuring we are well-positioned to take advantage of opportunities that arise as Bitcoin further solidifies its place in the global financial landscape.
Disclaimer : This document is for reference and communication purposes only and does not constitute investment advice.
Image Source:


