

A. Market View
 1. Macro liquidity
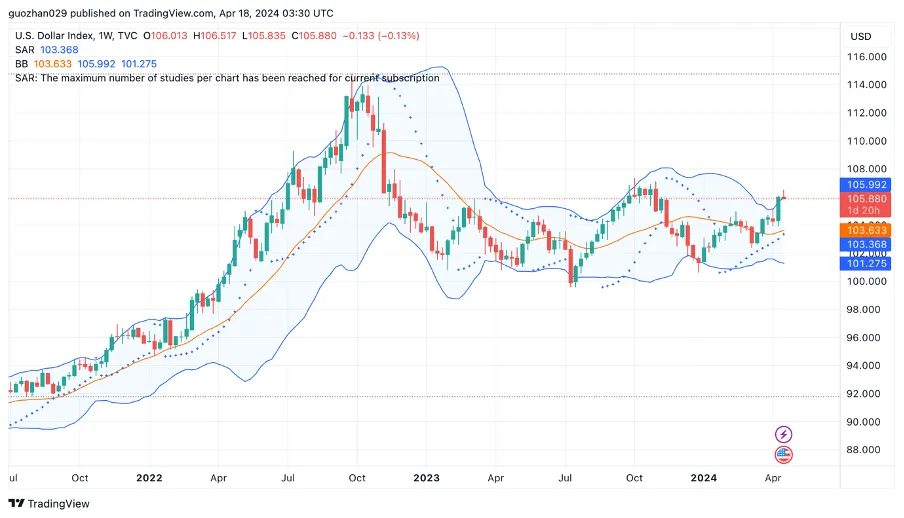
Monetary liquidity improved. U.S. retail data for March exceeded expectations, and Powell's hawkish speech further dampened expectations of rate cuts. The dot plot shows that the Fed expects three 25 basis point rate cuts this year, but investors now expect only one or two rate cuts. In January this year, they expected six rate cuts. The risks of the situation in the Middle East have eased. The U.S. dollar index hit a six-month high, and U.S. stocks fell sharply. The crypto market followed the adjustment of U.S. stocks.
 2. Market conditions
The top 100 companies with the highest market capitalization:
BTC fell weakly this week, and BTC dominance rose to a 4-year high. The exchange rate of altcoins began to deviate from BTC. The market focus is on BTC rune ecology and football fan coins. The rune protocol will be launched on the weekend halving block. It is recommended to prepare your wallet for runes in advance. The biggest difference between runes and inscriptions is that they attract more US funds.
1. TAO: TAO is listed on Binance. TAO is a POW AI machine learning training with a similar architecture to Polkadot and an economic model similar to BTC. 2. OMNI: OMNI is listed on Binance. OMNI focuses on cross-chain information transmission between ETH L2 and uses modularization to solve the L2 fragmentation problem. ZETA in the same track has a market value of 2.5 billion US dollars. 3. MERLIN: MERLIN is listed on OK Exchange. The public chain MERLIN is BTC's EVM L2, and 20% of the airdrop will be unlocked in the next six months. STX in the same track has a market value of 4 billion US dollars, and CKB has a market value of 1 billion US dollars.
 3. BTC market
1) On-chain data
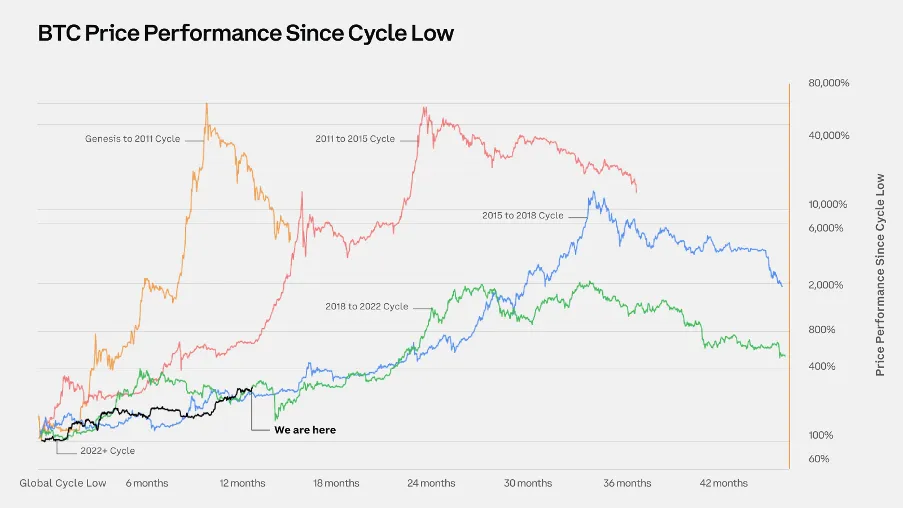
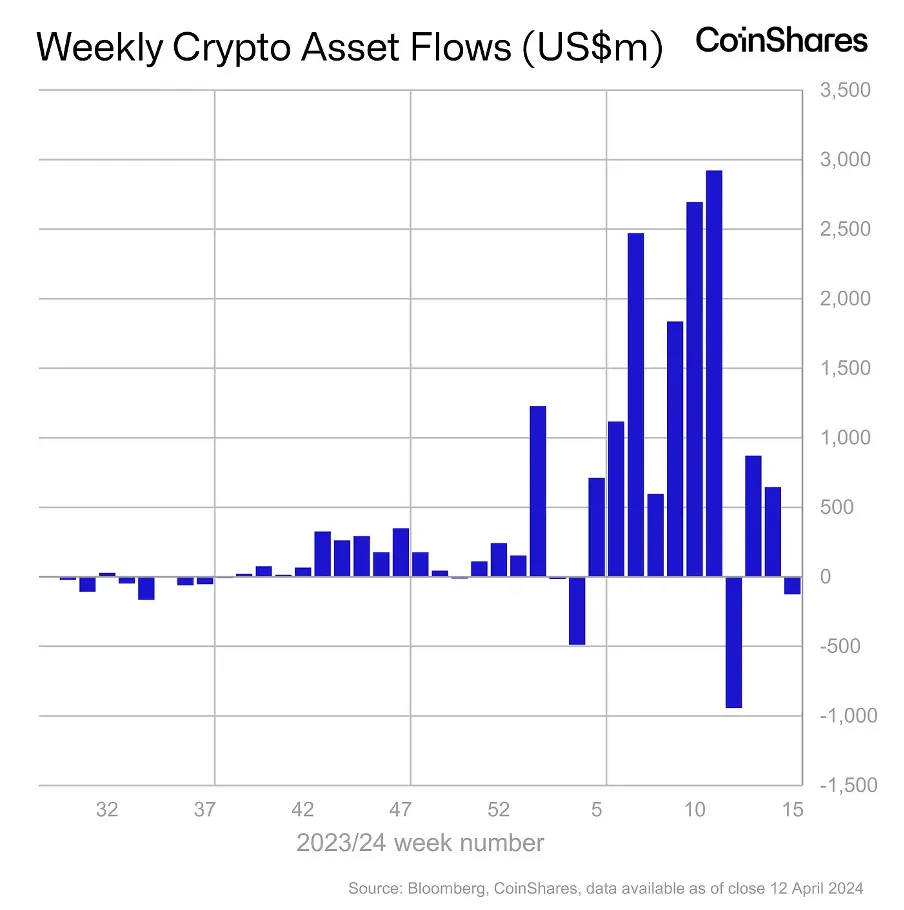
Can BTC's cyclical pattern continue? The last two bull runs lasted 3.5 years; the current one is 1.5 years old. The price increased 113x and 19x in the past cycles, respectively, while the price has only increased 4x so far in this cycle. Spot ETF inflows brought in $12 billion in new capital. ETF holdings of BTC are estimated to be worth $60 billion and have become one of the most important drivers of the market.
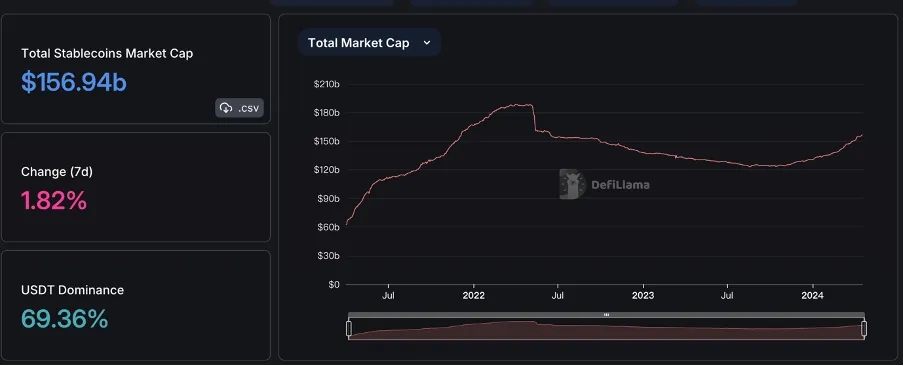
The market value of stablecoins increased by 2%, and the long-term funding fundamentals remain positive.
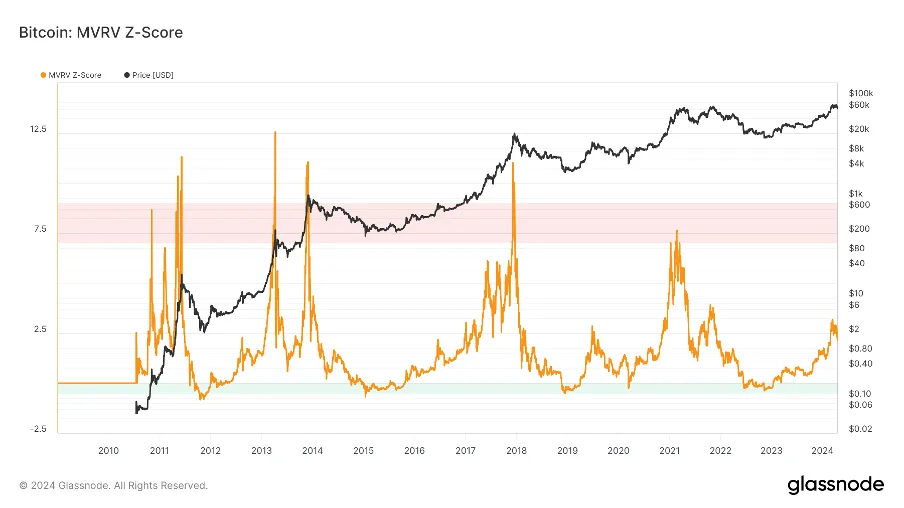
The long-term trend indicator MVRV-ZScore is based on the total market cost and reflects the overall profitability of the market. When the indicator is greater than 6, it is the top range; when the indicator is less than 2, it is the bottom range. MVRV falls below the key level of 1, and the holders are generally in a loss state. The current indicator is 2.1, entering the middle stage.
Institutional funds began to flow out, and spot ETFs had net outflows for three consecutive days. Investor sentiment was hesitant.
2) Futures market
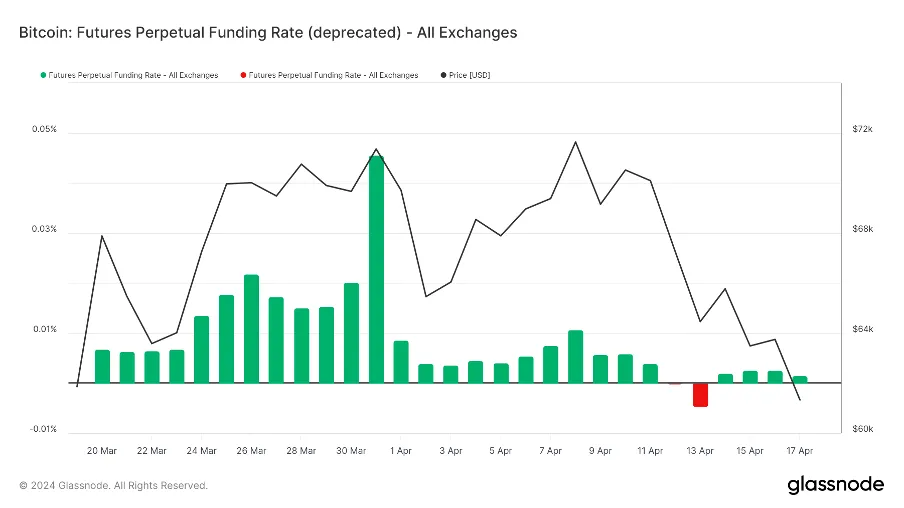
Futures funding rate: This week's rate is close to 0. The rate is 0.05-0.1%, with more long leverage, which is the short-term top of the market; the rate is -0.1-0%, with more short leverage, which is the short-term bottom of the market.
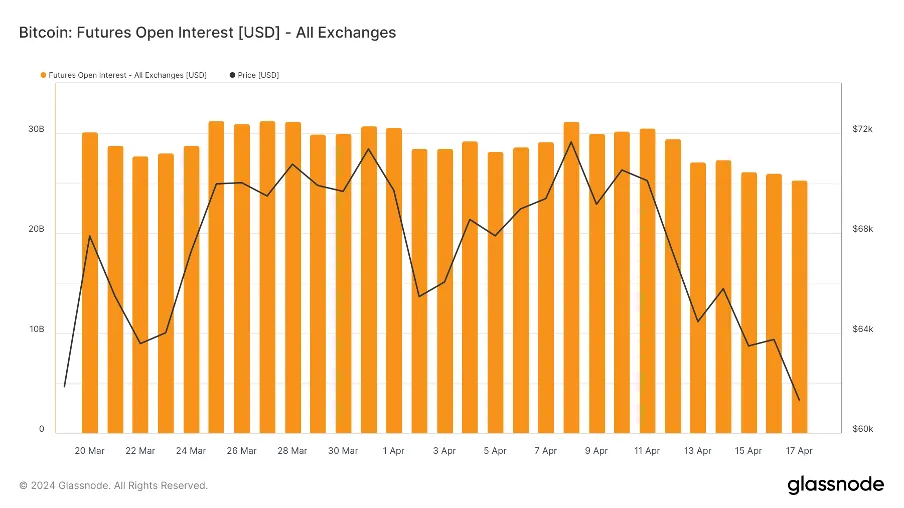
Futures open interest: BTC open interest dropped significantly this week, with major market players leaving the market.
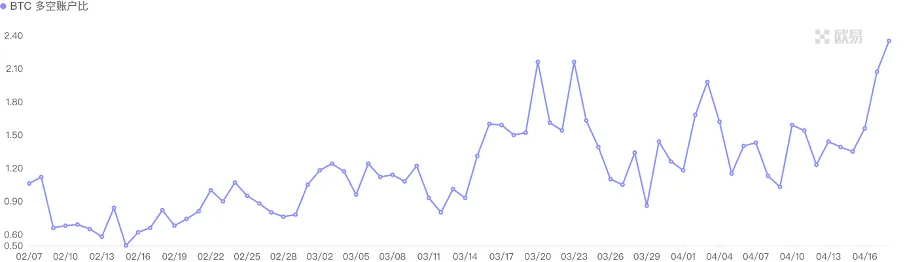
Futures long-short ratio: 2.4, market sentiment is still greedy. Retail investor sentiment is mostly a reverse indicator, below 0.7 is more panic, above 2.0 is more greedy. The long-short ratio data fluctuates greatly, and its reference value is weakened.
3) Spot market
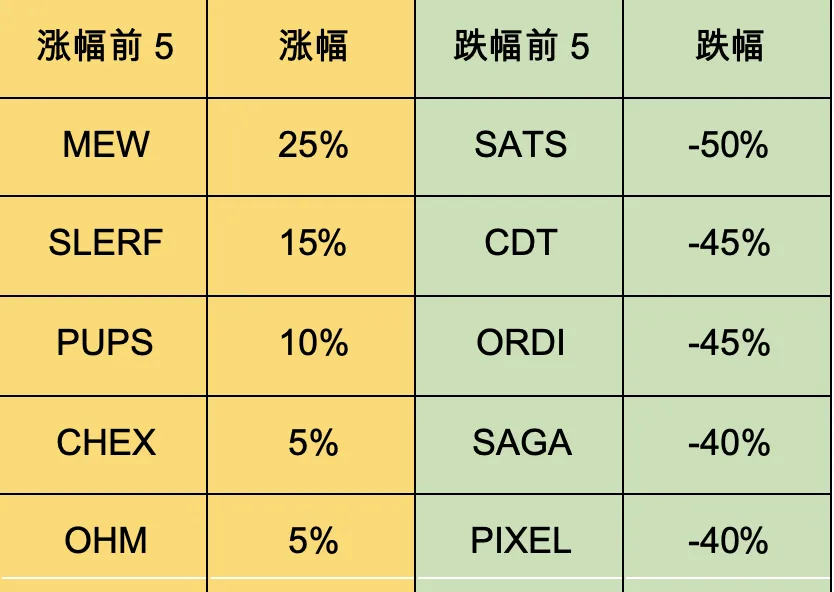
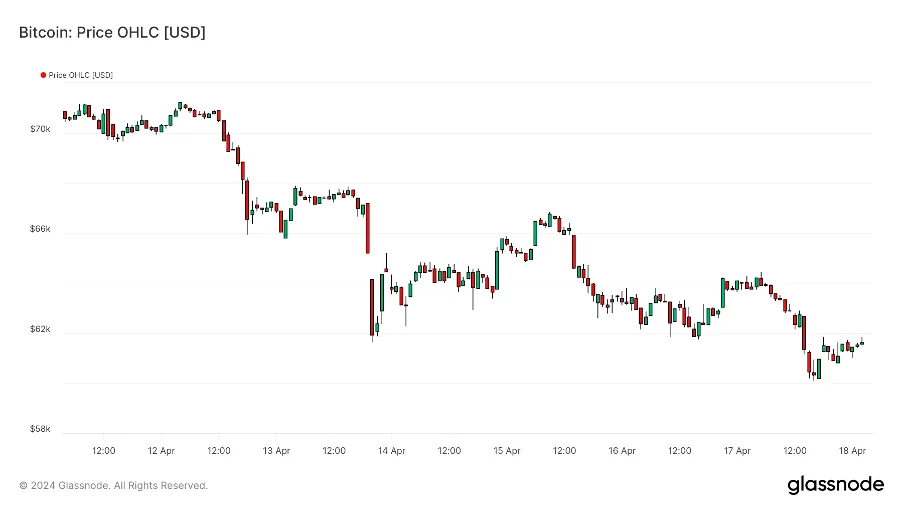
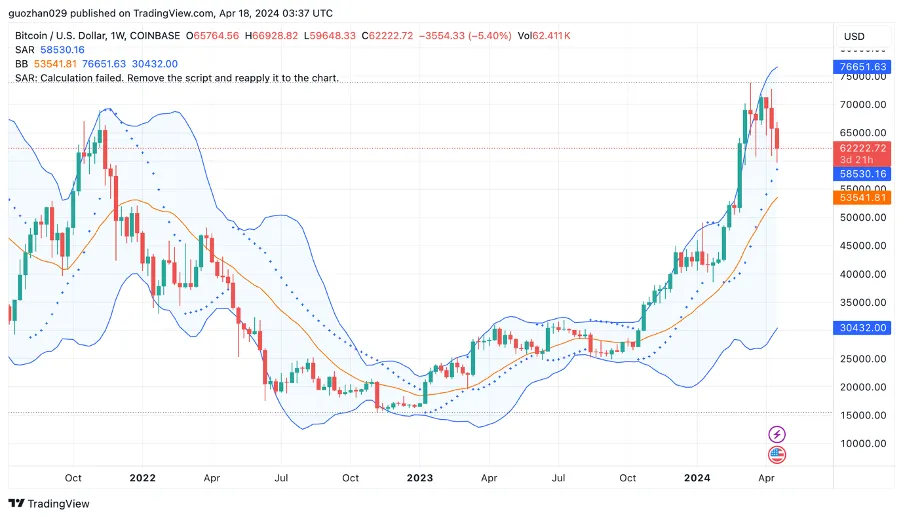
BTC continues to fall, and the halving has brought benefits. Now the lowest shutdown price for miners is $49,000. BTC is currently down 15% from the top, while many major Altcoin have fallen nearly 50% from the top. This is because ETFs bring permanent buying pressure, while Altcoin unlocking brings permanent selling pressure. It is likely that we will have to wait until the end of the year when the Federal Reserve officially cuts interest rates and market liquidity improves comprehensively before we can truly usher in a general rise in the market. Patience will eventually be rewarded.
B. Market Data
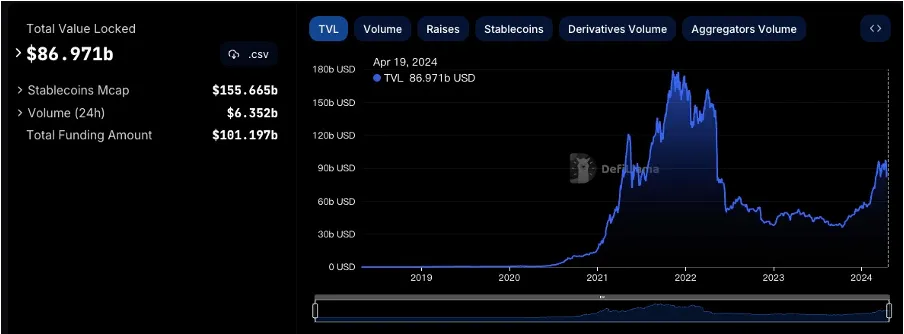
 1. Total locked-up amount of public chains
 2. TVL Proportion of Each Public Chain
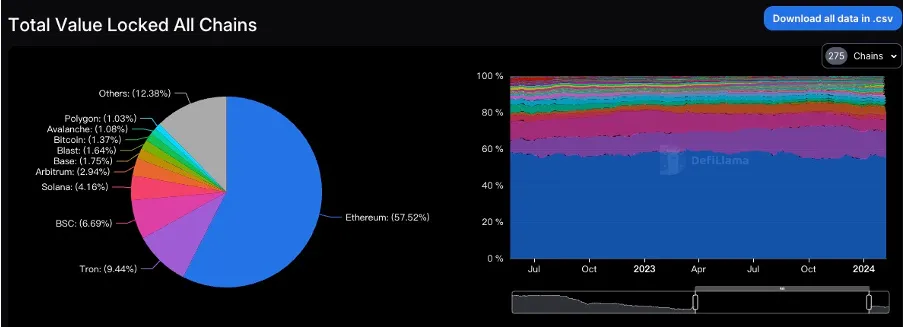
This week, the total TVL is around 87 billion US dollars, with an overall decline of 8.8 billion US dollars, a decline of 9.2%. This week, the TVL of the mainstream public chains almost all fell sharply. The ETH chain fell by 11%, the TRON chain fell by 16%, the SOLANA chain fell by 17%, the ARB chain fell by 15%, the BLAST chain fell by 19%, and the BTC and POLYGON chains both fell by 13%. After the OP chain fell by 15% this week, the TVL is less than 850 million US dollars and has fallen to the 12th position. In this market, the MERLIN chain, which stands out, soared by 103% this week and has accumulated a 2864% increase in the past month.
 3. Locked Amount of Each Chain Protocol
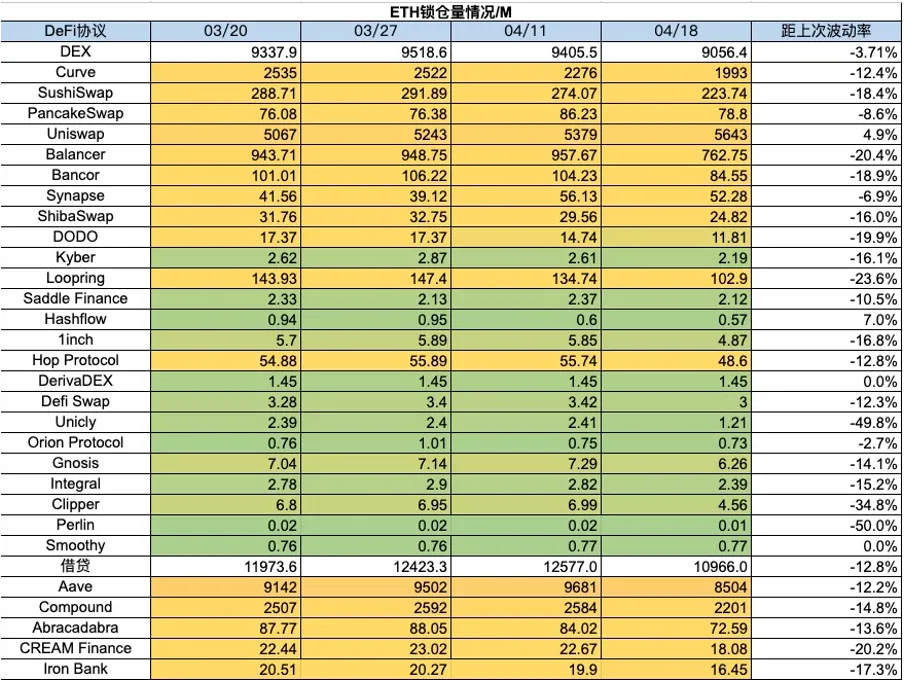
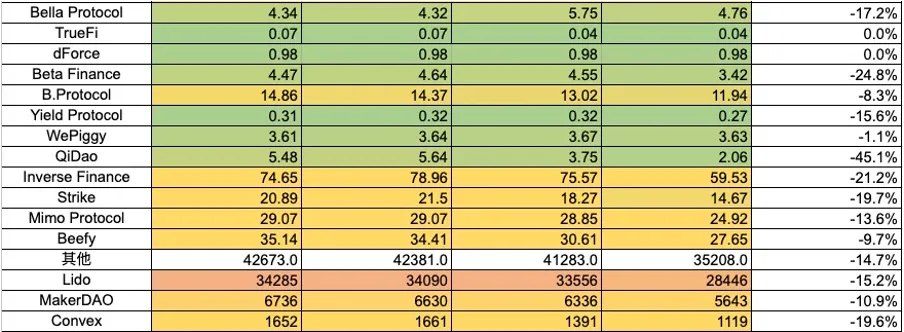
1) ETH locked amount
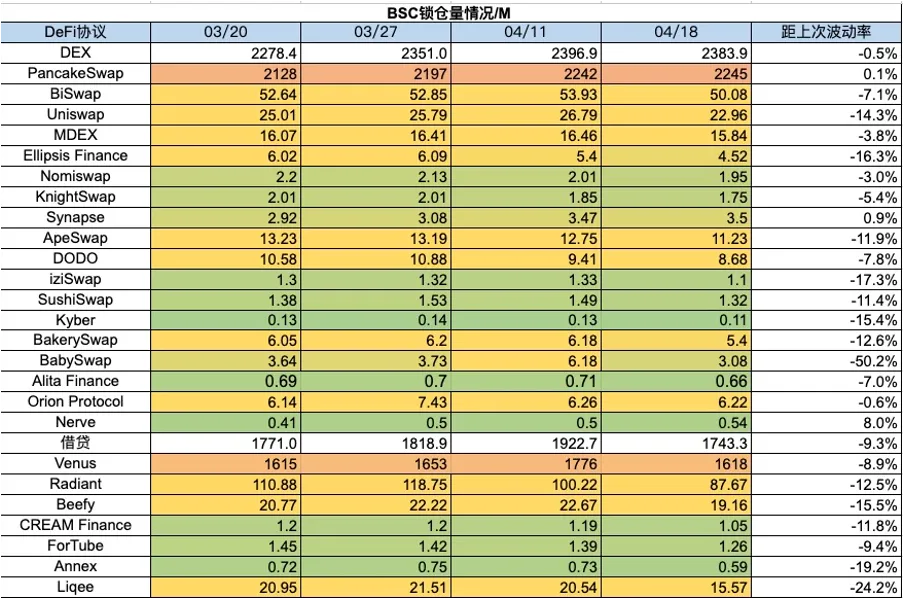
2) BSC locked amount
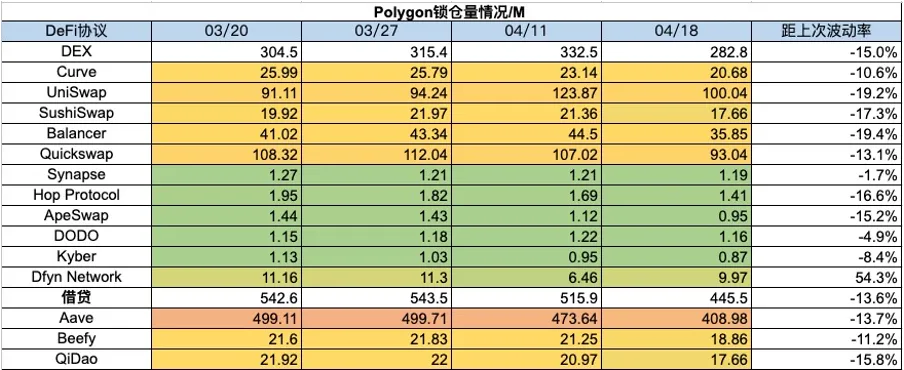
3) Polygon locked-up amount
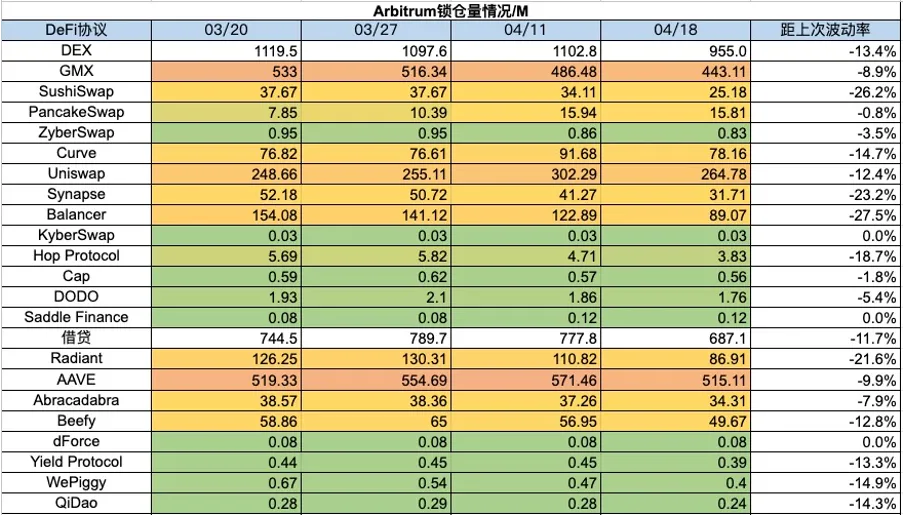
4) Arbitrum locked amount
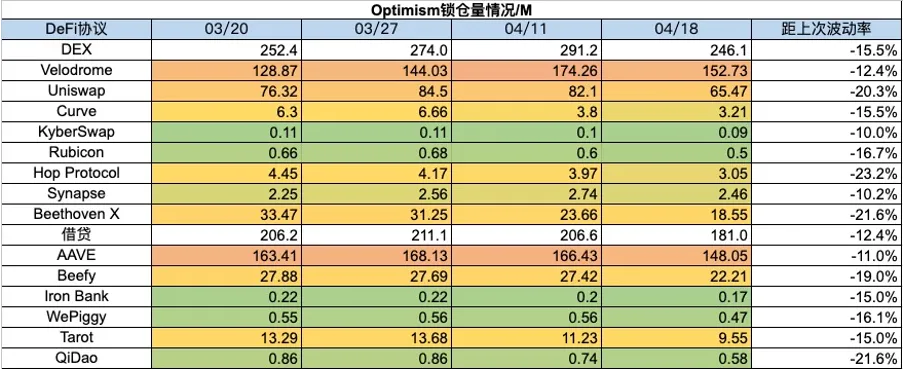
5) Optimism locked amount
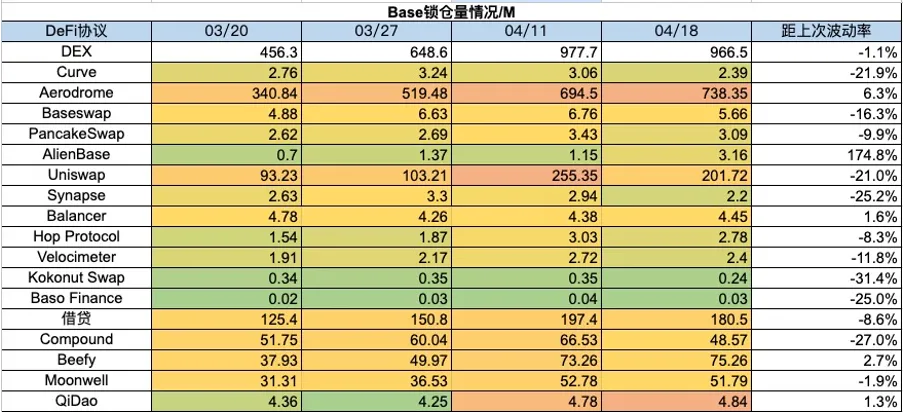
6) Base lock-up amount
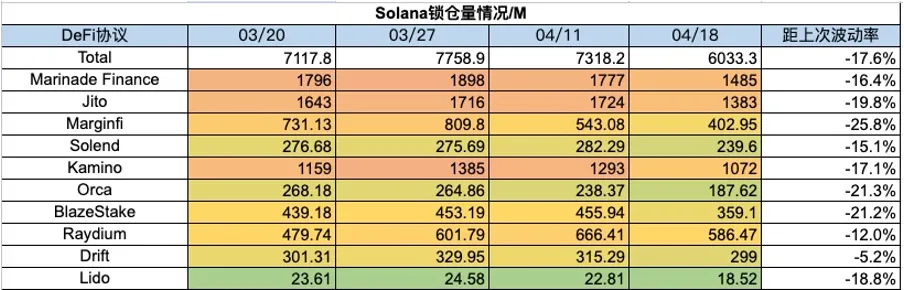
7) Solana locked amount
 4. Changes in NFT Market Data
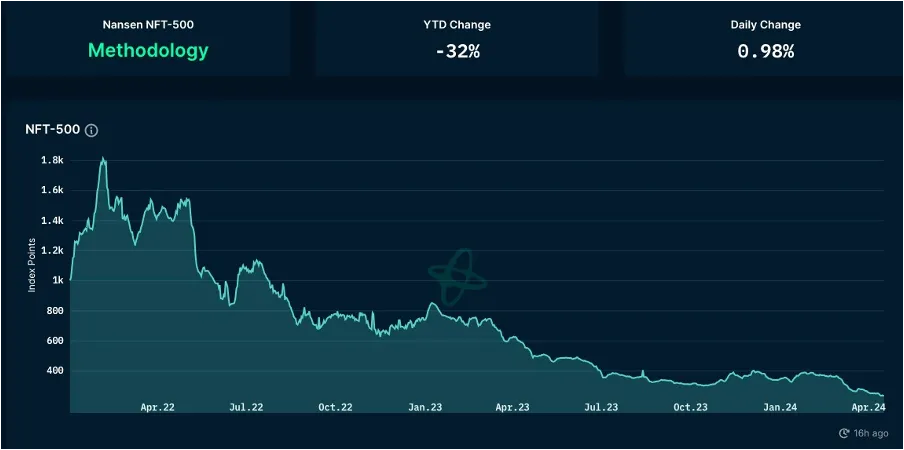
1) NFT-500 Index
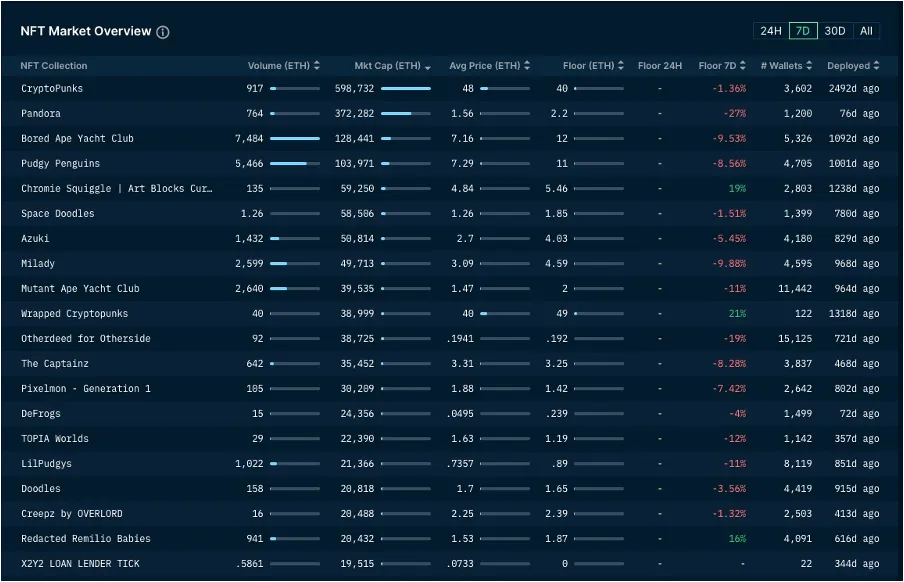
2) NFT market situation
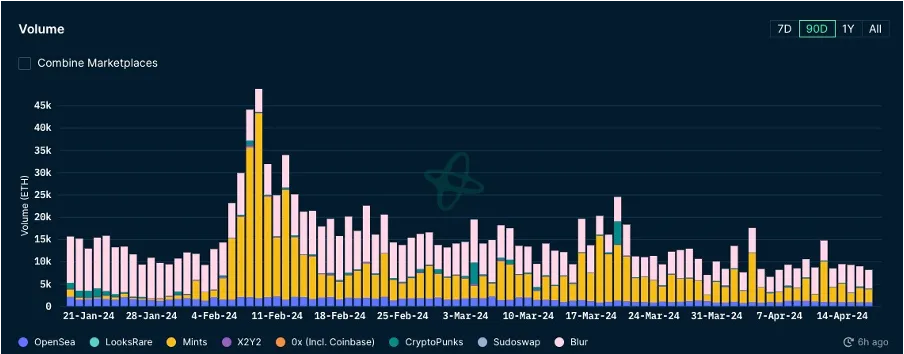
3) NFT trading market share
4) NFT Buyer Analysis
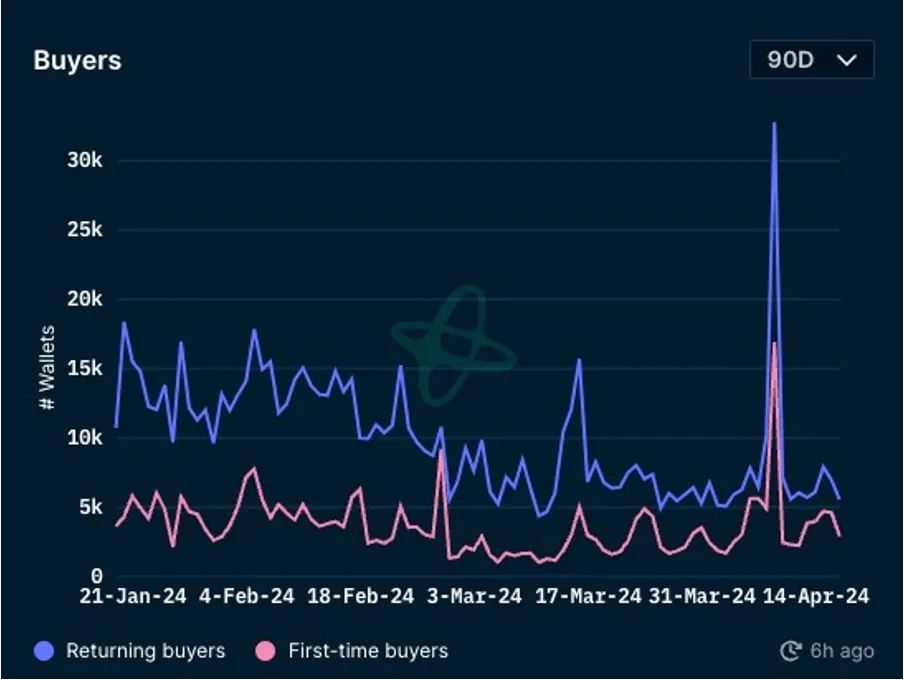
This week, the floor prices of blue-chip projects in the NFT market almost all fell, and the market maintained a stable downward trend. This week, BAYC fell 10%, MAYC fell 11%, Pudgy Penguins fell 9%, Lilpudgys fell 11%, Milady fell 10%, Azuki fell 5%, and Pandora fell 27%. The transaction volume in the NFT market is still declining, with a 30% drop compared to last month. BAYC still maintains the top position with a seven-day transaction volume of 7484 eth. The number of first-time and repeat buyers is still on a downward trend. Overall, the NFT market winter is longer than expected, and there is no sign of recovery yet.


