

Written by: THE ALTCOIN INVESTOR
Compiled by: TechFlow
Today I want to share 10 charts to help you navigate the cryptocurrency market today.
10 charts on the state of cryptocurrency
Glassnode and Coinbase have launched the Crypto Market Guide, a quarterly series designed to provide detailed analysis of major developments in the cryptocurrency market.
Here are 10 charts from the report that caught our attention:
1. Bitcoin dominance increased from 50% to 52%
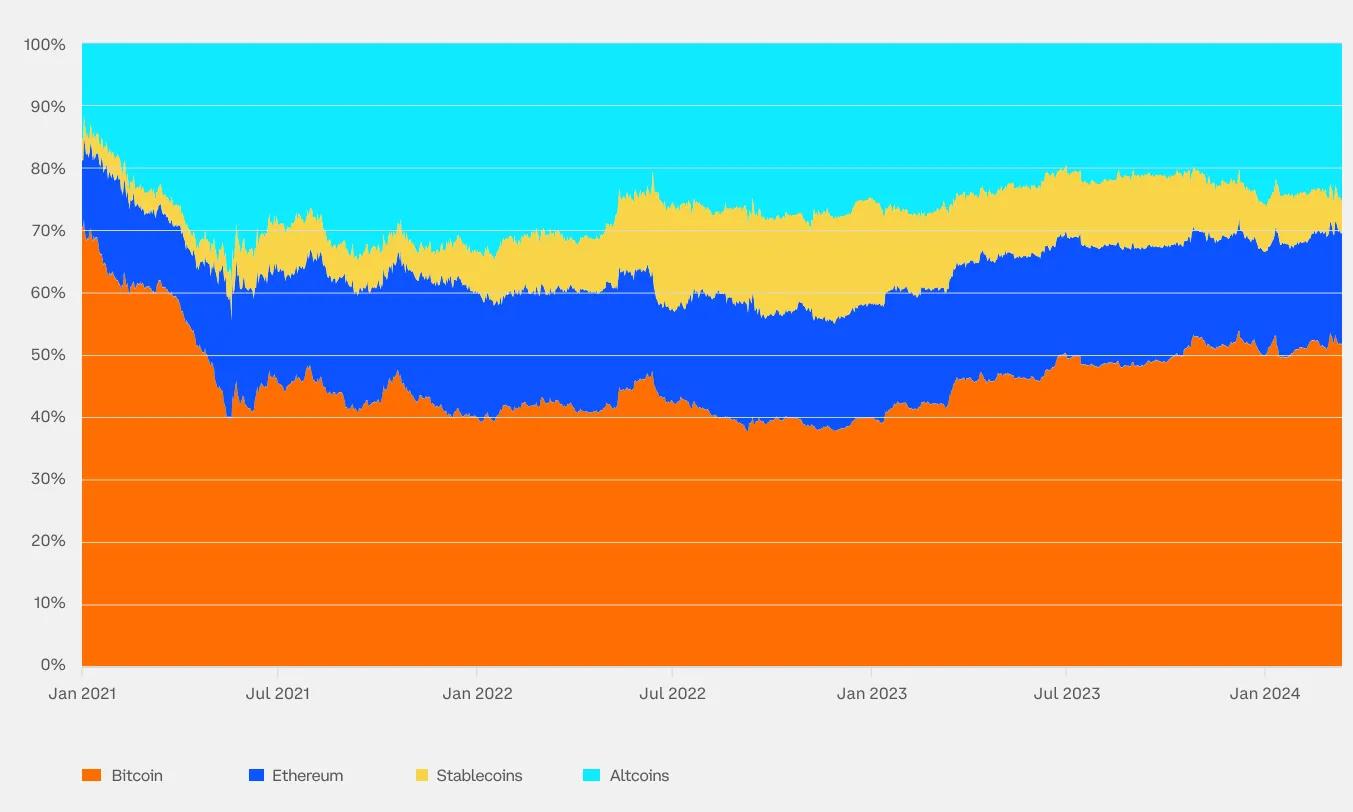
The alt season that is usually triggered by the halving would reduce Bitcoin’s dominance in favor of new Altcoin. This has not happened yet, so there is still a lot of room for growth.
2. Cryptocurrency Correlation
Cryptocurrency has historically had very low correlations with traditional asset classes, suggesting it can provide a meaningful source of idiosyncratic exposure in many different portfolios.
3. Stablecoin supply increased by more than 14% in the first quarter
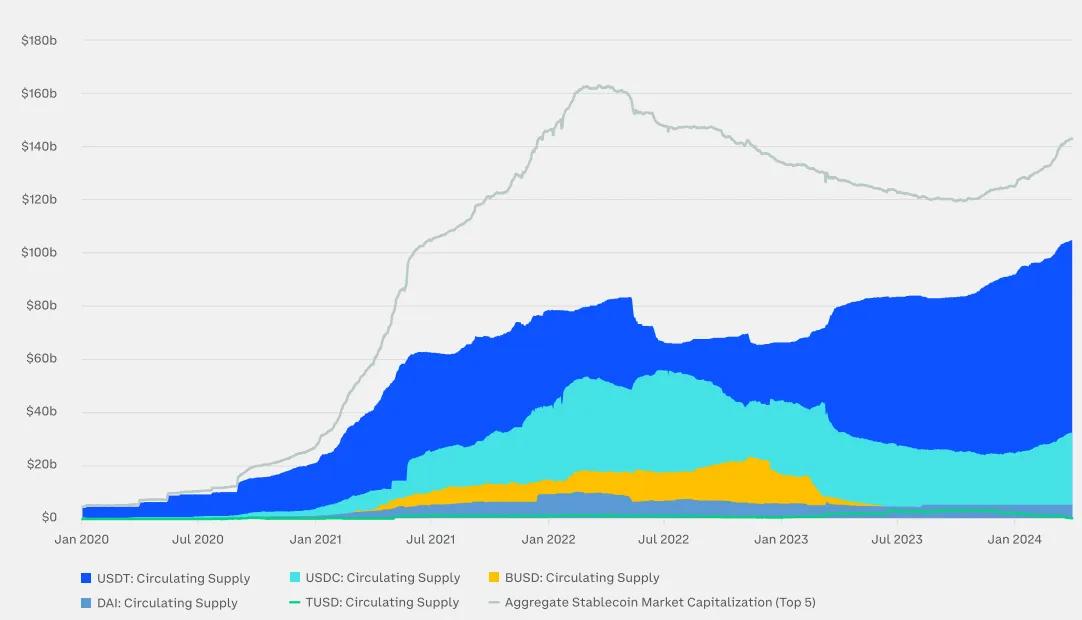
An important metric to consider when evaluating stablecoins is the amount and nature of the reserve assets they hold. As market participants continue to increase their use of stablecoins, stablecoin supply rose by more than 14% in the first quarter.
4. Bitcoin price performance after halving
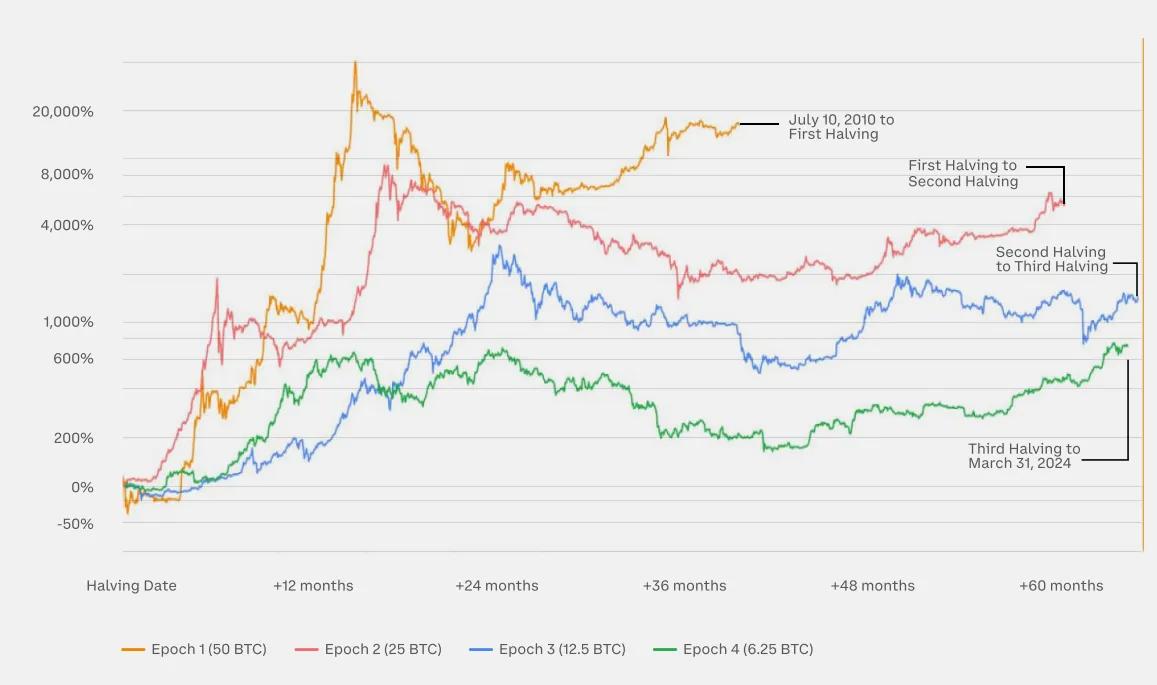
This chart measures Bitcoin’s total return during each halving cycle. In the 12 months following the first 3 halvings, the price:
- After the first halving, it increased by more than 1000% (red line)
- After the second halving, it increased by more than 200% (blue line)
- After the third halving, it increased by more than 600% (green line)
5. Bitcoin Available Supply
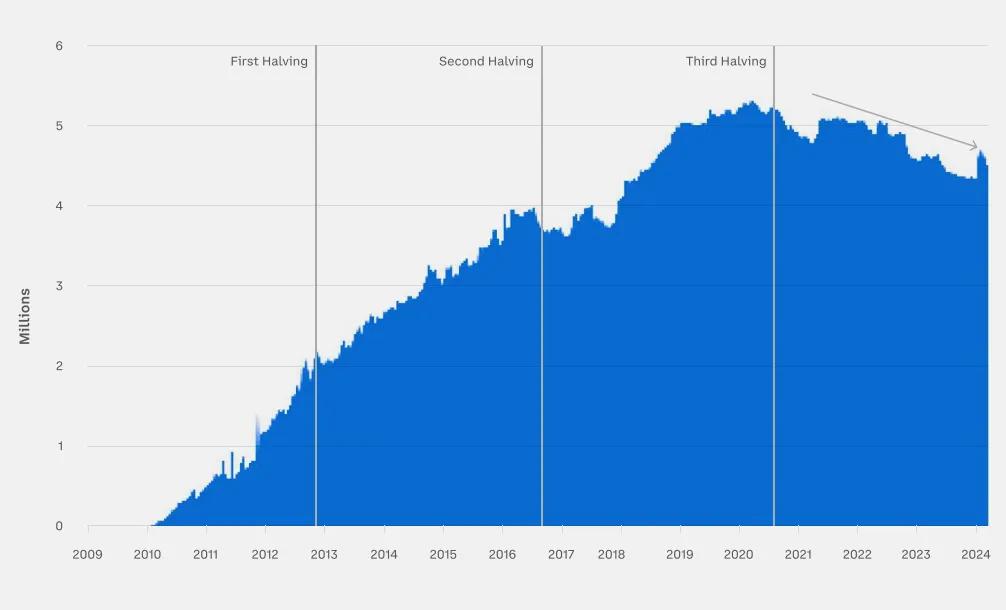
The difference between the token’s current circulating supply and the illiquid supply (lost wallets, long-term holdings, locked) determines the amount of available Bitcoin supply.
After peaking in early 2020, Bitcoin’s available supply has fallen to around 4.6 million BTC, a significant shift ahead of the fourth halving and a departure from the steadily rising available supply trend observed during the three previous halvings.
6. Bull market cycle performance

Bitcoin has historically shown exponential growth in bull runs, with prices building on lows multiple times higher. The current bull cycle began in November 2022, and prices have reached 4x their lows. As the chart shows, the two previous bull runs (2015 to 2017 and 2018 to 2021) saw prices rise 100x and 20x, respectively.
7. Bitcoin price performance since the lows
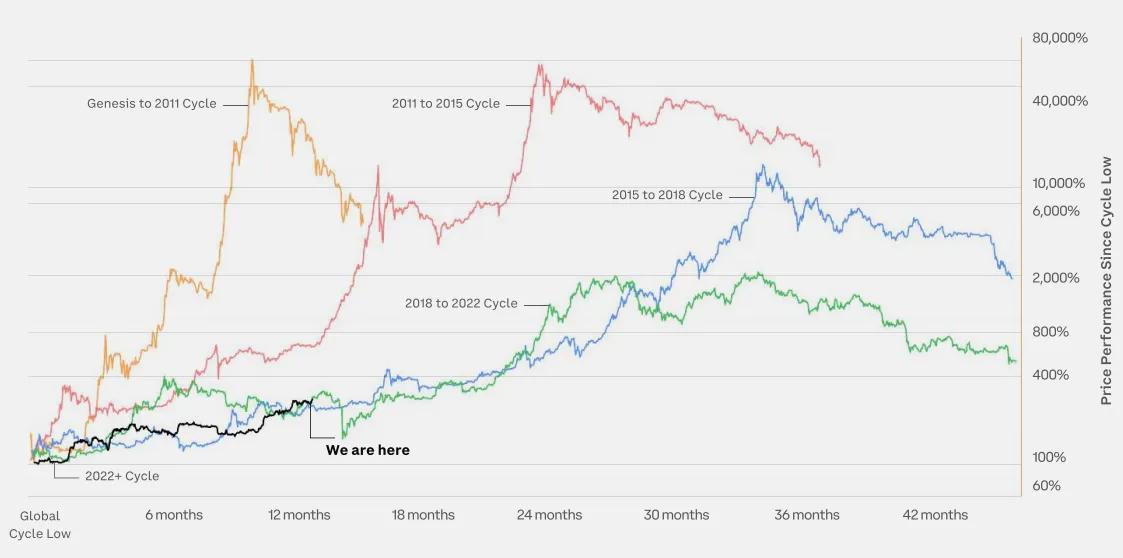
Bitcoin has completed four cycles, each of which included a bull market and a bear market. This chart shows how the current market cycle, which began in 2022, compares to previous cycles. In the current cycle, Bitcoin has risen by more than 400% in the 17 months since the low. The current cycle is closest to the 2018 to 2022 cycle, where Bitcoin rose by 1,000% 24 months after the low.
8. Ethereum price performance since the lows

Ethereum has completed two cycles that included both a bull and a bear market. This chart shows how the current market cycle, which began in 2022, compares to previous cycles. In the current cycle, Ethereum is up over 200% in the 17 months since the low. The current cycle is closest to the 2018 to 2022 cycle, where Ethereum was up 400% 24 months after the low.
9. Ethereum supply profitability status
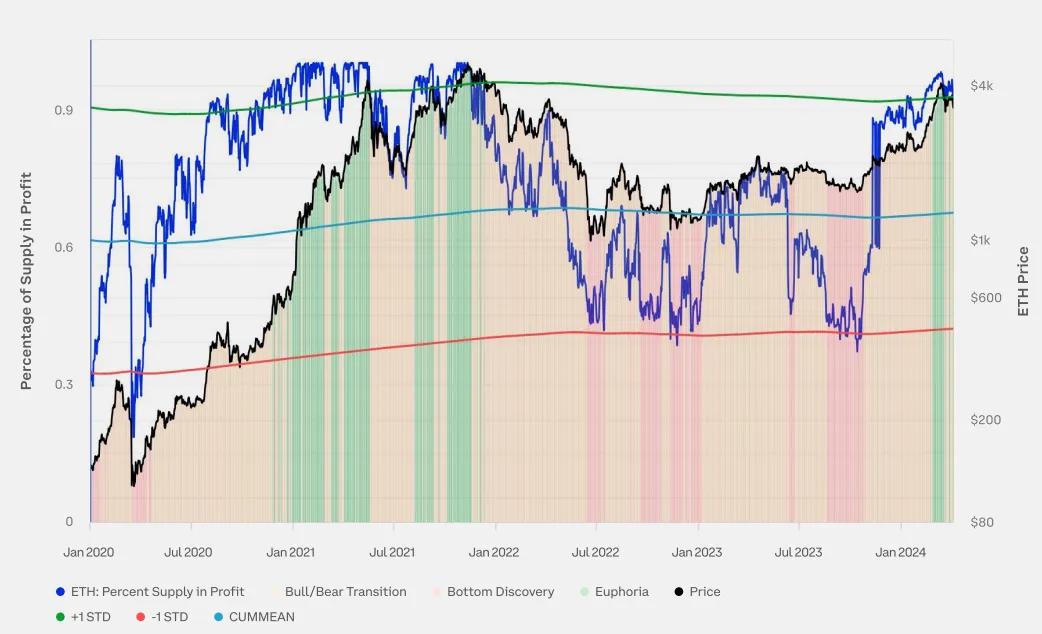
Looking at supply profitability can help reveal where crypto prices are in the current market cycle, as previous cryptocurrency market cycles were characterized by three phases:
- Price bottom: In the final stages of a bear market, a prolonged price decline leads to a rise in the share of losing supply (percentage of profitable supply < 55%).
- Excitement: During a parabolic price uptrend in a bull market, the share of profitable supply becomes dominant (% of profitable supply > 95%).
- Bull/Bear Transition: The transition period between bottom exploration and ecstasy, when supply profitability is closer to balance (the percentage of profitable supply is between 55% and 95%).
10. Ethereum’s weekly active addresses grew by 26%

Active addresses grew 26% in Q1 amid rising prices and Ethereum’s successful Dencun upgrade.


