

The broad market rally has resulted in significant gains for many altcoins. However, as before, meme coins are leading this upward trend, and today, PEPE is leading the way.
The frog-themed meme coin is trading at $0.000011 at press time, up 20.13% in the last 24 hours. This on-chain analysis reveals catalysts for price growth and potential price targets.
More interaction, higher price
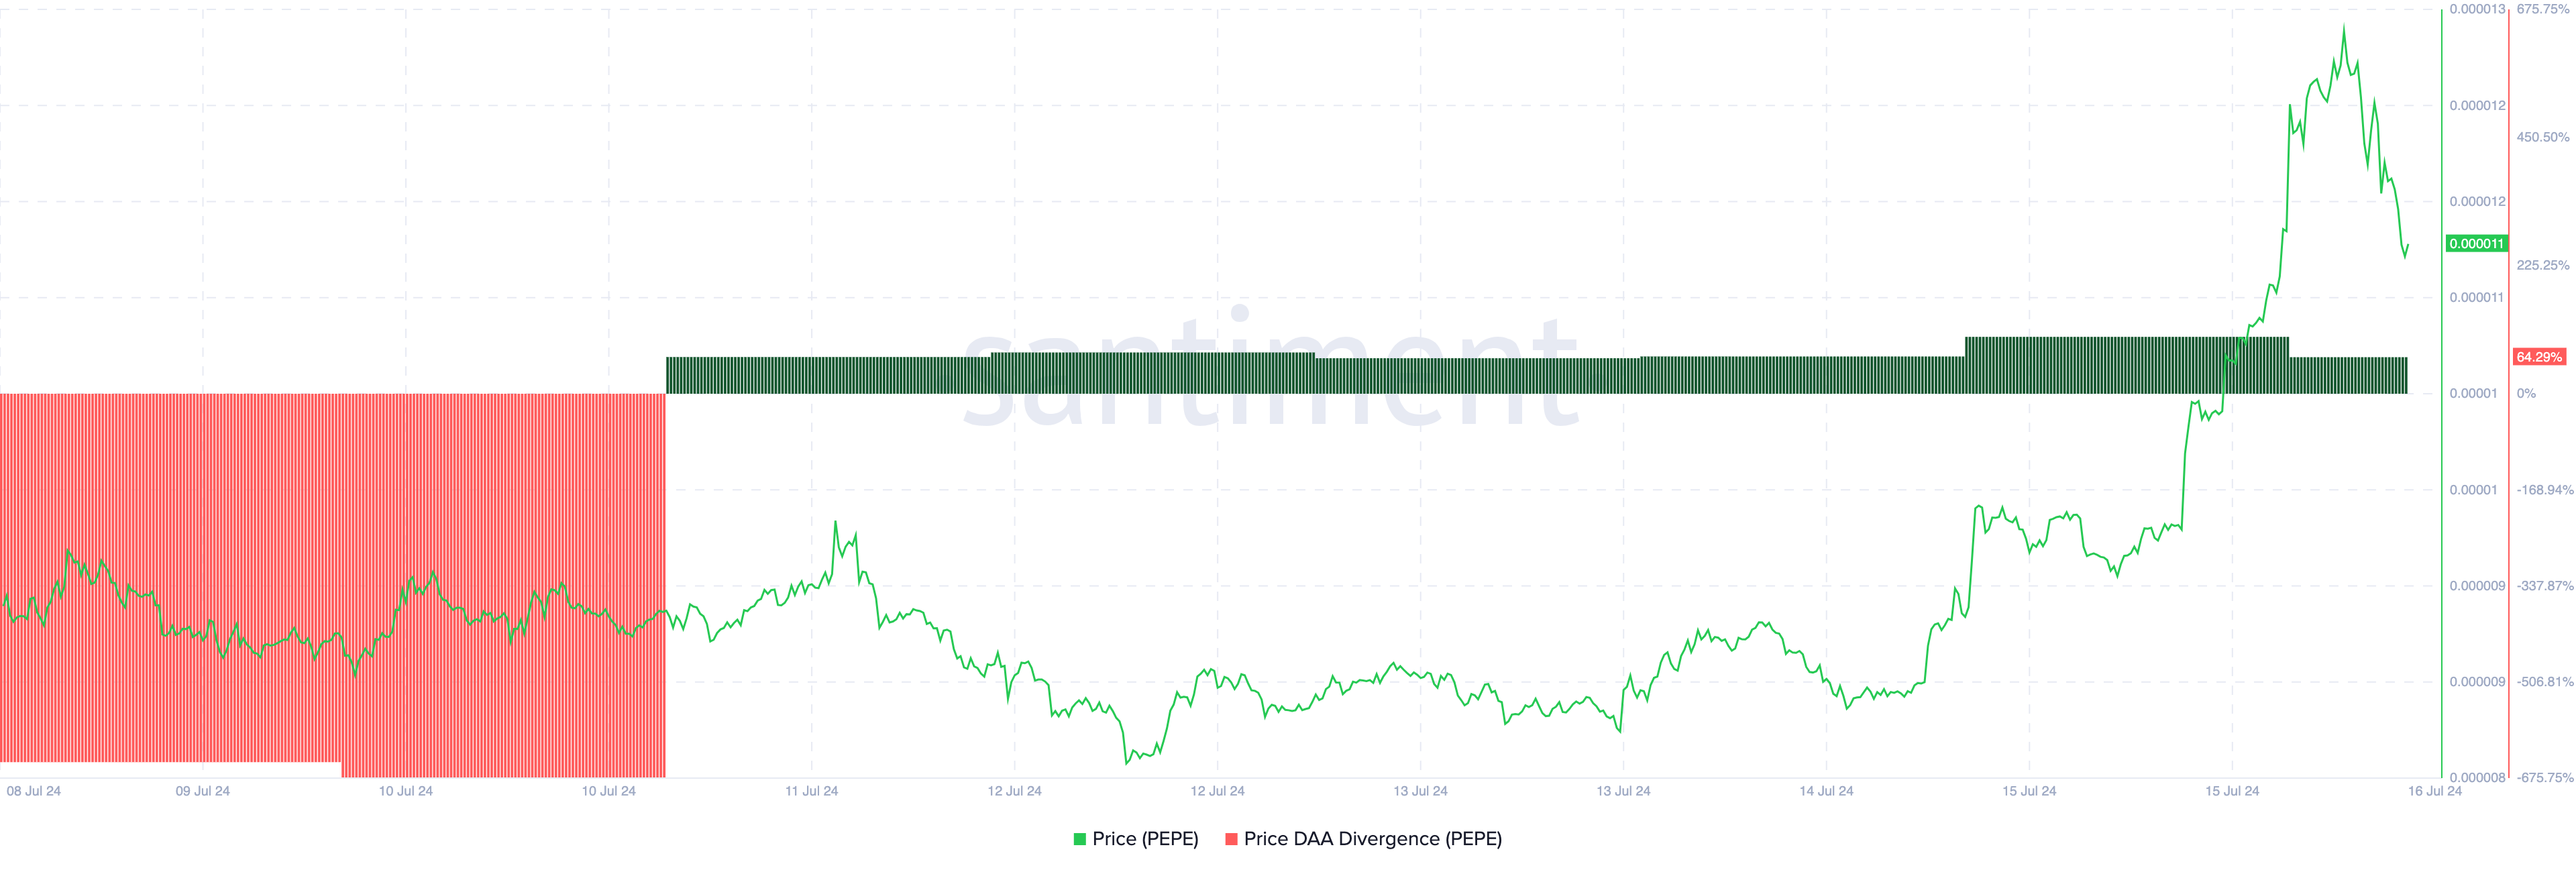
According to Santiment, the price-DAA gap is one of the reasons why the price of PEPE has risen. DAA stands for Daily Active Addresses and measures unique user interactions with cryptocurrencies.
As you can see below, the price-DAA differential was negative during PEPE's downtrend. This means that as prices have fallen, engagement has been low. But things changed on July 11th, when the price of PEPE started moving north.
Typically, as the price rises, more market participants purchase the cryptocurrency. Therefore, the rise to 64.29% proves that as the number of active addresses increases, participants are influenced to value meme coins more and buy more.
Read more: 5 Best PEPE Wallets for Beginners and Experienced Users
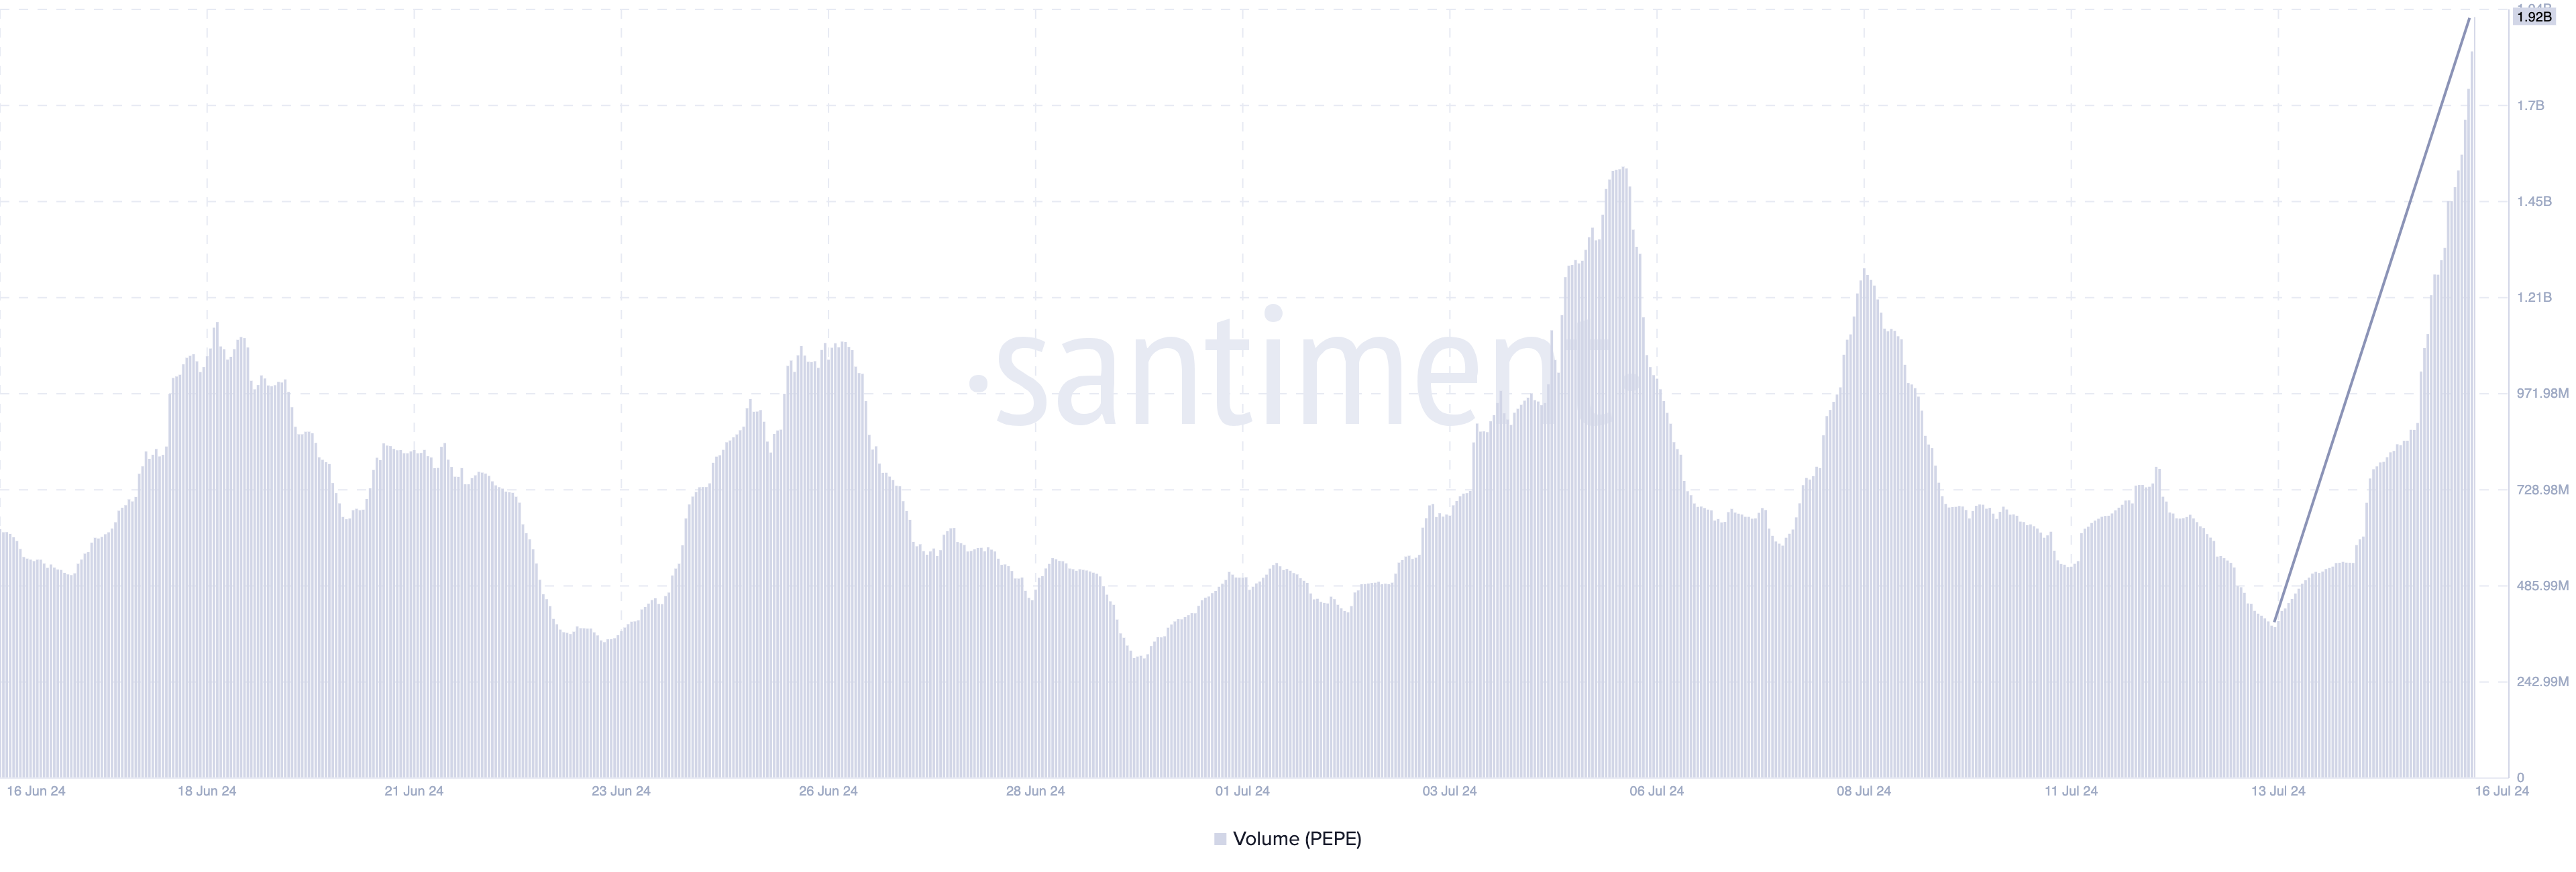
The increase in buying pressure is also reflected in volume, which is nearing $2 billion for the first time in nearly two months.
In cryptocurrency, trading volume refers to the value traded over a certain period of time. Increasing trading volume means more participants are participating in cryptocurrency trading. However, declining volume means interest is waning.
This indicator also affects prices. For example, if the price is in an upward trend and then volume suddenly decreases, this indicates that it may be time for a price reversal. However, PEPE's trading volume continues to increase, so the upward trend is likely to continue.
PEPE price prediction: could it rise further?
Looking at the daily PEPE/USD chart, we can see that the bullish momentum continues, as evidenced by the Relative Strength Index (RSI).
RSI measures momentum by measuring the size and speed of price changes. Traders also use this technical tool to identify overbought or oversold conditions. When this index rises, momentum is strong. However, if it reaches above 70.00, it is overbought.
Conversely, a falling RSI reading indicates bearish momentum. Likewise, anything below 30.00 means it is oversold.
As mentioned earlier, an RSI of 60.10 indicates that the momentum of the meme coin is bullish. If this continues, higher prices may be formed by the Fibonacci retracement indicator. This indicator provides insight into the potential levels at which the price may oris likely to reverse .
Read more: Litecoin: PEPE Price Prediction 2024/2025/2030
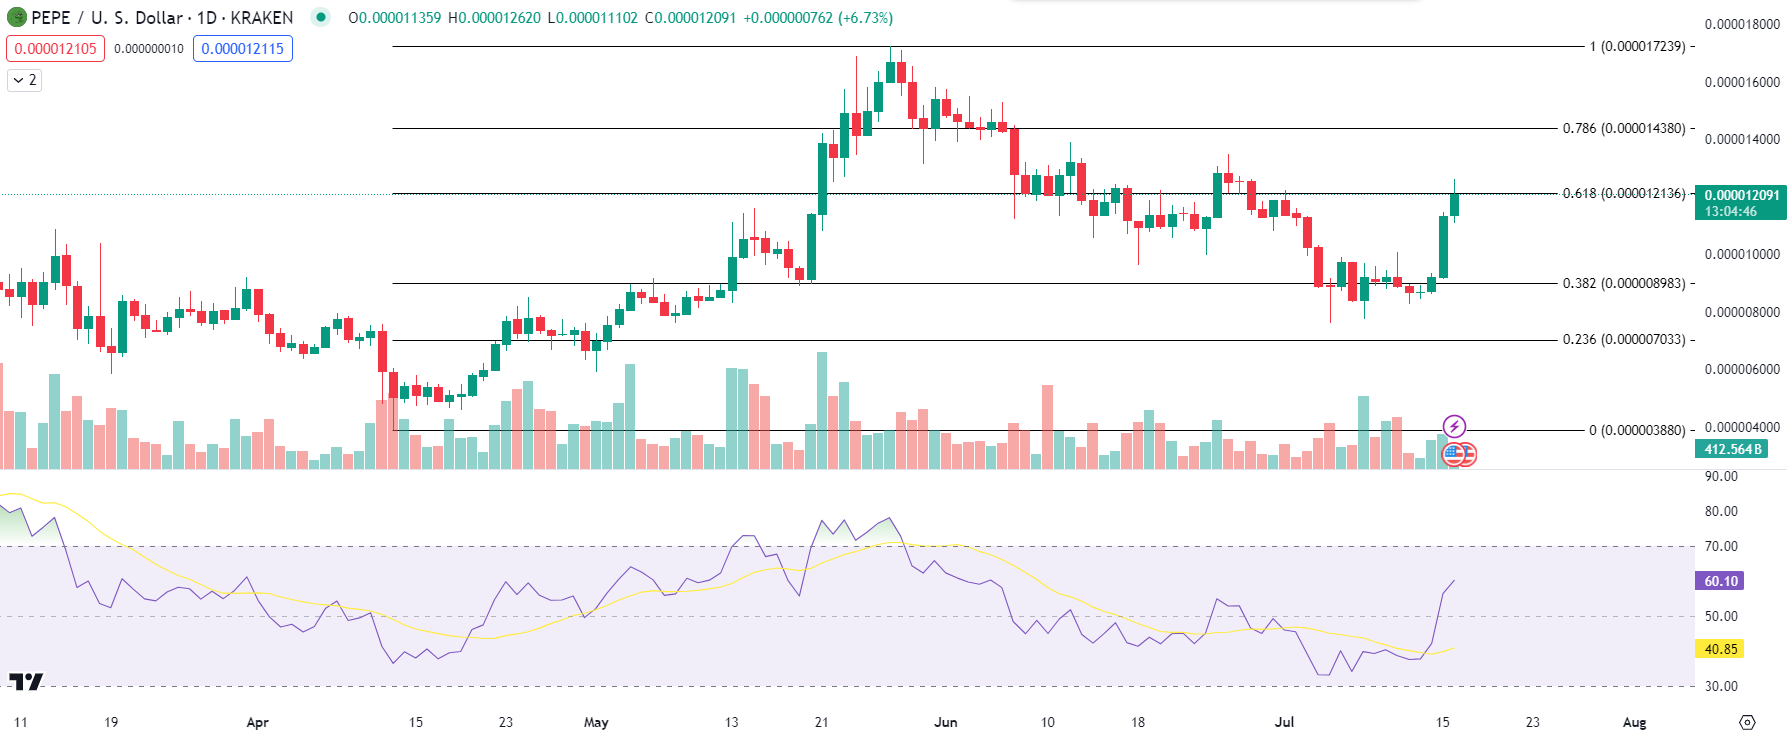
Also important Fibonacci levels are 0.236, 0.382, 0.618, 0.786. If buying pressure increases in the chart above, PEPE's next target could be a retest of $0.000012 and a possible rise to $0.000014.
However, if traders decide to book profits from the recent increase, the price of Meme Coin could reverse to $0.000010.


