

Cryptocurrency exchange Kraken said in a July 24 post on X that it had distributed all the coins to creditors of Mt. Gox. However, that did not boost Bitcoin (BTC) volatility, suggesting that those receiving the refunds were not in a rush to take profits as some analysts predicted.
Likewise, the launch of spot Ether ETFs has not created any boom for Ether, suggesting that the market is in a wait-and-see mode. One small positive is that Ether ETFs saw net inflows of $106.6 million on the first day of trading despite $485 million in selling pressure from Grayscale's new Ethereum Trust.
Bitcoin and several major altcoins have been consolidating for some time, showing indecision between bulls and bears about the next directional move. The longer the range lasts, the stronger the trigger is needed for the price to break out of that range.
Will Bitcoin continue to act within its range or can the buyers push the price above the range? Let's analyze the charts of the top 10 cryptocurrencies to find out.
Bitcoin remains stuck in sideways price action between $56,552 and $73,777, suggesting buying at support and selling near resistance.
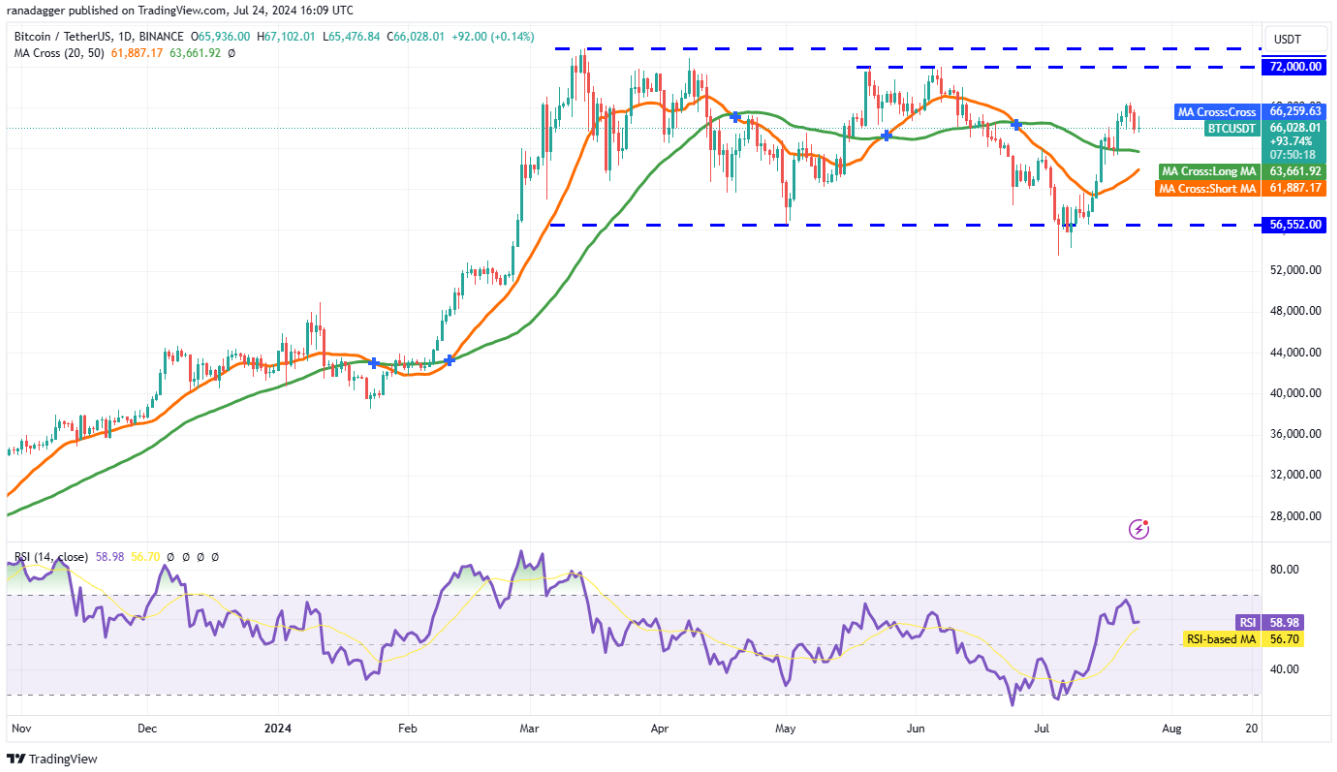
BTC/ USDT Daily Chart | Source: TradingView
The 20-day simple moving Medium ($61,887) is sloping up and the relative strength index ( RSI ) is in positive territory suggesting a short-term bias in favor of buyers. The bulls will try to push the price to $73,777 but might encounter stiff resistance at $70,000 and again at $72,000.
On the downside, if the $65,000 support breaks, the BTC/ USDT pair could drop to the moving Medium . This is an essential support level for the bulls to defend as a break of it could open the door for a drop to $60,000.
Ether has risen from the 50-day SMA ($3,411) on July 23, but the bulls are struggling to maintain the momentum. This shows that the bears are active at higher levels.
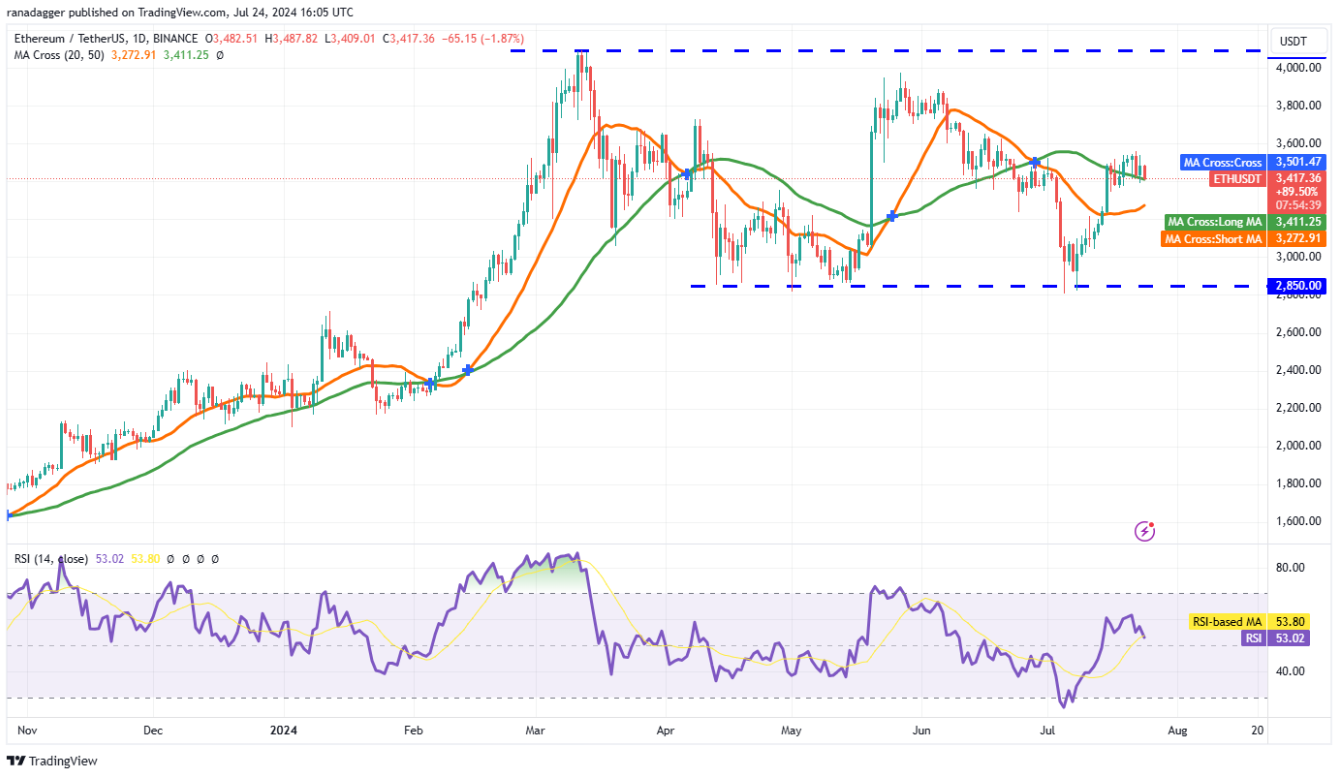
ETH/ USDT Daily Chart | Source: TradingView
If the price slips below the 50-day SMA, the ETH/ USDT pair can drop to the 20-day SMA ($3,272). This is an important level to watch out for because if this support breaks, selling could increase and the pair could plummet to $3,000.
Conversely, if the price rises from the current levels and breaks above $3,563, this would suggest that the short-term trend remains positive. The pair could then rise to $3,722 and above it to $4,000. Sellers are expected to aggressively defend the $4,000-$4,094 zone.
The bulls attempted to push BNB (BNB) towards the overhead resistance at $635, but the bears pulled the price back to the 50-day SMA ($583).
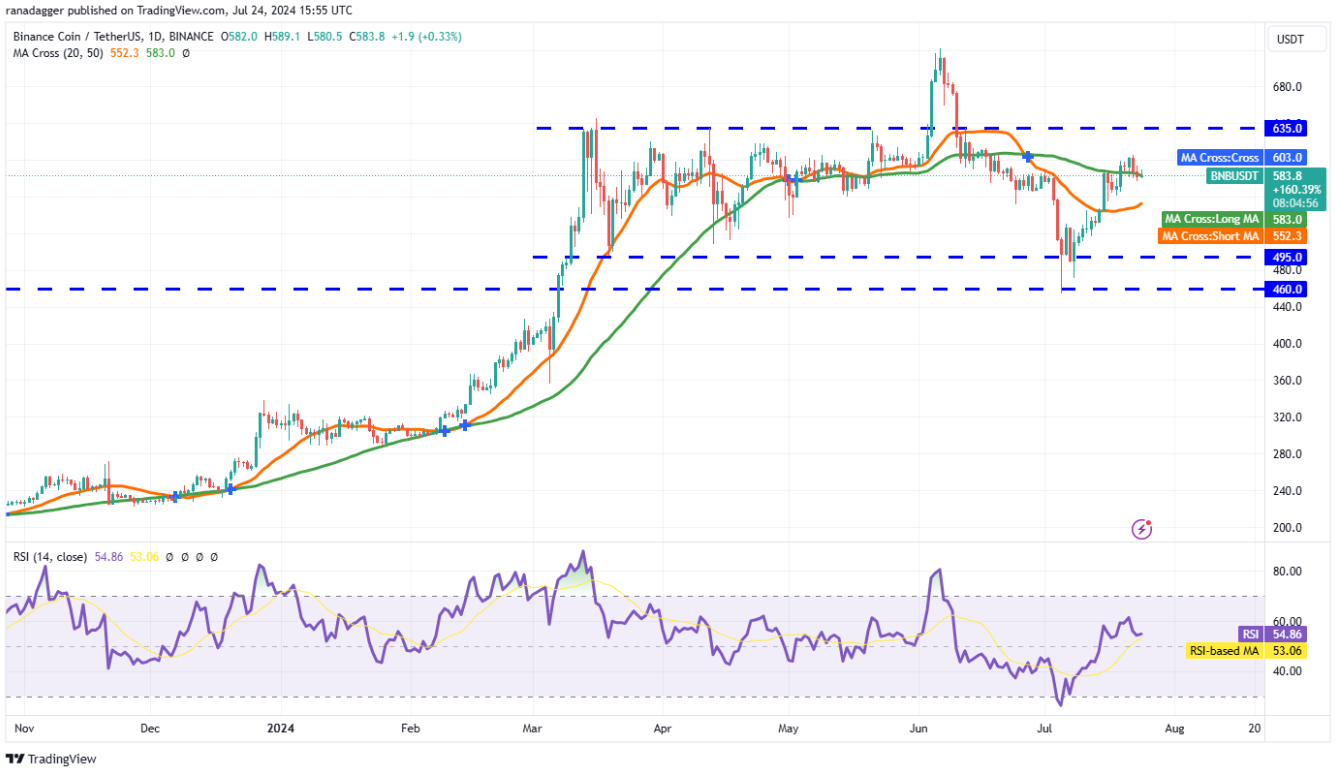
BNB/ USDT Daily Chart | Source: TradingView
If the price rebounds strongly from the 50-day SMA, it will indicate that the bulls are buying on every slight dip. That would improve the prospects of a break above $635. If that happens, the BNB/ USDT pair could rise to $722.
Conversely, if the price breaks and closes below the 50-day SMA, it will show that the bears are trying to keep the price within the $495 to $635 range for a while longer. The pair could then drop to the 20-day SMA ($552).
Solana (SOL) turned down from $185 on July 22 and is retesting the breakout from the descending triangle.
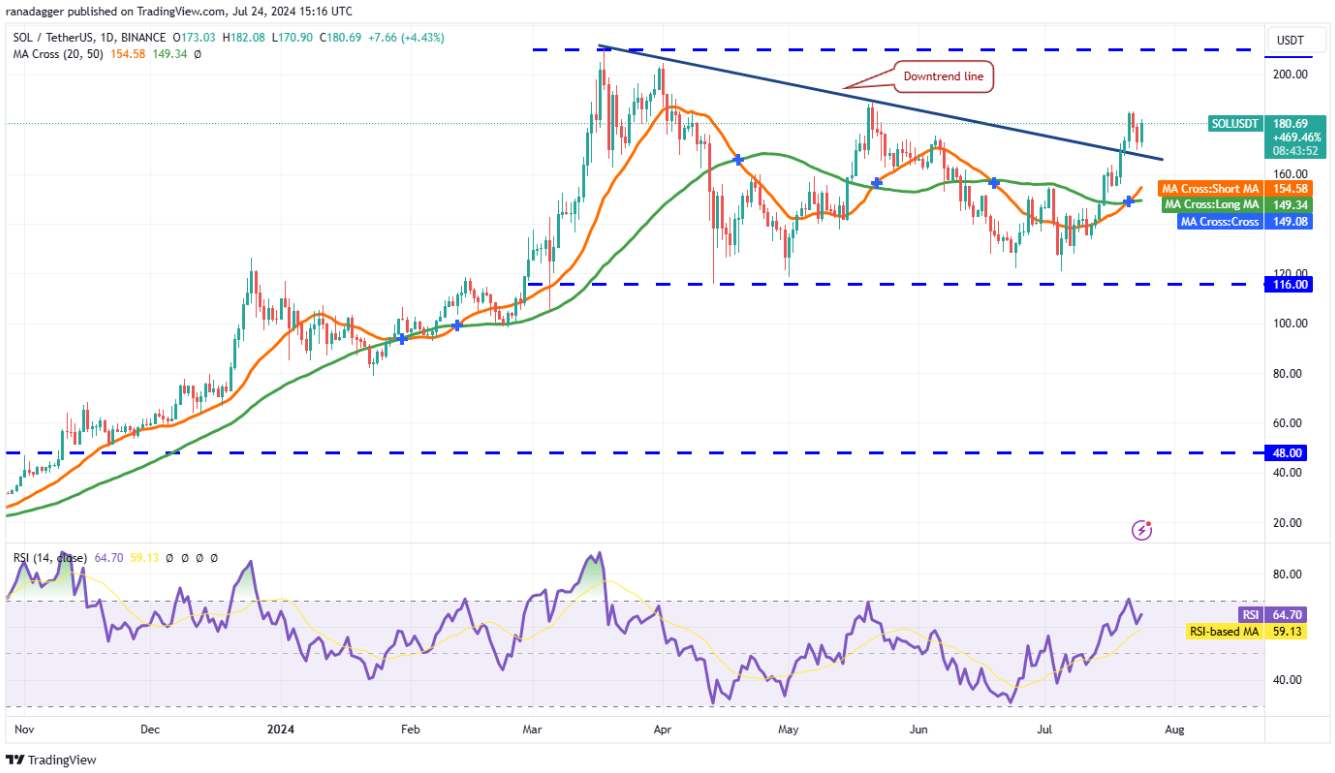
SOL/ USDT Daily Chart | Source: TradingView
The upsloping 20-day SMA ($154) and the RSI in the positive zone suggest that the bulls are in control. If the price rises from the current levels and surpasses $185, the SOL/ USDT pair can reach $210.
This positive view will be invalidated in the near term if the price returns to the triangle. The bears will strengthen after pushing the price below the moving Medium as this will signal the recent breakout could be a bull trap.
The bears attempted to drag XRP (XRP) below the $0.57 support on July 23, but the bulls remained firm.
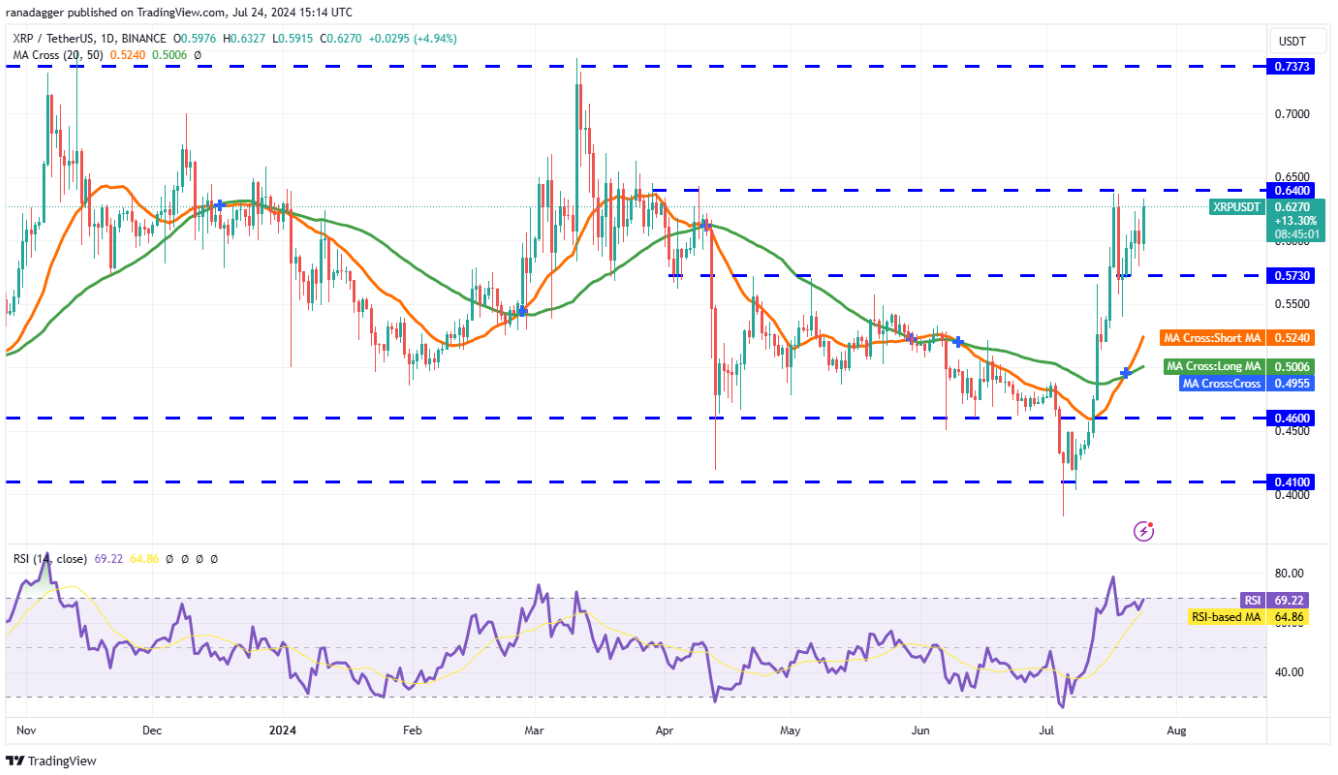
XRP/ USDT Daily Chart | Source: TradingView
Buying activity increased on July 24 and the bulls are trying to overcome the barrier at $0.64. If successful, the XRP/ USDT pair is likely to regain momentum and surge towards the strong resistance at $0.74.
The bears are gradually weakening. If they want to stop the upside move, they will have to successfully defend the $0.64 level and then drag the pair below $0.57. If they do, the pair could slide to the 20-day SMA ($0.52).
Dogecoin (Doge) returned to the 50-day SMA ($0.13) on July 23, which likely attracted buyers.
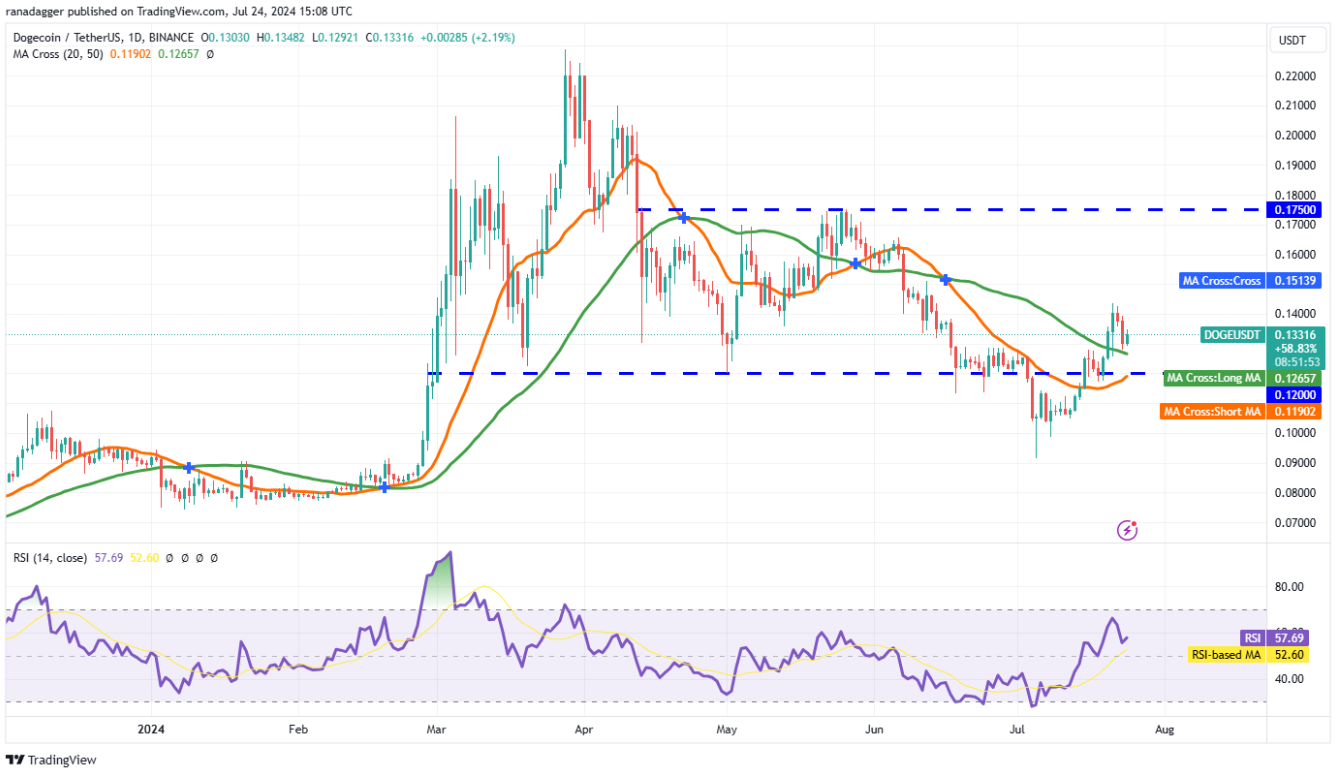
Doge/ USDT Daily Chart | Source: TradingView
The 20-day SMA ($0.12) has started to turn up and the RSI is in the positive zone, showing that the bulls have a slight advantage. If the bounce from the 50-day SMA is sustained, the bulls will attempt to push the Doge/ USDT pair to $0.15 and then to $0.18.
Instead, if the 50-day SMA breaks down, it will signal that the bears have overwhelmed the bulls. The pair could then drop to the 20-day SMA, which is again likely to Vai as support. A break below this level will tilt the advantage towards the bears.
Toncoin (TON) has dropped to the support of the range at $6.77, which is an important level to watch.
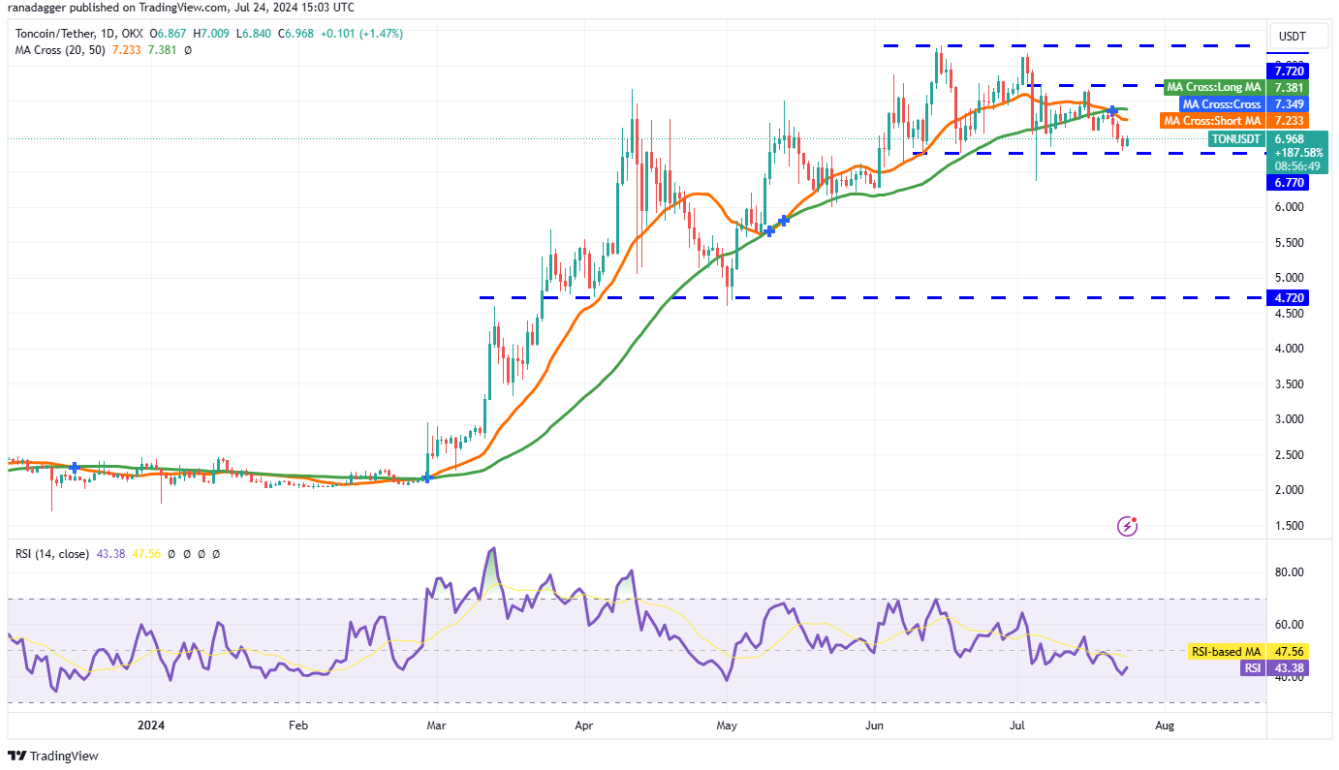
Daily TON/ USDT chart | Source: TradingView
A weak rebound from current levels would signal a lack of buying at higher levels, increasing the possibility of a break below $6.77. If that happens, the TON/ USDT pair will complete a double top pattern. That could start to drop to $6 and then $5.50.
On the other hand, if the price rises sharply from current levels, this will signal solid demand from the bulls. The pair could then rally to $7.72, where the bears are expected to mount a strong defense.
Cardano (ADA) dropped to the moving Medium on July 23, where buyers were expected to step in to stem the decline.
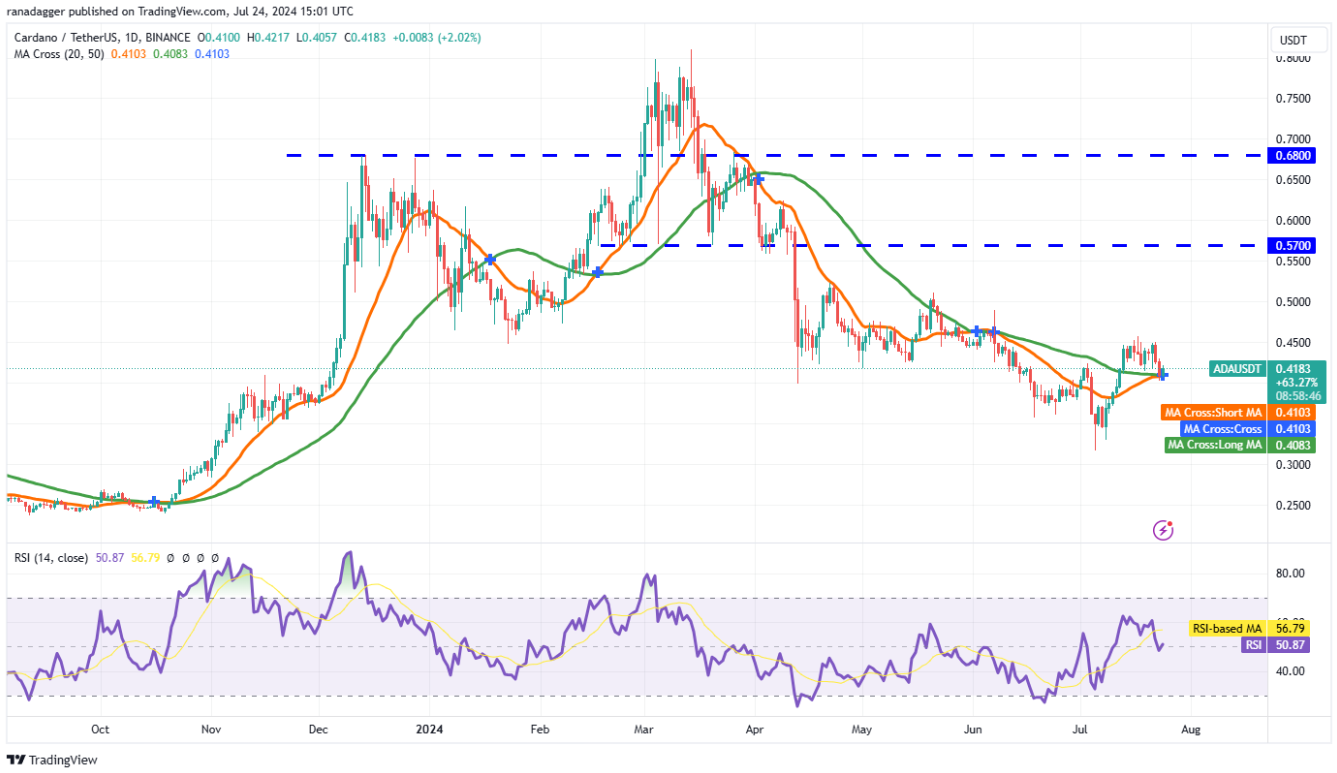
ADA/ USDT Daily Chart | Source: TradingView
If the price rises sharply from current levels, this will indicate a change in sentiment from selling on the rise to buying on the decline. The bulls will then attempt to push the price above $0.46, initiating a move to $0.52.
Contrary to this assumption, if the price breaks below the moving Medium , this will show that the bears are trying to assert their dominance. The ADA/ USDT pair could then drop to the strong support near $0.35.
Avalanche (AVAX) fell from $33 on July 21 and reached its moving Medium on July 24, suggesting demand at higher levels is not strong.
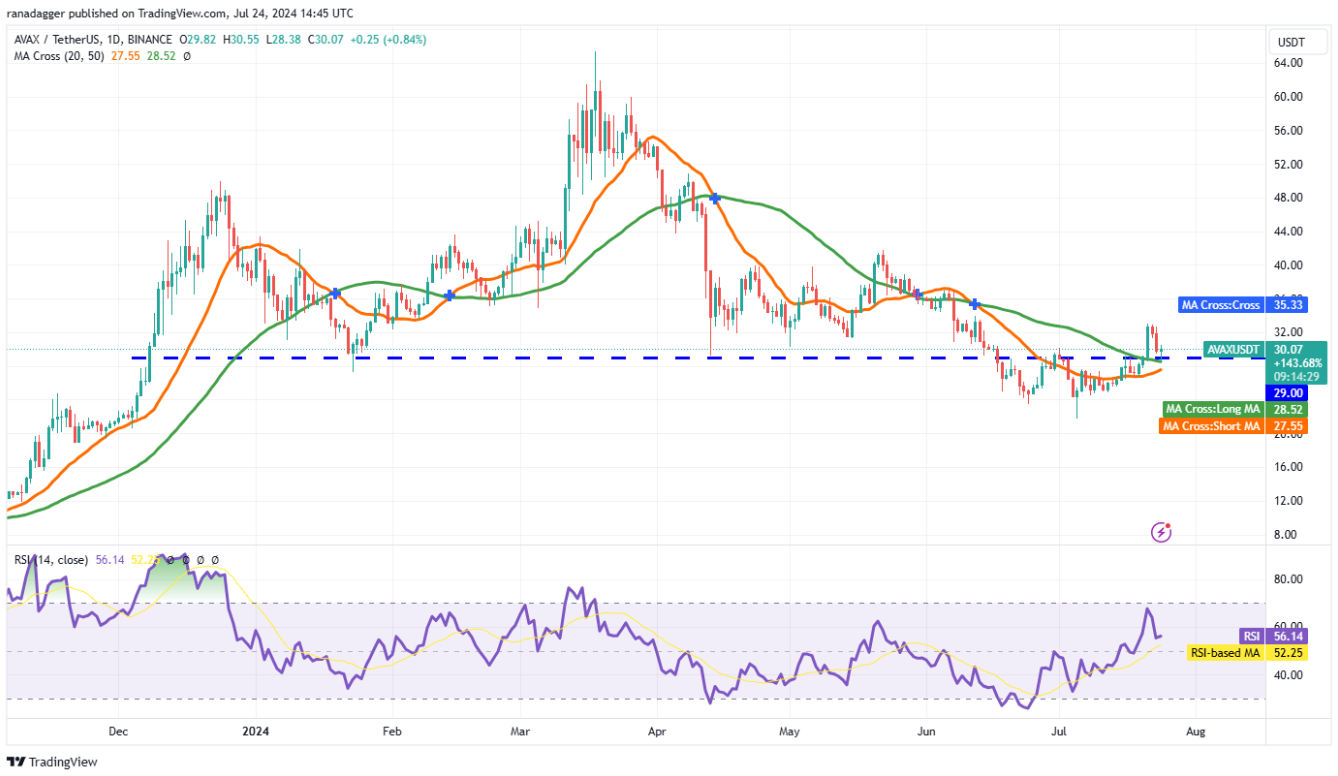
AVAX/ USDT Daily Chart | Source: TradingView
The flat 20-day SMA ($27.55) and RSI just above the midpoint give neither the bulls nor the bears a clear advantage. If the price drops below the 20-day SMA, the AVAX/ USDT pair can drop to $24 and ultimately to $21.80.
Conversely, if the price rebounds from the moving Medium , this will signal that the bulls are attempting to make a higher Dip . The bulls will have to push and sustain the price above $33 to suggest the beginning of a stronger recovery towards $37 and then $42.
Shiba Inu (SHIB) has been trading between the moving Medium over the past few days, but this tight range trading is unlikely to continue for long.
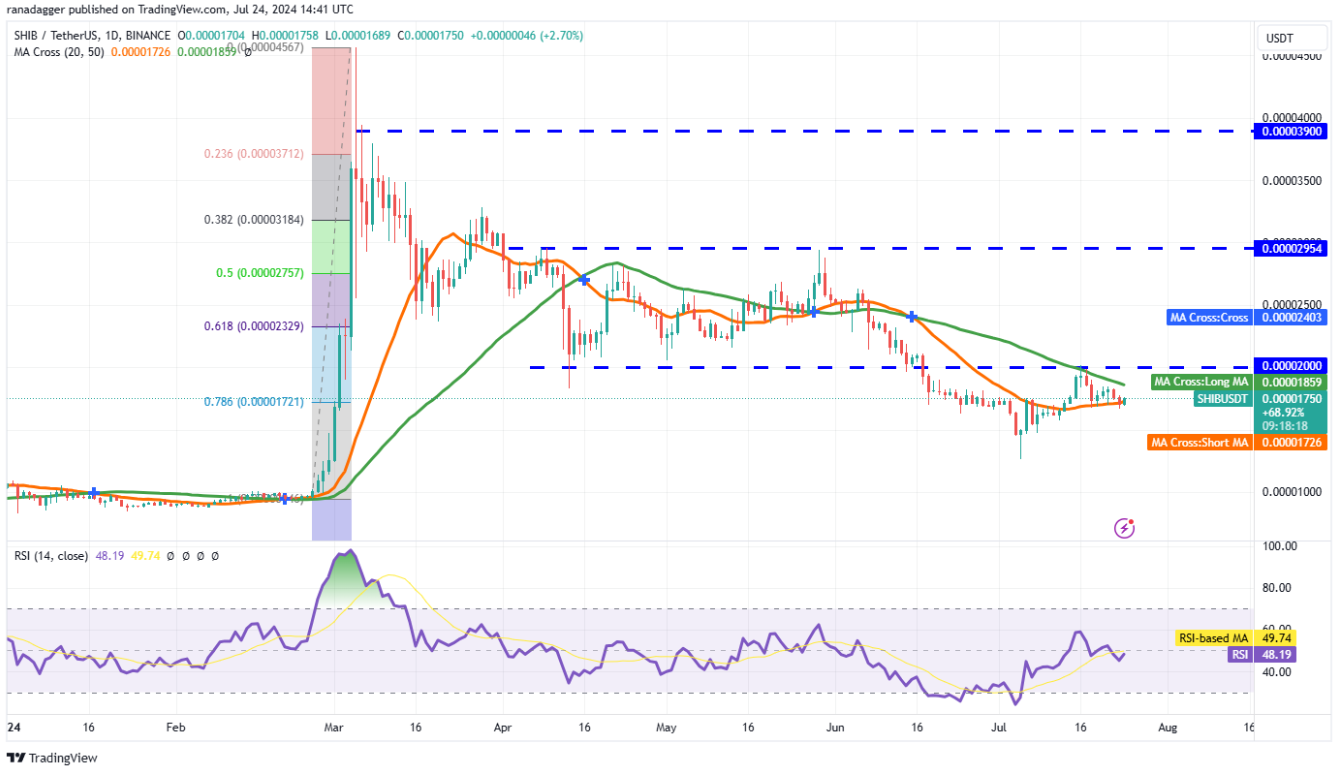
SHIB/ USDT Daily Chart | Source: TradingView
If the price sustains below the 20-day SMA, it will open the door for a decline to $0.000015 and then $0.000013. A bounce from this level will keep the price between $0.000013 and $0.000020 for a while.
The SHIB/ USDT pair is likely to strengthen after buyers pushed the price above $0.000020. Such a move would show that the market has rejected lower levels. The pair could then attempt to rally to $0.000026.
You can XEM coin prices here.
Disclaimer: This article is for informational purposes only, not investment advice. Investors should research carefully before making a decision. We are not responsible for your investment decisions.
Join Bitcoin Magazine's Telegram: https://t.me/tapchibitcoinvn
Follow Twitter: https://twitter.com/tapchibtc_io
Follow Tiktok: https://www.tiktok.com/@tapchibitcoin
SN_Nour
According to Cointelegraph


