The following is a prediction of BTC prices based on internal and external liquidity and the Nasdaq exchange rate pair. Figure 1: At the end of April 2019, the end of October 2020, and mid-October 2023, the BTCUSD/NASDAQ exchange rate pair broke through the white line when the global M2 level was positive, confirming the start of the market, indicating that Bitcoin has an independent bull market relative to the stock market.
The blue line is the BTCUSD/NASDAQ exchange rate pair. Whether the exchange rate breaks through or falls below the white line, it has a strong trend.
The white line is an indicator drawn by the low price of the past 7 weeks*1.5, which is used to judge whether there will be a trend. I will give it to the destined person, it is very accurate, I tested it in the last bull market.
This is a prediction based on the price of the exchange rate pair to see whether there will be a downward trend in the future. If it breaks through the white line, Bitcoin will rise more relative to Nasdaq, and it is easy to form a trend market. The current position of 35k is just stuck at the white line, neither going up nor down. If it can stand firm, how much can it rise in the future?
Figure 1: Red line stablecoin market value, purple line stablecoin market value share; Figure 2: Comparing the liquidity in 2019 and 2020, we can predict the growth of the market value in 24 to get the expected price. In 2019, 2020, and 23, the M2 index was 1.65, 17.38, and 3.77, respectively, the number of stablecoins was 3, 20, and 110B, respectively, and the proportion of stablecoins in the BTC market value was 4%, 7%, and 16%, respectively. That is, the macro liquidity is better than that in 2019, but far worse than that in 2020, which is a minus point; the liquidity of stablecoins in the crypto in 2023 is much higher than that in 2019 and 2020, and the market value of stablecoins is higher, which means that it can release a larger bubble in the bull market, which is a plus point.
Macro liquidity and micro liquidity increase and decrease, so the market value growth (BTC market value growth after breaking the white line) should fall between 145B in 2019 and 1000B in 2020. Although external liquidity has not improved beyond expectations, most of the liquidity from external intervention in the last bull market has been precipitated as stablecoins. Since the peak in 2021, stablecoins have only flowed out by about 20%. At the same time, combined with the expectation of improved liquidity, the estimate of the final market value growth should be cautiously optimistic.
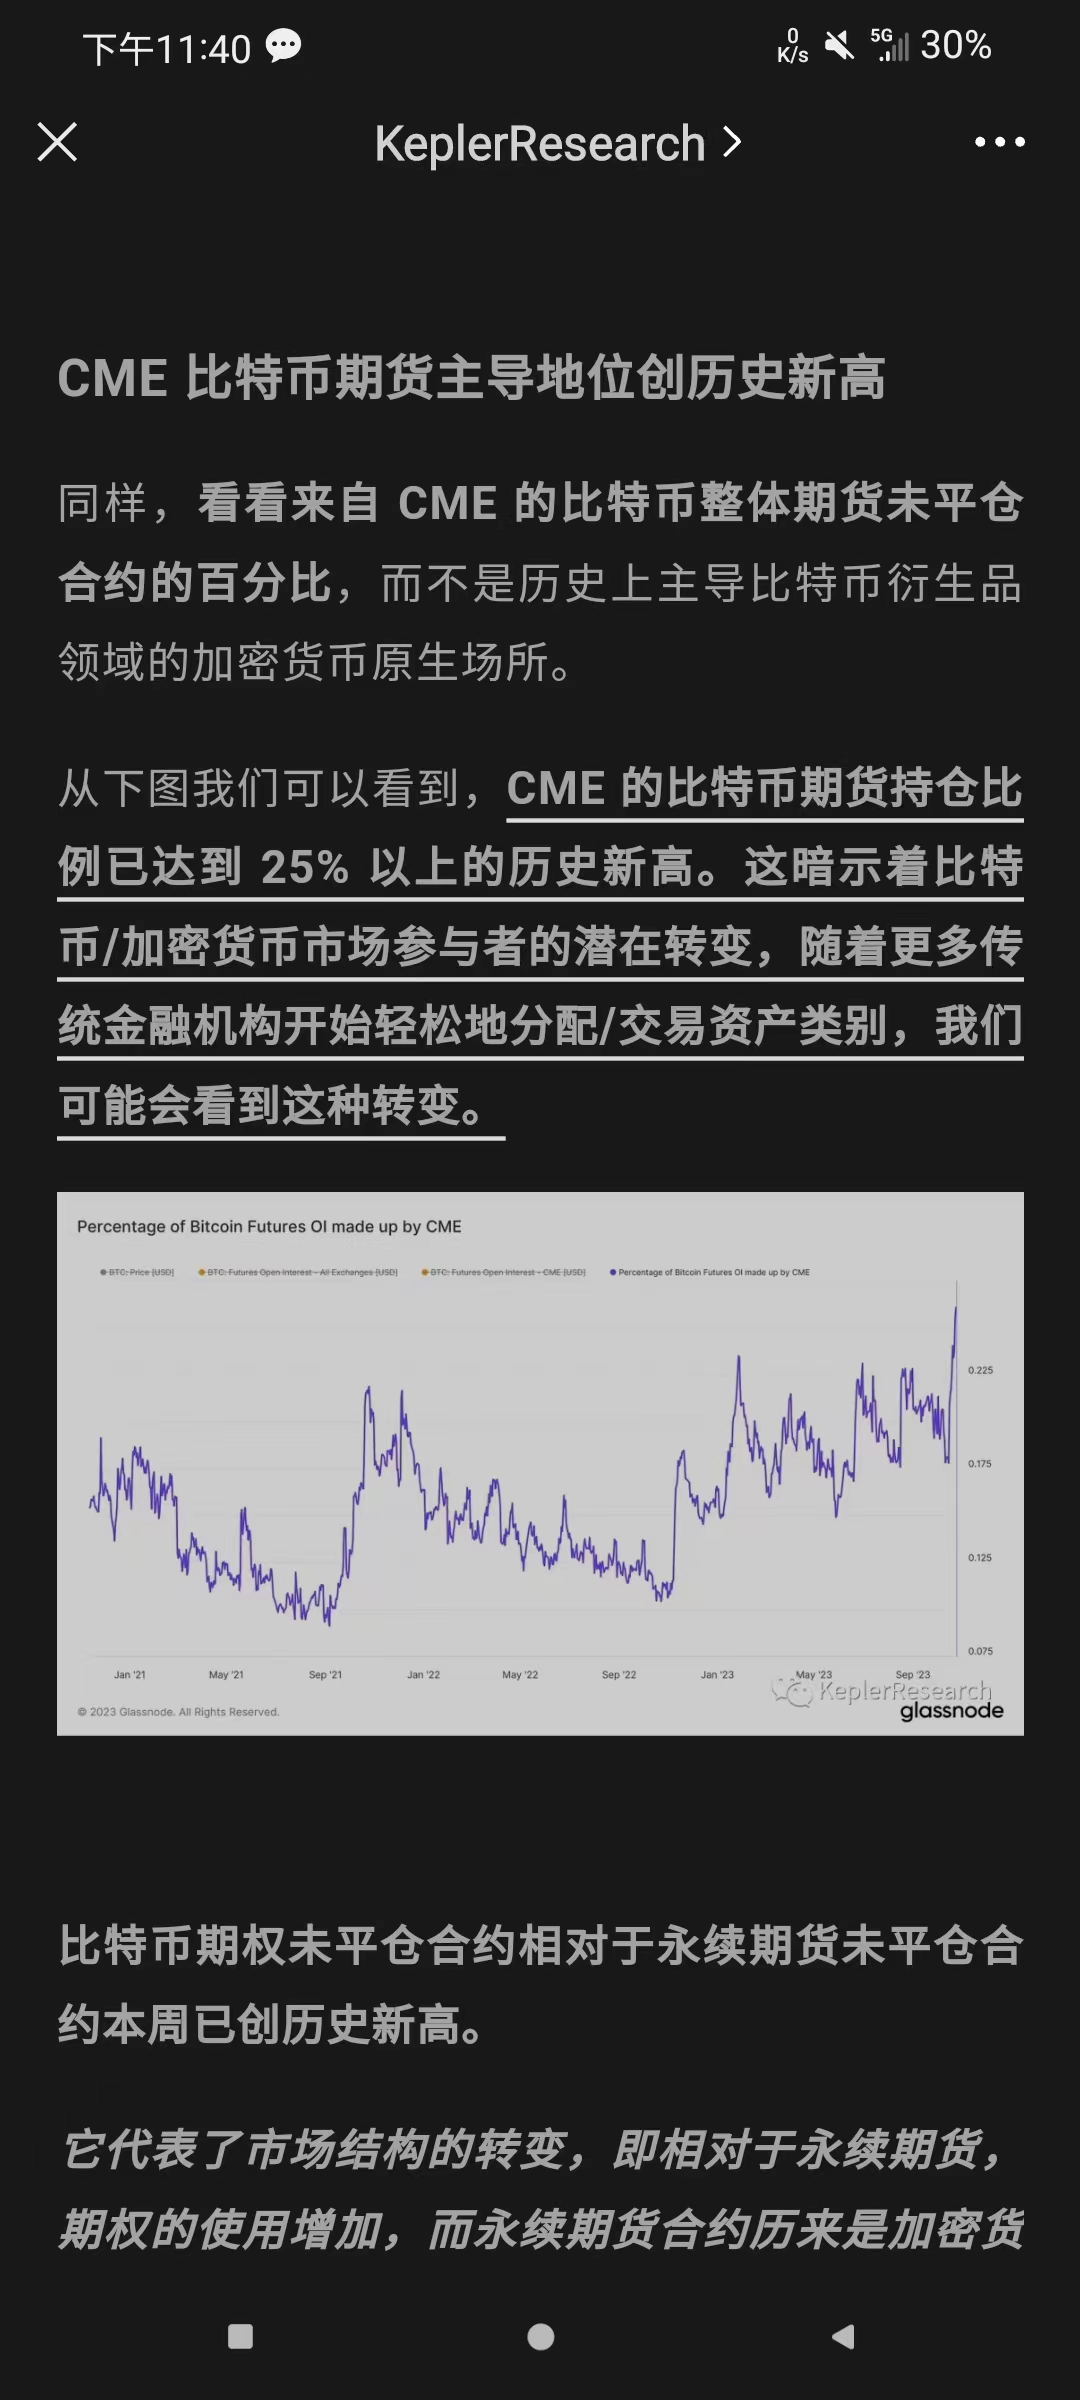
The prediction given here is that after breaking through the white line, the market value growth will be 700B, which can be converted into a price of 71,000 US dollars; if the market value growth is based on the cycle low point (the above is based on the position of breaking through the white line), under the same conditions, the price will reach 52,000 US dollars. Therefore, in this round of staged bull market, the price high point falls between [52,000-71,000]. At least, it will be a good month before the ETF is passed next year. Figure 3, when the old money will not pass the ETF, will it take over at a high position? GBTC, CME, US stocks, etc. are all ways for them to fight for expectations. Therefore, this prediction can only be valid before Q2 of 24. After the ETF is passed, although there will be a short-term liquidity depletion in the crypto, it will not conflict with the long-term ETF to boost liquidity; the high point is one-time, but new highs are constantly there, or a long bull market can be expected, so this is why I just typed the words "stage high point".
Finally, several conditions for the establishment of a bull market also increase the certainty of the above prediction.
→ Narrative aspect: in fact, the narrative aspect of the past year can be summed up in one word: [breaking the circle]. RWA Treasury bonds-stable coins & ETF spot are [breaking the circle] towards traditional finance, in terms of funds, and Ai+ blockchain & web3 games & TG bots are [breaking the circle] towards traditional business, technology and entertainment, in terms of users. Once again, these variables are the [singularity moment] of this round of bull market superimposed with Buff.
→ On the funding side, as mentioned in the previous article, the Federal Reserve stopped raising interest rates last night, and Sino-US relations eased and improved.
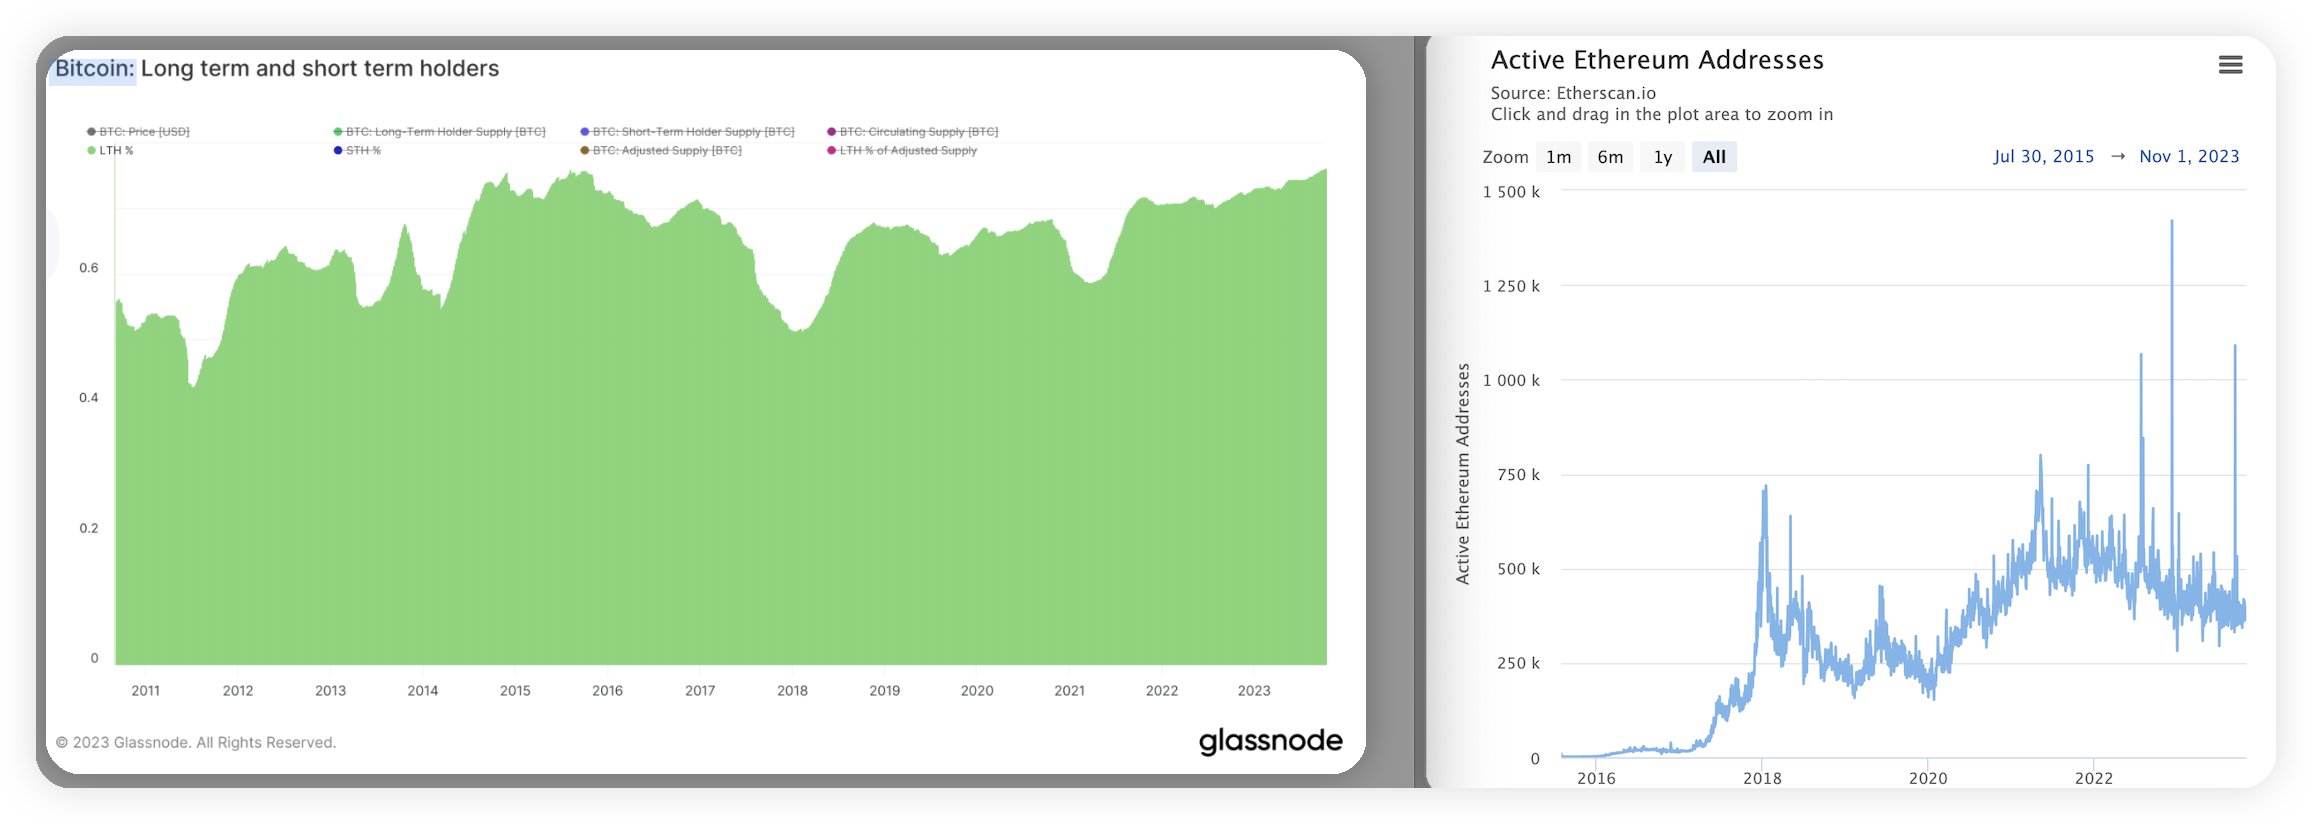
→ Fundamentals: Whether it is the proportion of long-term Bitcoin holders (Figure 4 exceeds 76.2%, a record high in 2015) or Ethereum chain activity, there is no sluggishness, and there is an ecological foundation for the formation of a bull market.
→ On the sentiment side, the BTC ecosystem halving and Ethereum Cancun upgrade are all events that will be concentrated in Q1 and Q2 of next year. There have been a lot of positives today, and the number of words is enough. In the next article, let’s talk about the principle diagram 5 of the rotation of the altcoin and BTC sectors, and how to adjust the positions cleverly. I wish you all good luck. If you have other novel predictions, please comment and let everyone open their eyes together.


