Source: Kaiko Research; Translated by: Baishui, Jinse Finance
Despite encouraging U.S. inflation data last week, the cryptocurrency market remains volatile. Goldman Sachs and Morgan Stanley held large positions in various Bitcoin ETFs at the end of the second quarter, according to their most recent quarterly reports. In addition, Binance reached a settlement with the Indian Financial Intelligence Unit in hopes of returning to the Indian market. This week, we will explore:
The prospects of crypto projects investing in treasury bonds;
ETH gas fees have reached their lowest point in many years;
Investor interest in AI token projects remains sluggish.
Trends of the Week
Interest rate cuts are unlikely to limit the appeal of tokenized Treasuries.
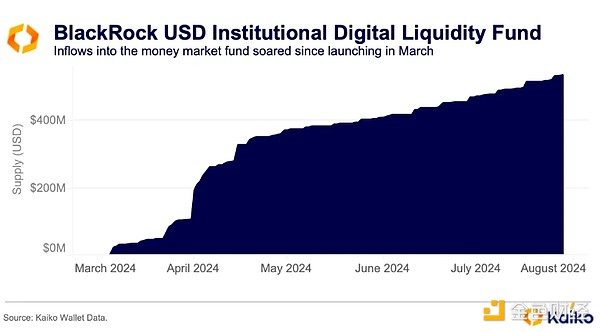
BlackRock’s on-chain tokenized fund BUIDL (BlackRock USD Institutional Digital Liquidity Fund) is one of many funds launched in the past 18 months that provides exposure to traditional debt instruments such as US Treasuries. It has quickly become the largest on-chain fund by assets under management (AUM). The fund was launched in March 2024 in partnership with Securitize and has attracted more than $520 million in inflows to date.
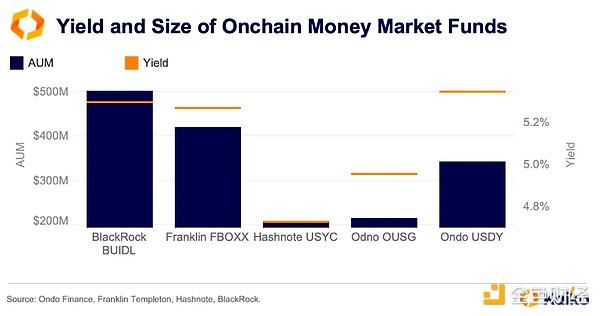
Most of these funds invest in short-term U.S. debt instruments. Other top funds include Franklin Templeton's FBOXX, Ondo Finance's OUSG and USDY, and Hashnote's USYC. Each fund's yield is in line with the federal funds rate.
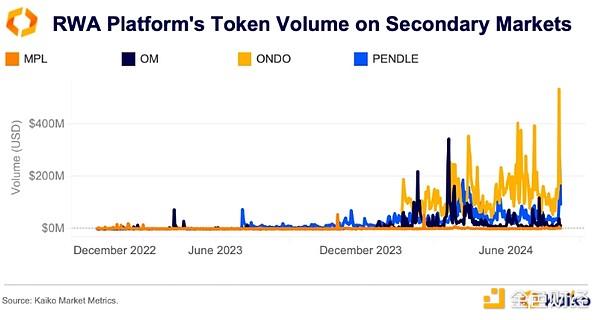
As hype around these tokenized funds has grown, both on-chain flows and secondary markets for the associated tokens have seen an uptick in activity. Ondo Finance’s governance token, ONDO, has experienced the largest surge in trading, coinciding with the announcement of its partnership with BlackRock’s BUIDL. ONDO’s price hit an all-time high of $1.56 in June, on the back of surging BUIDL inflows and growing interest in on-chain funds. However, hype has since faded, and inflows may face headwinds as the U.S. interest rate environment changes.
Since the Aug. 5 sell-off, the narrative has intensified that the Fed is behind the curve and needs to cut rates more aggressively to avoid a recession, with markets now pricing in 100 basis points of rate cuts this year.
Last week's weaker-than-expected U.S. inflation data reinforced expectations of a rate cut in September. However, a rate cut does not necessarily mean loosening monetary policy. If the Fed cuts nominal interest rates, but inflation falls at the same or faster pace, real interest rates (nominal interest rates adjusted for inflation) may remain stable or even rise.
Indeed, even as the Fed has held nominal rates steady, the real federal funds rate, adjusted for the producer price index (PPI) – a measure of business pricing power – has risen modestly this year.
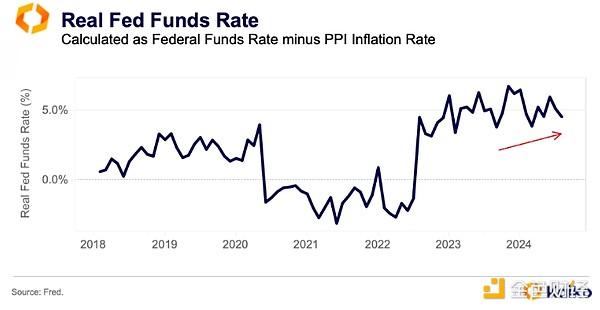
If real interest rates remain stable, the potential stimulus effect of the Fed's rate cuts may be weaker than expected. In this case, U.S. Treasuries may still be attractive compared to risky assets because investors may prefer liquidity and safety over risk.
Data worth noting
The impact of a sharp drop in Ethereum gas fees on supply.
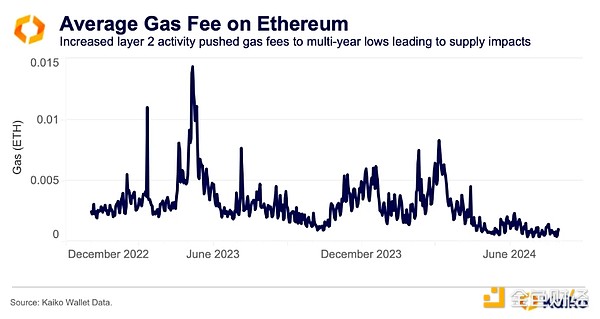
Ethereum’s gas fees recently hit a five-year low, driven by increased Layer 2 activity and the March Dencun upgrade, which reduced Layer 2 transaction fees. This fee reduction has an impact on ETH, as lower fees mean less ETH is burned, increasing the token’s supply. As a result, ETH’s total supply has been rising consistently since April. Despite demand drivers such as the spot ETH ETF, this growing supply could dampen potential price gains in the short term.
AAVE mortgage demand cools.
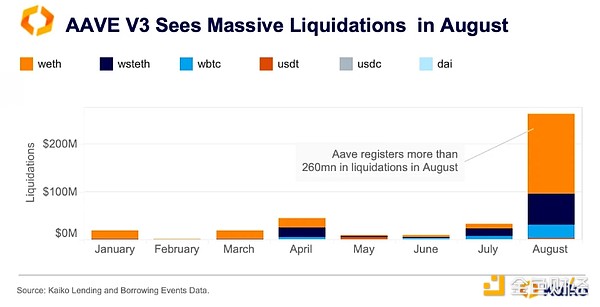
Demand for collateralized loans on Aave V3, the largest DeFi lending protocol by TVL, cooled in August after more than $260 million in liquidations occurred during the cryptocurrency price crash and market-wide sell-off that began on August 5.
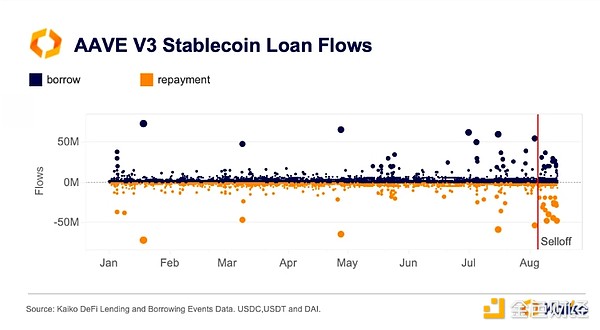
Aave V3 recorded net inflows between May and July, with borrowings exceeding repayments. In July, stablecoin borrowings hit a year-to-date high of $1.4 billion, while repayments totaled $1.2 billion, bringing net inflows to around $200 million. However, following the recent sell-off, this trend has reversed, with net outflows exceeding $200 million since the beginning of the month.
AI crypto tokens are merging efforts to reignite market interest.
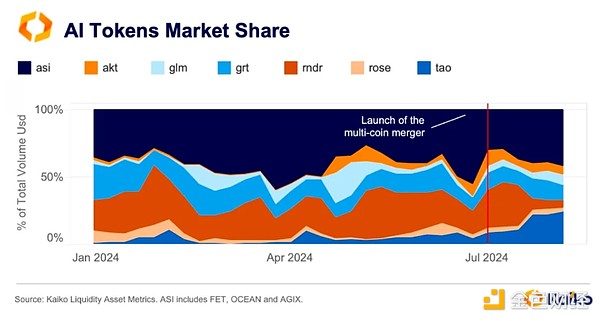
Last month, three major AI-focused crypto projects — Fetch.AI, SingularityNET, and Ocean Protocol — launched the first phase of merging their native tokens into a single token, called the Artificial Intelligence (ASI) Token. The merger was originally announced in March as part of a broader plan to develop a new AI platform that would provide a “decentralized alternative to existing AI projects controlled by large tech companies.”
Since July, the combined market share of SingularityNET’s AGIX, Ocean Protocol’s OCEAN, and Fetch.AI’s FET tokens has risen from 30% to 40%. However, our tick-by-tick data shows that this growth was primarily driven by increased selling, suggesting that traders view the consolidation as a risky event.
Overall demand for AI tokens has fallen dramatically since the start of Q2. Weekly trading volumes plummeted to $2 billion in early August, a six-fold drop from multi-year highs of more than $13 billion in Q1.
AI-related crypto tokens are associated with projects that use AI to improve security, user experience, support decentralized exchanges, or provide image and text generation services. However, their 60-day correlation with chipmaker Nvidia (NVDA), which is widely considered a bet on a potential AI-related boom, has been weak. Currently, the correlation hovers around 0.1-0.2, down from a peak of 0.3-0.4 in March. In contrast, their correlation with Bitcoin remains strong, ranging from 0.5 to 0.7 as of early August, indicating that traders view these projects as high-beta crypto bets.
FDUSD’s market share on Binance hit an all-time high.
At the end of July, the stablecoin FDUSD hit an all-time high of 39% market share on Binance, reversing a downward trend that had persisted over the past three months. This growth is notable because the exchange reintroduced zero commissions on FDUSD trading pairs for regular and VIP-1 users back in April.
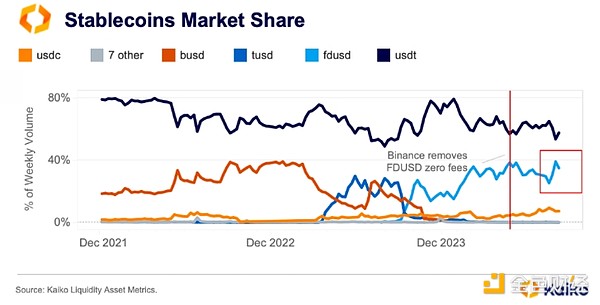
A closer inspection of the tick-by-tick data shows that the surge in FDUSD volume was primarily driven by increased buying of Binance’s four main FDUSD-denominated pairs, as well as rotation into other stablecoins, notably Tether’s USDT.
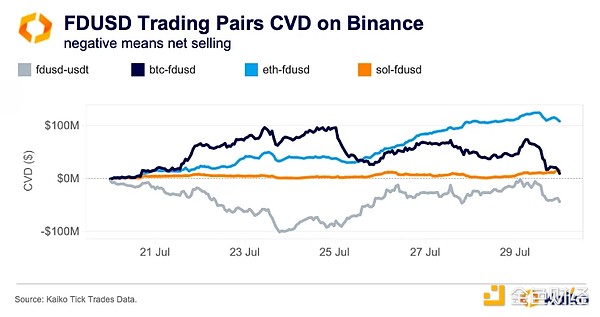
This is particularly interesting because Bitcoin saw a strong sell-off in Binance’s USDT markets during the same period (not charted).
The Hong Kong-regulated First Digital USD (FDUSD) was launched in June 2023 and soon after began trading on Binance with no maker or taker fees. By 2024, its daily trading volume had soared to an average of $6.5 billion, more than six times the volume of the second-largest stablecoin, USDC ($1 billion). However, FDUSD’s success was largely dependent on Binance, as it was traded exclusively on the platform and was closely tied to its fee policy.
Japanese markets led the cryptocurrency sell-off.
The Bank of Japan’s interest rate hike in late July was a precursor to a surge in financial market volatility in August. Cryptocurrency markets plunged along with stocks as the changing interest rate environment in Japan and poor economic data from the United States spooked investors.
The fallout from the first weekend of August hit the cryptocurrency market immediately. BTC fell more than 12% over the weekend, dropping below $50,000 by Monday morning European time. During the sell-off, trading volumes on Japanese cryptocurrency exchanges surged, especially Bitbank and Bitflyer, reaching their highest point since Bitcoin hit a new high in early March.
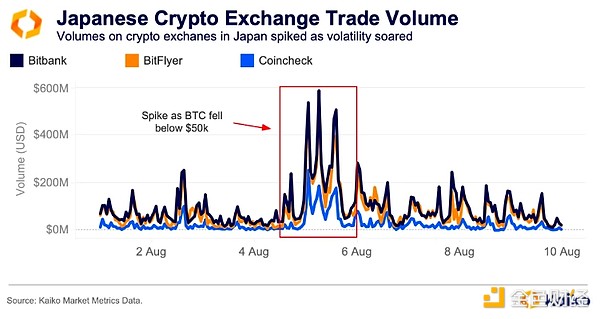
The surge in volume was driven primarily by activity in the BTC-JPY market, followed by ETH-JPY and XRP-JPY. However, the Japanese cryptocurrency market saw an interesting surge in ETH’s share of volume on Saturday evening, Japan time, which at one point accounted for more than 30% of volume. The surge in volume occurred the day before most of the volatility, coinciding with a panic over reports that Jump Trading had begun liquidating its ETH positions.
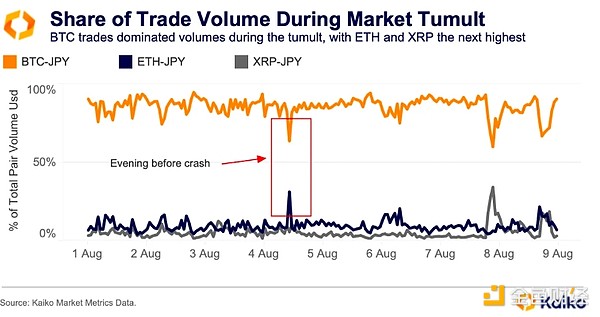
What is the reasoning behind the preemptive moves by the Japanese market relative to the US and other major regions? A large part of the volatility in early August was related to the yen carry trade.
The carry trade involves traders borrowing an asset (in this case, the yen) at a low interest rate and reinvesting it in a higher-yielding asset, such as U.S. Treasuries. Given that Japanese investors are the largest non-U.S. investor group in U.S. Treasuries, most likely invest in both assets at the same time. This investment comes at a time when the likelihood of a rate hike by the Bank of Japan and a rate cut by the Federal Reserve is soaring.
Carry trades work best when markets are stable, so when the Bank of Japan raised interest rates for only the second time since 2007, the trade suddenly lost its appeal.


