Solana (SOL) has been trading within a horizontal channel on the 4-hour chart since early September. However, it broke through this channel over the weekend and rose to $140.
Unfortunately, this breakout was short-lived and SOL soon returned to the channel, indicating a fake breakout.
Solana ‘Fake Breakout’… Confuses Investors
Solana has been trading within a horizontal channel since early September . This pattern occurs when the price of an asset moves within a defined range, where the upper line represents resistance and the lower line represents support.
On September 13, SOL briefly broke above the $138.12 resistance level, suggesting a possible continuation of the uptrend. However, after peaking at $139.78, the price reversed course and fell back into the channel.
This move is known as a false breakout, where the asset deviates from the trend and then quickly reverses and returns to its original path. Investors who act on these false signals can suffer losses, especially if they took positions in anticipation of a sustained breakout.
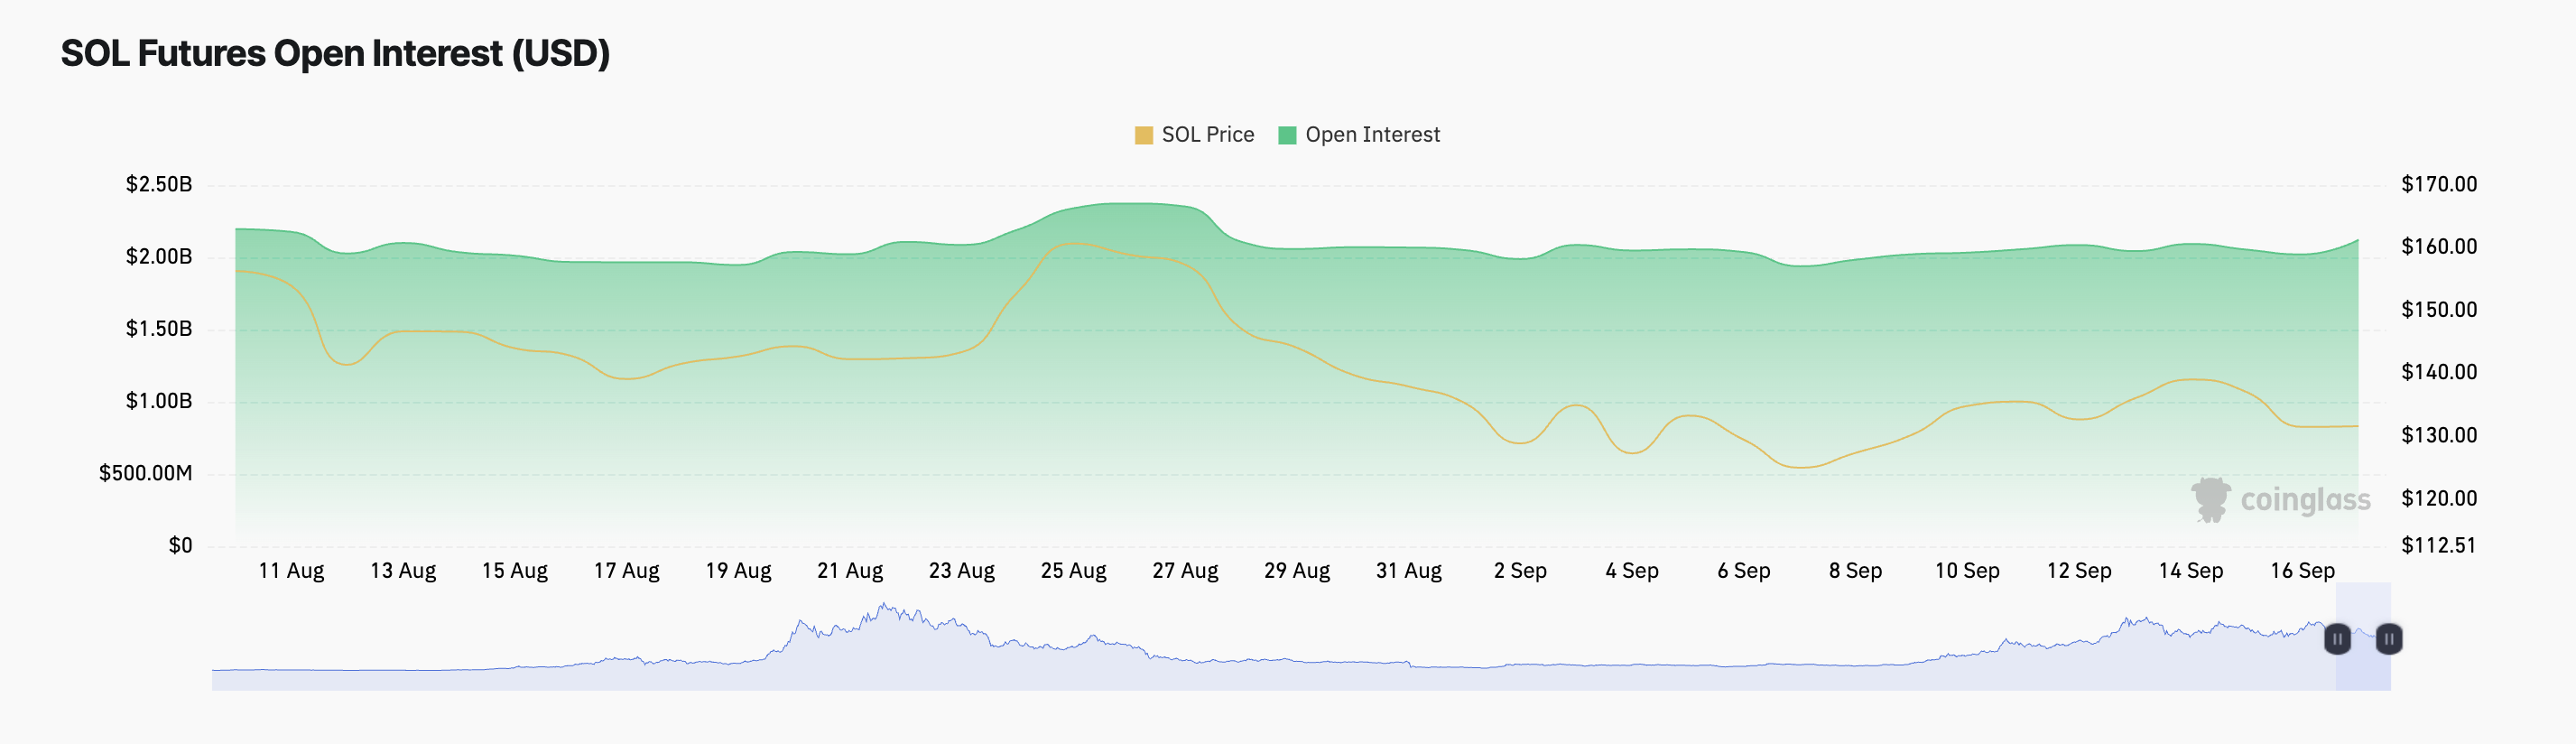
After the fake breakout, Solana (SOL) has seen increased activity in the derivatives market. This is reflected in the increase in futures open interest. SOL's futures open interest is now $2.12 billion, up 3% since September 13.
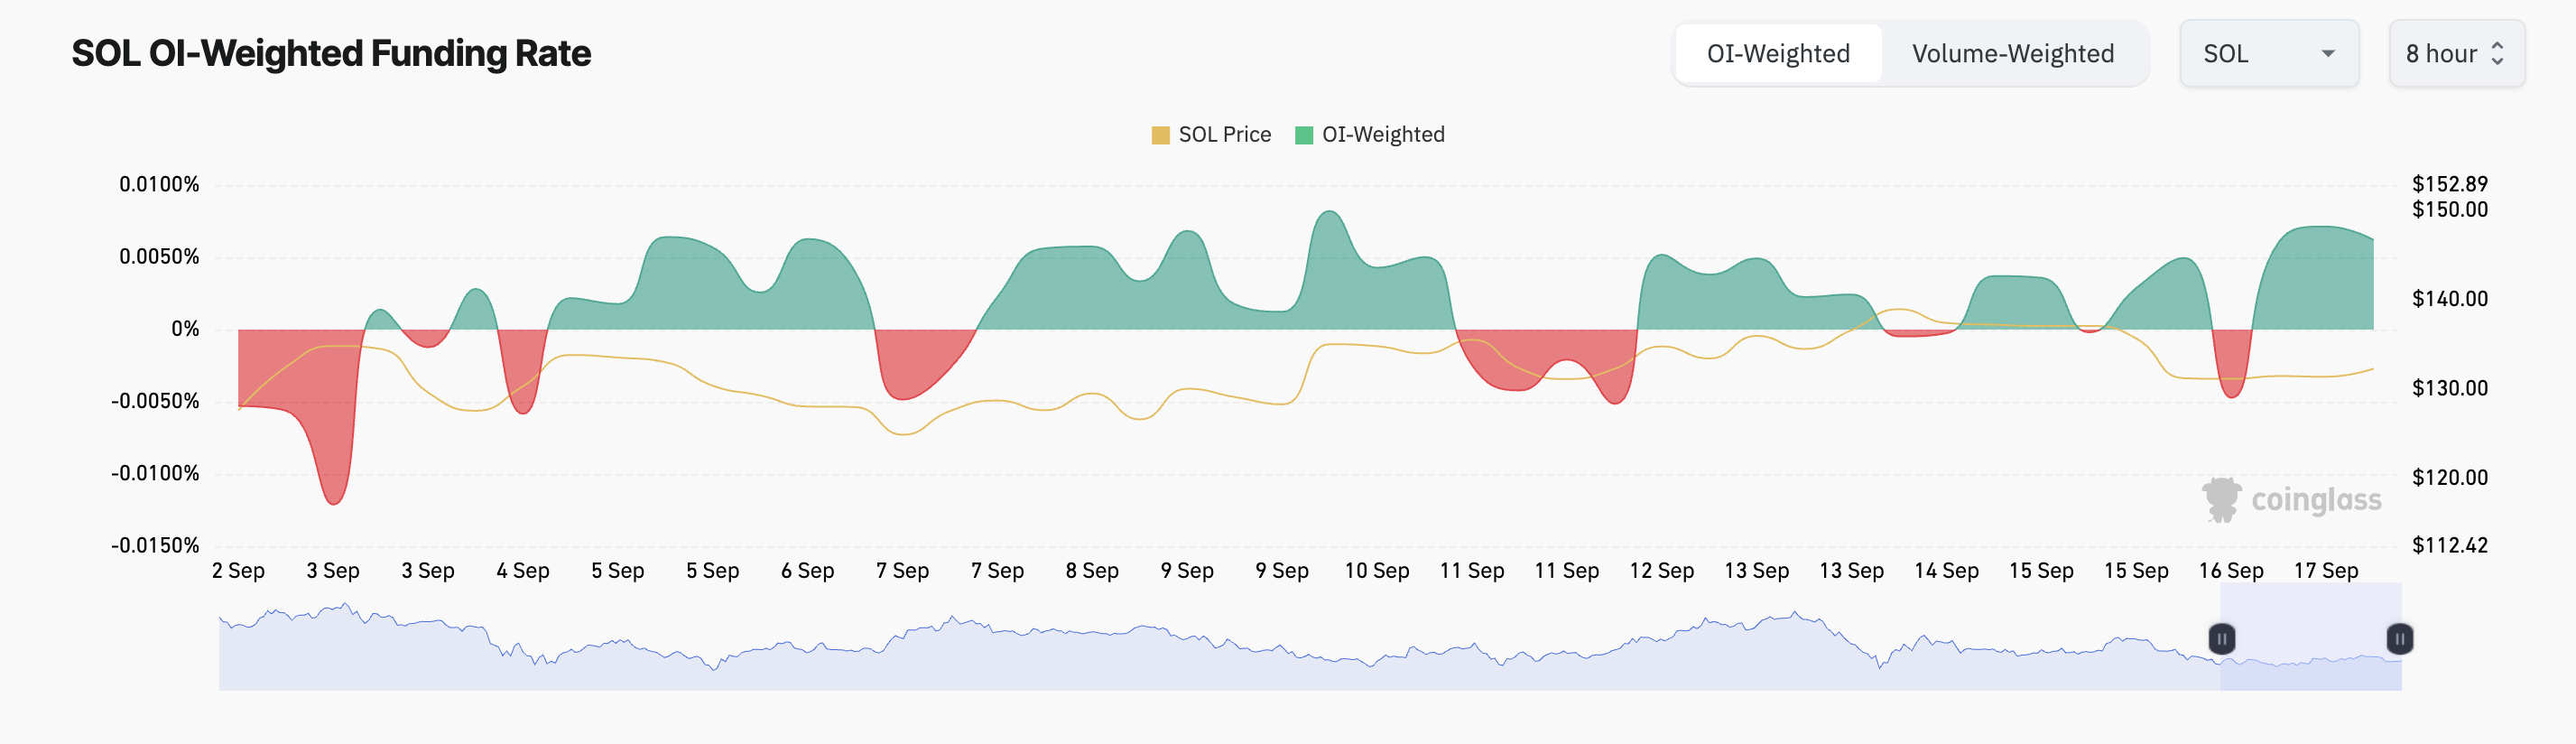
Additionally, SOL futures traders remain positive despite the recent price decline. According to Coinglass data, the coin’s funding rate has remained mostly positive since last weekend.
Currently, the funding rate of SOL is 0.0062% , which means more traders are longing in anticipation of a price increase. They are expecting a rally rather than shorting altcoins in anticipation of a price decrease.
Read more: 11 Solana Meme Coins to Watch in August 2024
SOL Price Prediction: Long Traders Beware
The technical outlook for SOL on the 4-hour chart suggests a long-term downside. The Elder-Ray Index measures the difference between bullish and bearish forces and has been consistently negative since September 15, indicating that sellers are in control of the market.
Further supporting this bearish sentiment, the Directional Movement Index (DMI) shows that the negative directional indicator (red) for SOL is higher than the positive directional indicator (blue), suggesting that the market is currently experiencing negative momentum, which is outweighing any buying pressure.
Read more: Solana (SOL) Price Prediction 2024/2025/2030
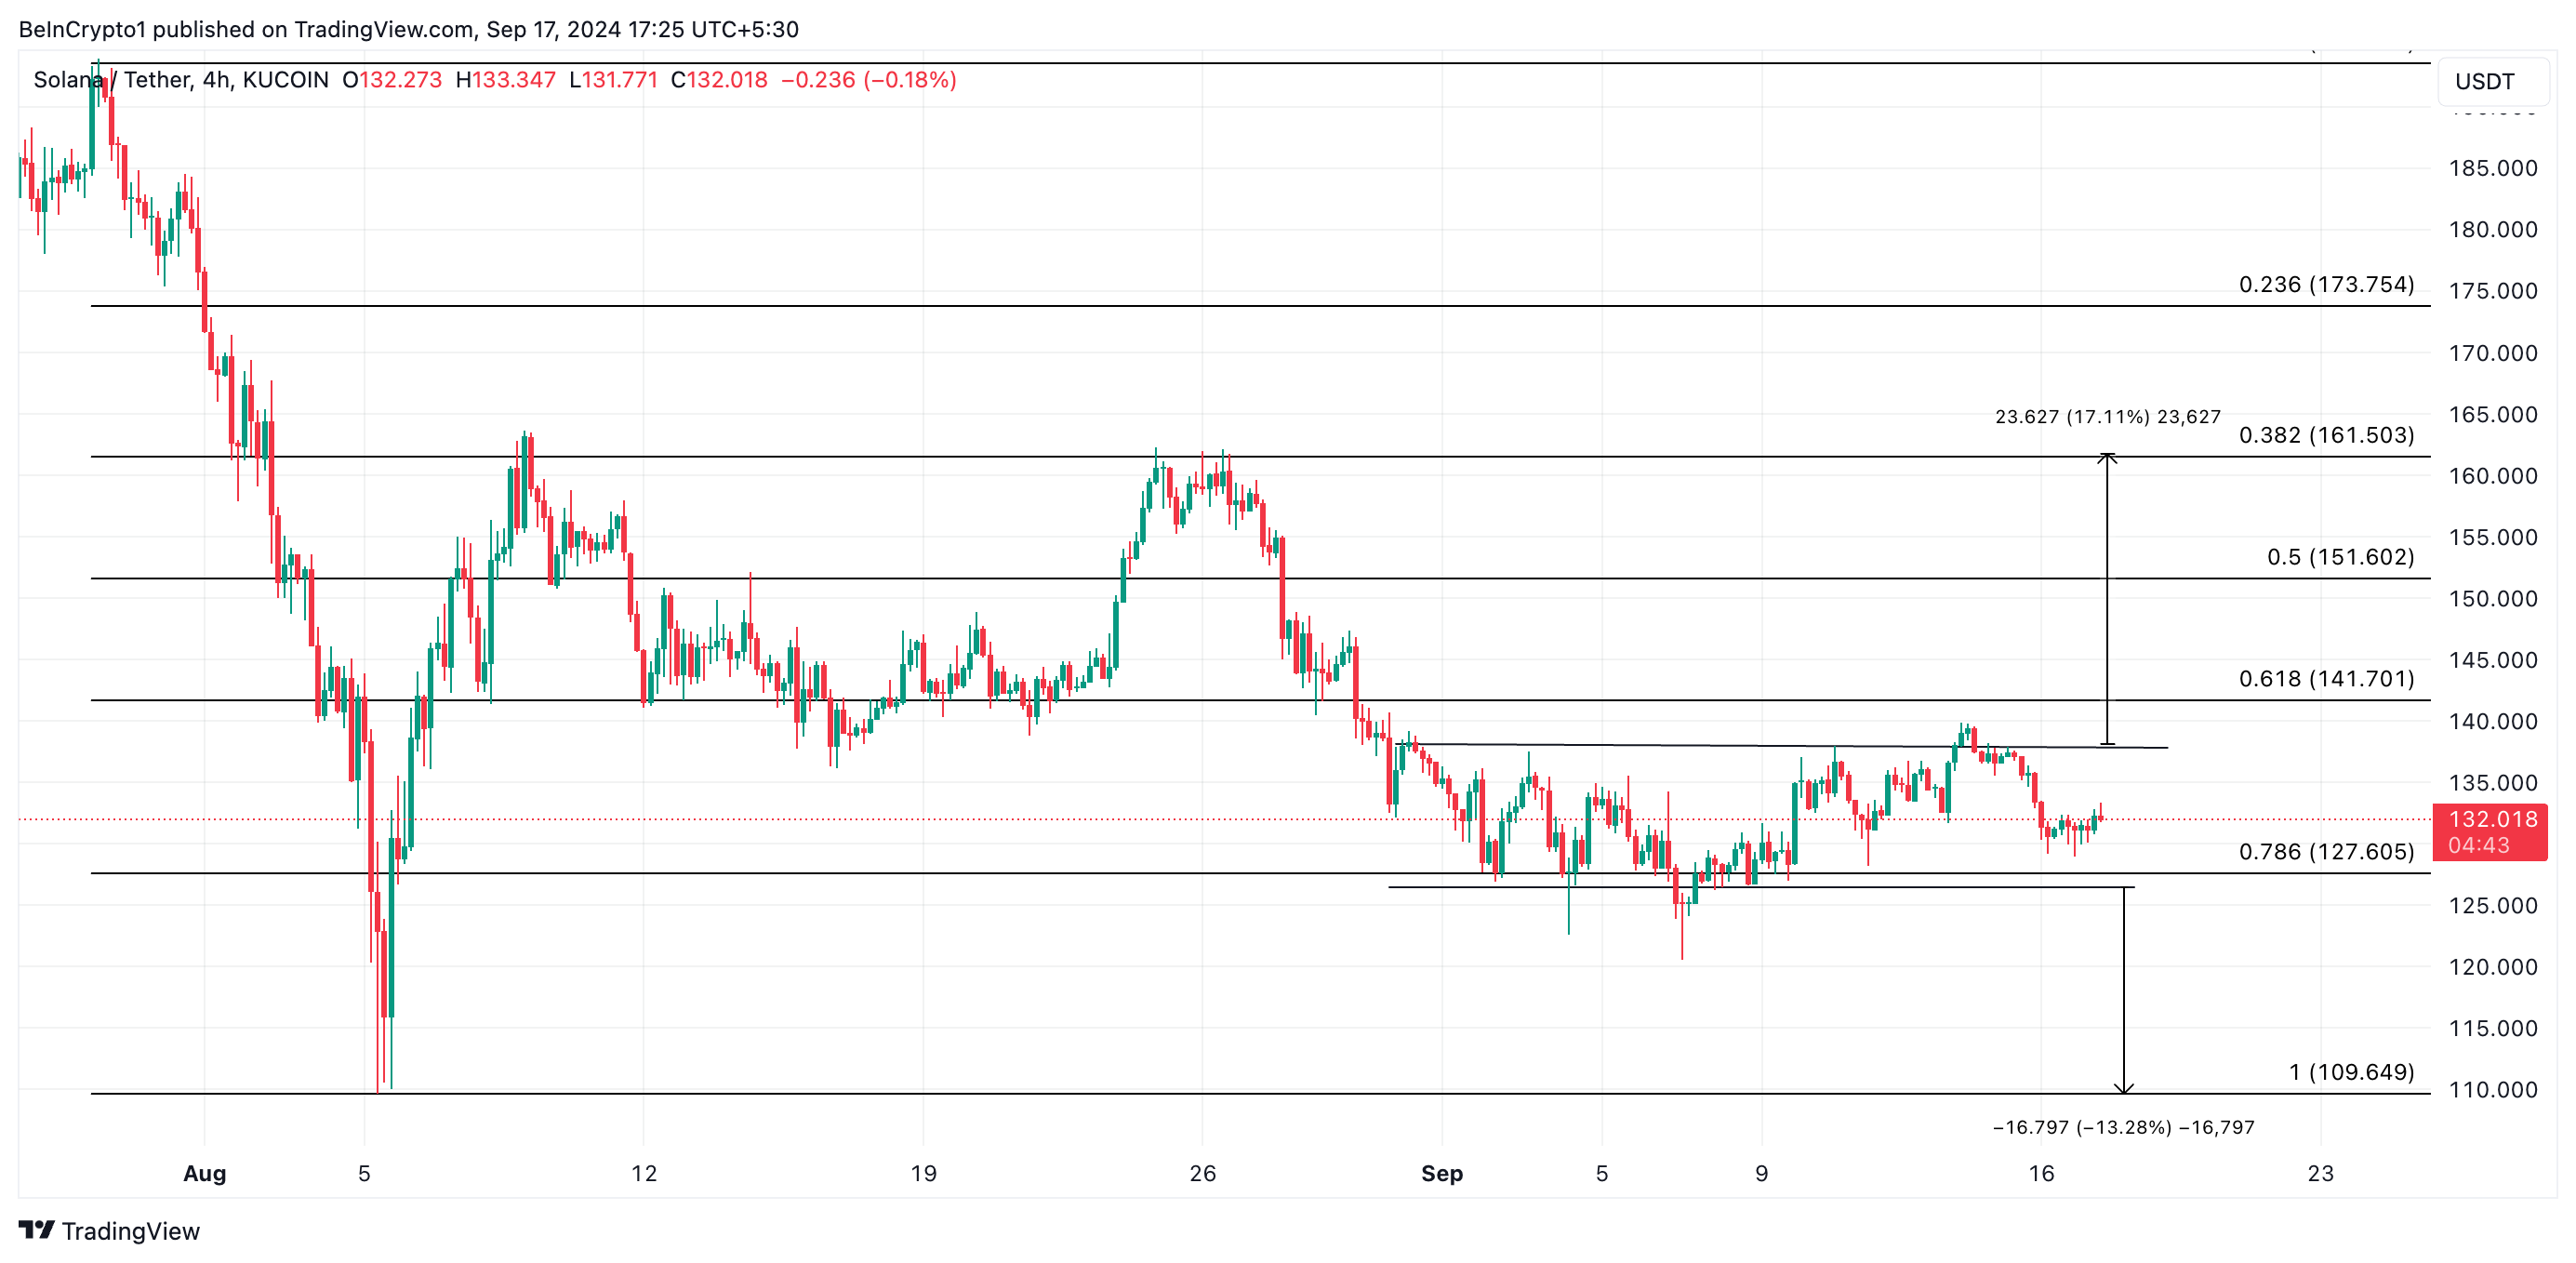
If this downtrend continues , Solana's price could drop below the current support level of $126.46 . It could drop another 13% to trade at $109.64. However, if the altcoin sees renewed demand, it could retest the resistance level, and if successful, it could rally to $161.50.