

Major altcoin Ethereum (ETH) is seeing a resurgence of bullish sentiment, which comes at a time when Bitcoin (BTC) dominance is weakening, suggesting that investors are shifting their attention to ETH and other altcoins.
As ETH accumulation stabilizes, the coin could set the stage for trading above $2900.
Ethereum surprisingly shows good upward potential compared to Bitcoin
Ethereum is up 13% in the past week , while Bitcoin is up only 6% over the same period. The ETH/BTC ratio is also continuing its upward trend, up 33% over the past 7 days. This shows that the preference for Ethereum is increasing over Bitcoin. The ETH/BTC ratio is currently at 0.04.
Read more: Ethereum Restaking: What Is It and How Does It Work?
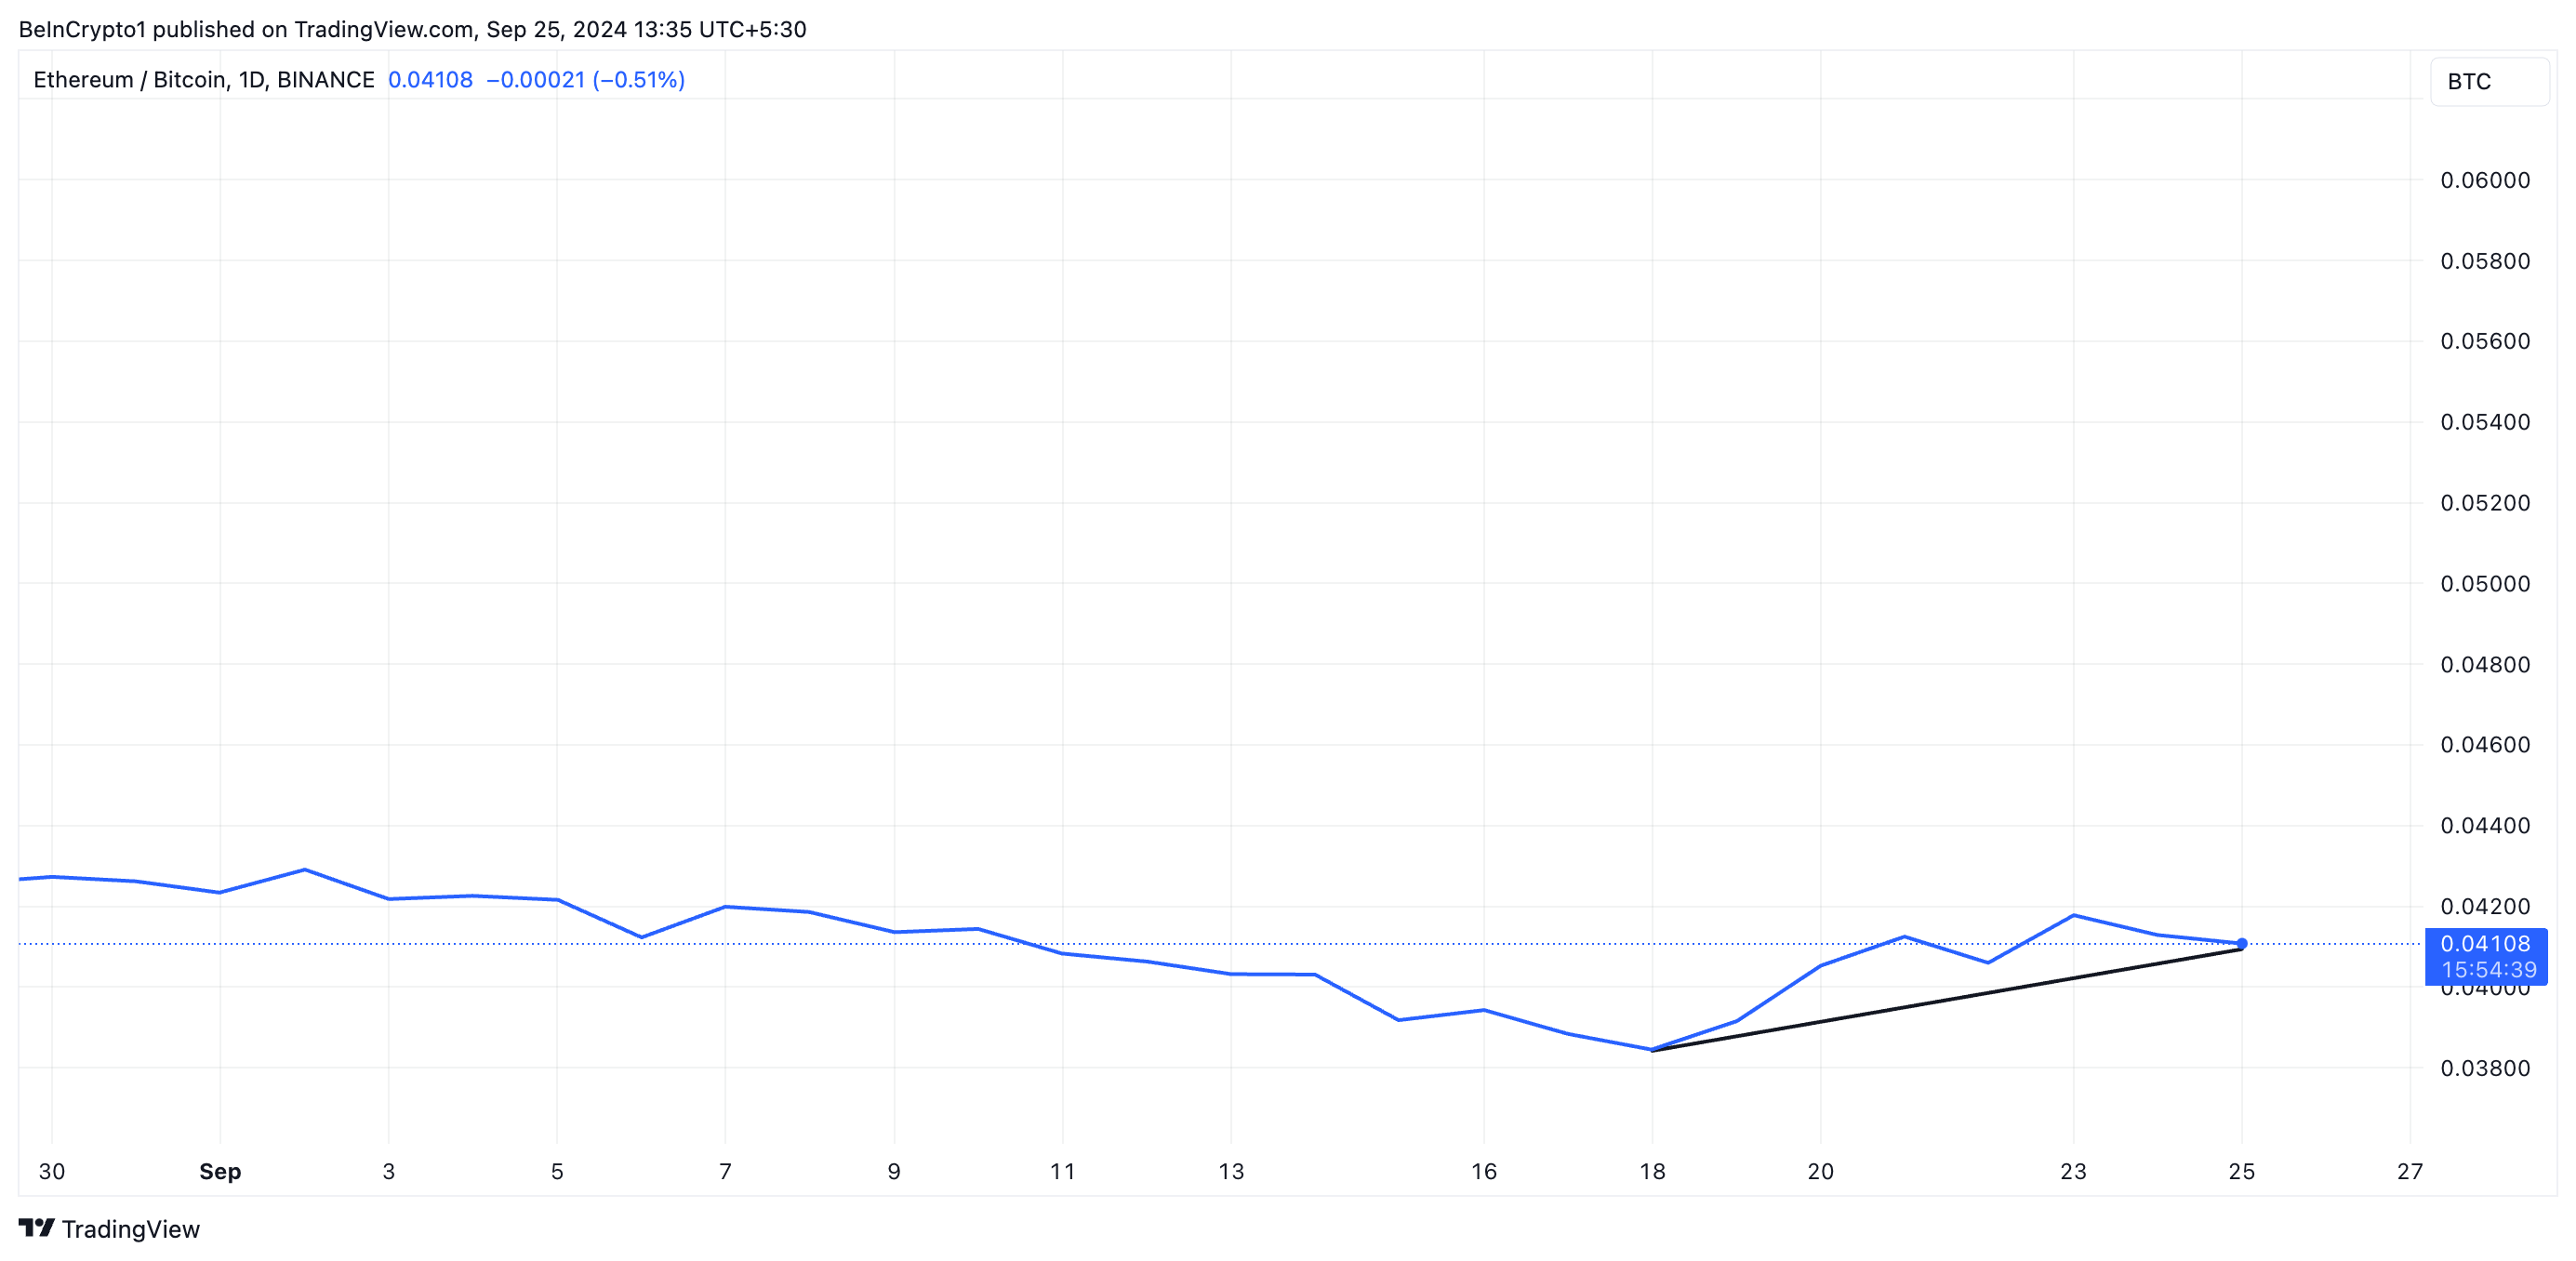
The ETH/BTC ratio measures the strength of Ethereum relative to Bitcoin. A rising ratio indicates that ETH is outperforming BTC, which is a bullish signal for Ethereum.
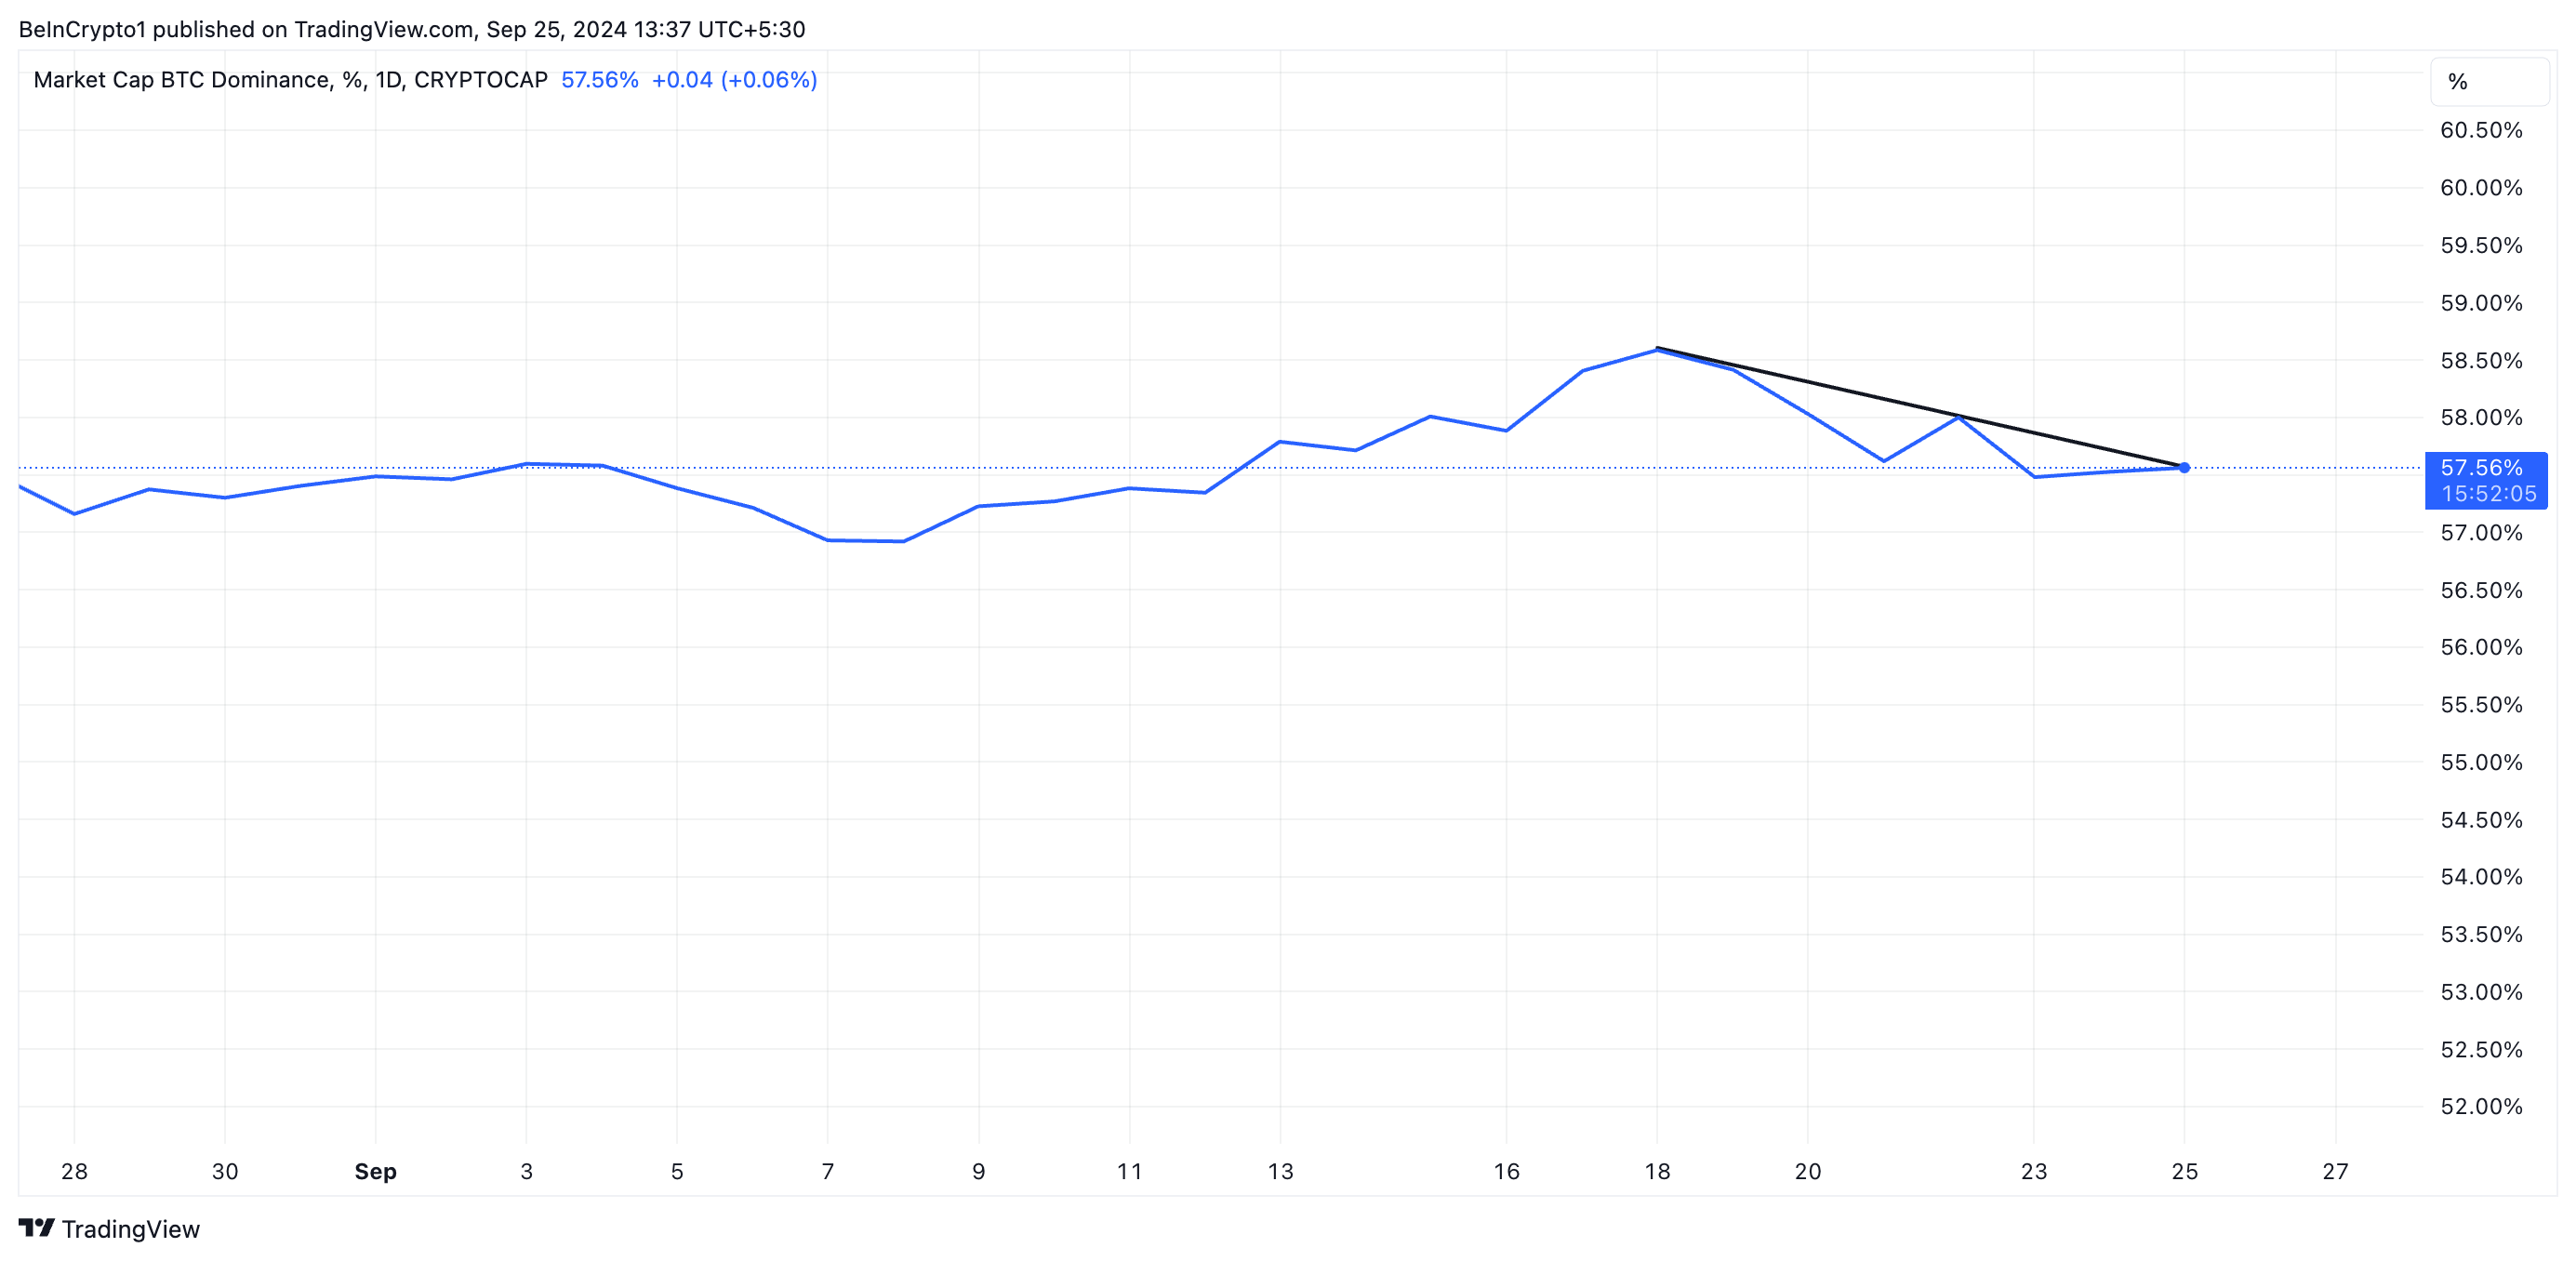
The rise in the ETH/BTC ratio coincides with a decline in Bitcoin Dominance (BTC.D), which measures Bitcoin’s share of the overall cryptocurrency market cap. It currently stands at 57.56%, down 0.01% over the past week. A decline in Bitcoin dominance often signals increased interest in altcoins.
The recent surge in Ethereum value has been driven in part by increased activity from large holders, or whales. On-chain data shows a steady increase in significant transactions involving ETH over the past month.
For example, the number of ETH transactions between $1 million and $10 million has increased by 14% over the past 30 days, while transactions over $10 million have surged by 21% over the same period.
An increase in large trades often signals bullish momentum. When retail investors observe active activity among whales, their confidence increases, which in turn leads to more buying, sustaining the price increase.

ETH Price Prediction: Bulls Are In Control
Ethereum’s Directional Movement Index (DMI) supports the bullish outlook highlighted above. The coin’s DMI currently has positive directional indicators (blue) higher than negative directional indicators (red).
Read more: How to Buy Ethereum (ETH) with a Credit Card: The Complete Guide
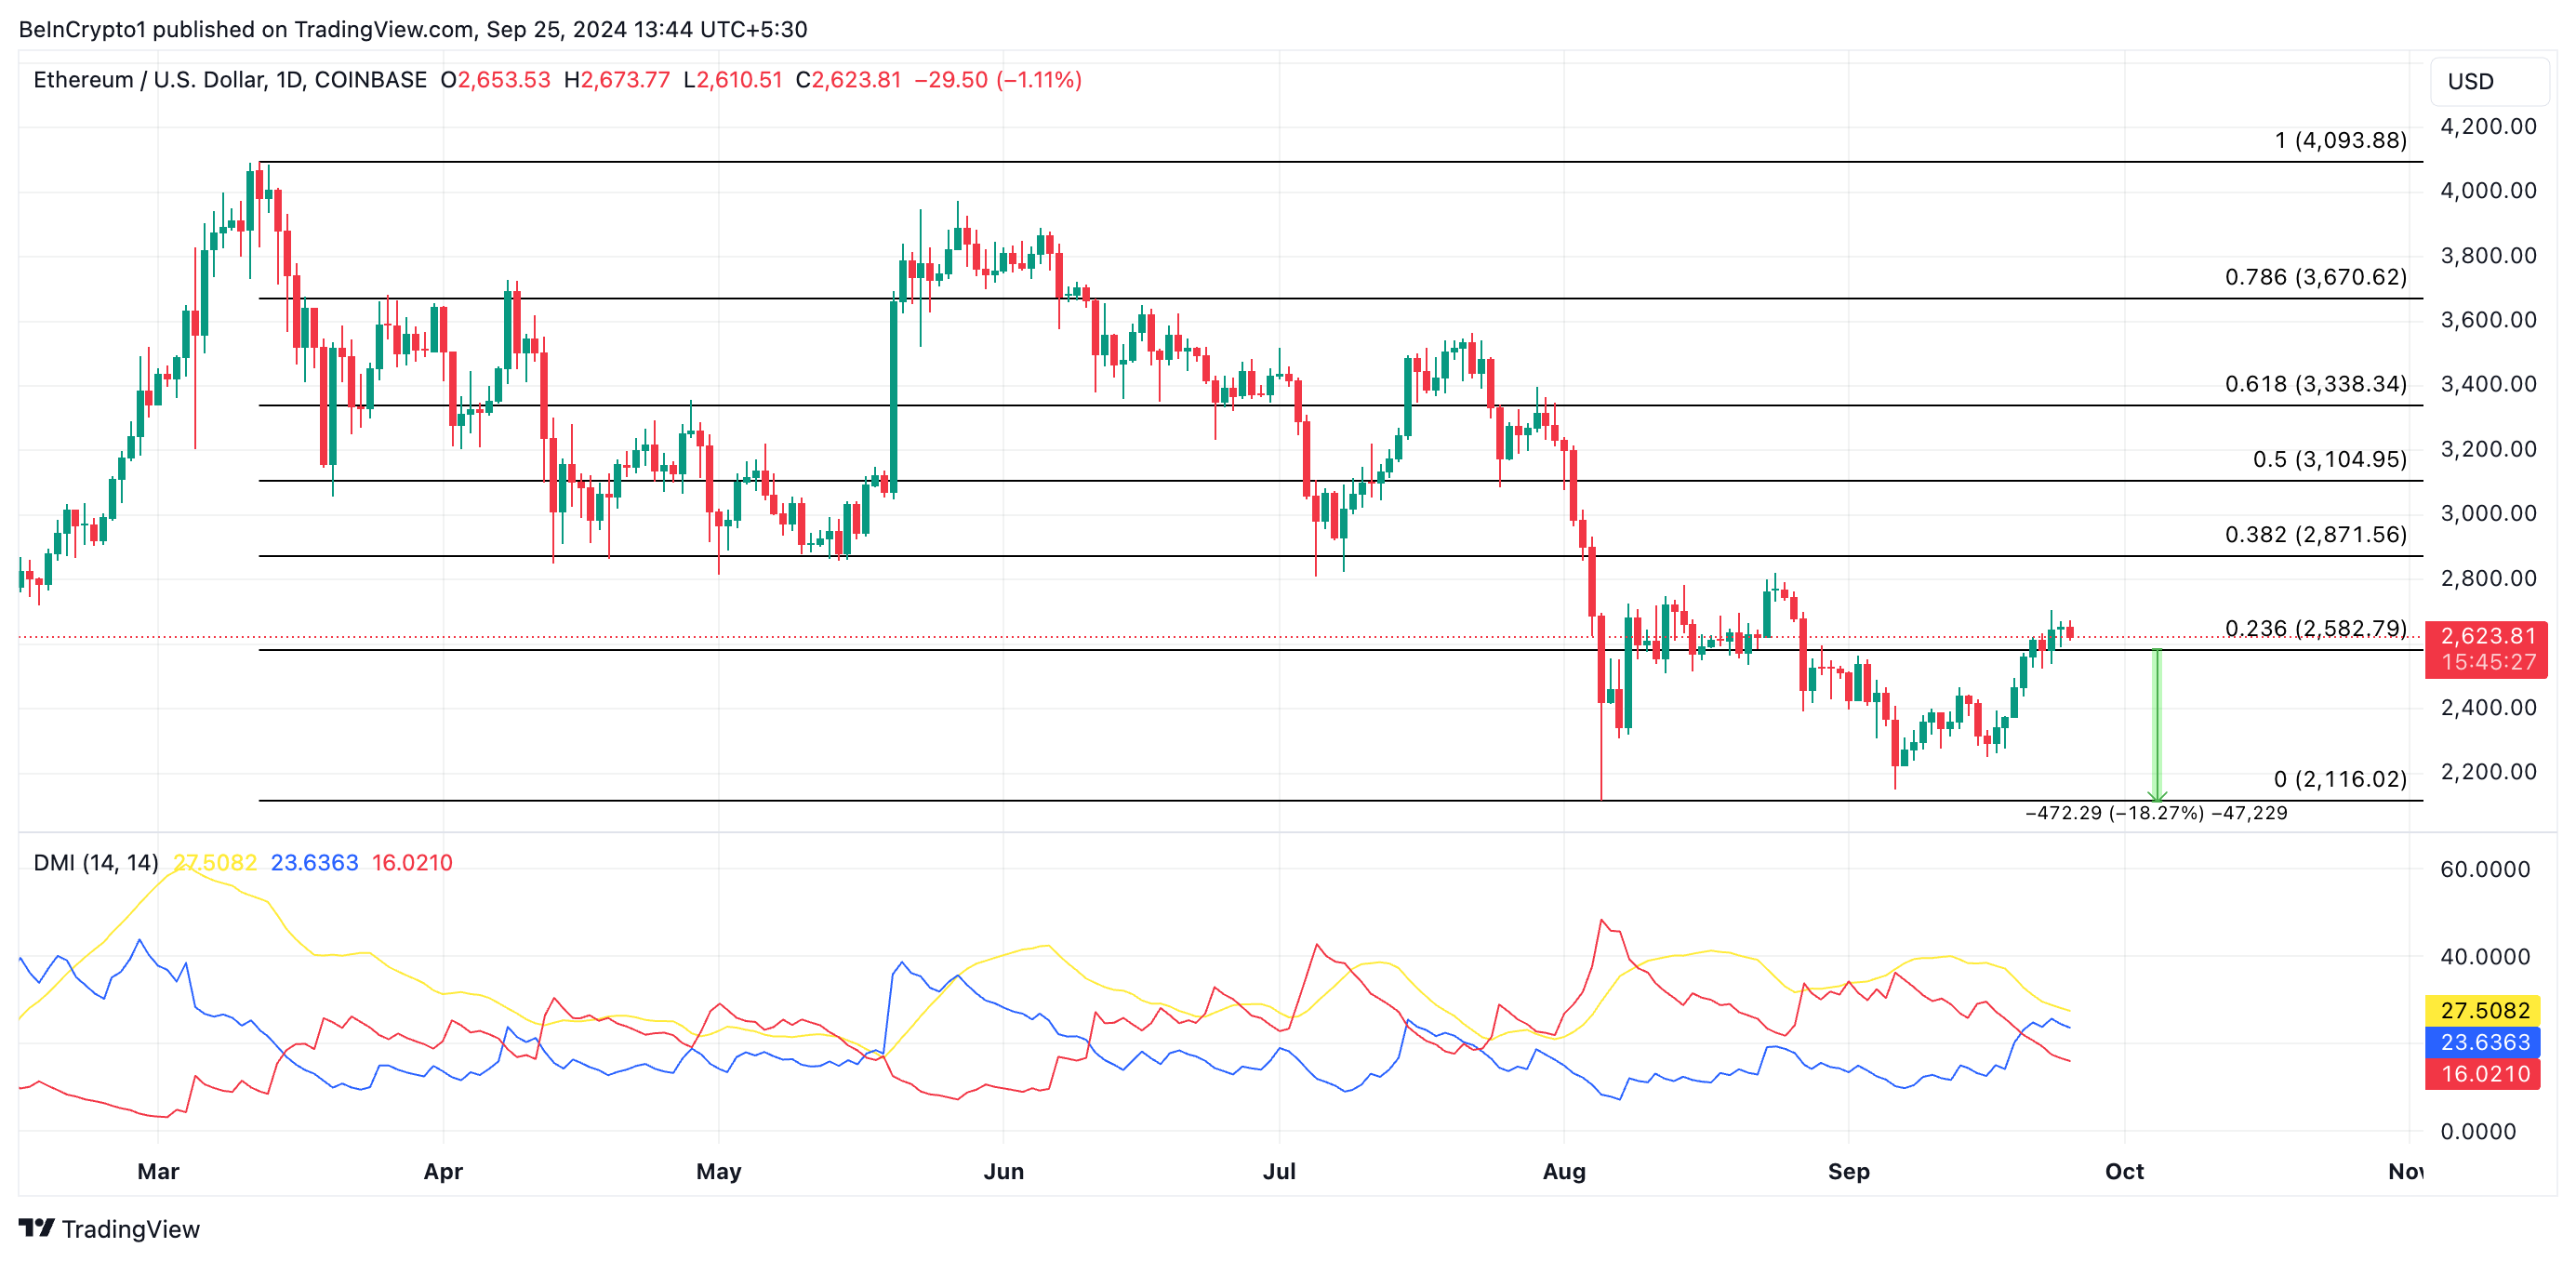
If demand continues to increase, Ethereum could break above the $2871 resistance, which could push the price above $2900 and potentially to $3104. However, if accumulation slows down and profit taking increases, ETH price could fall to the $2582 support or lower.


