Professional investors are beginning to embrace the idea that Ethereum could host popular applications in the future, but for many, the investment case for its underlying asset, ETH, remains largely unclear. Unlike traditional assets with clear valuation methods, most crypto assets, such as ETH, lack well-known fundamentals. So when the Ethereum community successfully sparks investor curiosity and expresses their vision of growing popularity, it raises a key question: How does popularity translate into investment potential? What impact does popularity actually have on the long-term supply and demand of ETH?
Late last year, we attempted to answer these questions. We examined the mechanics of Ethereum, exploring how protocol rules and user interactions work together to influence the supply and demand equation for ETH. We ignored analogies and ideological explanations and focused on the measurable factors that directly affect the value of ETH, and the relative importance of each factor.
The analysis leads us to a key insight: the primary driver of ETH’s value is demand for Ethereum transactions — not staking yields , currency adoption, financial collateral , or anything else. Interestingly, this is determined by how much users are willing to spend for the services Ethereum provides.
While we believe this is an important step forward, it also raises more questions. If transaction fees should be a focus for long-term investors, what use cases on Ethereum drive fee spending? What categories of use cases will drive fee spending in the future? How sensitive is each Ethereum service to transaction costs?
This report aims to answer these follow-up questions, or bring us closer to answering them.
We will present the results of a new model that categorizes and aggregates Ethereum transaction data over time, allowing us to see how much money users spend on different services (such as market exchanges and stablecoin transfers), as well as the main projects driving such transactions. In other words, we will analyze Ethereum usage in its entirety, but in terms of how much money users actually spend.
Finally, we hope to further the discussion of reasonable investment strategies for Ether. This time, by measuring what Ethereum users have been trying to achieve, hopefully our answers will bring us closer to imagining or even estimating its future uses.
Ethereum usage is primarily driven by application interactions and token transfers
Since its inception, Ethereum’s usage has evolved significantly. Initially, Ethereum was primarily used as a venue for simple asset transfers, a fundamental use case that remains important but has since been overshadowed by more complex interactions with applications and infrastructure.
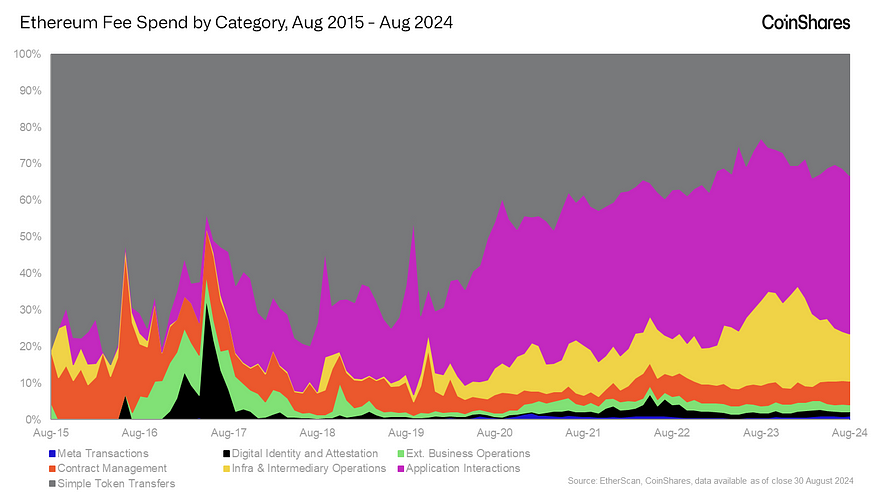 Early on, Ethereum was envisioned as a "world computer" - a platform capable of executing any type of custom instructions and hosting globally accessible, unstoppable applications. To achieve these lofty goals, Ethereum developers prioritized flexibility and accessibility as protocol properties, relying on crowd-sourced complexity to iterate on the platform design and deploy useful projects.
So, given its global reach, it’s perhaps unsurprising that Ethereum has grown into a speculative playground. It has a wide variety of bespoke digital assets and applications, as well as a growing number of additional infrastructure components that shape the overall user experience. It’s attracted a lot of user demand; total fee expenditures in the first half of 2024 were close to $1.5 billion — substantial, but significantly lower than the $3.5 billion at the peak of the bull run in the first half of 2021.
According to our data, by 2018 (the third year of Ethereum’s existence), Ethereum’s utility began to expand. Transaction fees, once used primarily for simple transfers and managing primitive smart contracts, now extend to simple applications, digital identity systems, and business operations (such as on-chain withdrawals). This trend continues with the increase in functional applications, especially in the financial and gambling fields, such as Etherdelta, Idex, and Etheroll.
At this stage, users are no longer just sending tokens, but engaging in complex multi-step interactions that take full advantage of Ethereum’s auto-execution and composability. Transactions touch many applications at once, seamlessly checking instructions in the settlement process.
Since 2020, an emerging trend has been the adoption of platform infrastructure, either created by general developers in response to user demand or by the Ethereum Foundation itself. These developments have expanded Ethereum or restructured how its underlying workings work. This includes things like protocol staking, MEV, bridges, oracles, and second-layer technologies, all of which have become integral to how the Ethereum machine works and indicate a quest for more advanced uses in the future.
On the surface, Ethereum’s ability to continually provide greater utility through more complex transactions is good for demand for ETH. However, the harsh reality is that a small number of services have always accounted for the majority of Ethereum usage, and these services are primarily centered around speculation or simple value transfers, not necessarily the types of complex “real world utility” use cases that Ethereum Foundation developers originally envisioned.
Now that we’ve looked at the big picture, let’s look at each of the main usage categories and which subcategories and/or specific projects are driving this activity.
Application interactions are mainly driven by the market, especially Uniswap
As the Ethereum ecosystem has grown, the types of applications that users use have become increasingly diverse. However, one category of applications has always dominated: digital asset exchanges. Specifically, marketplaces where users trade long-tail crypto assets, including collectible and fungible crypto assets.
For its first two years, Ethereum was little more than an experimental playground, with developers testing the platform’s capabilities through simple gambling applications like Etherdice and Rouleth. These early applications were significant because they demonstrated Ethereum’s potential to handle more than just basic transactions, laying the foundation for later complex applications.
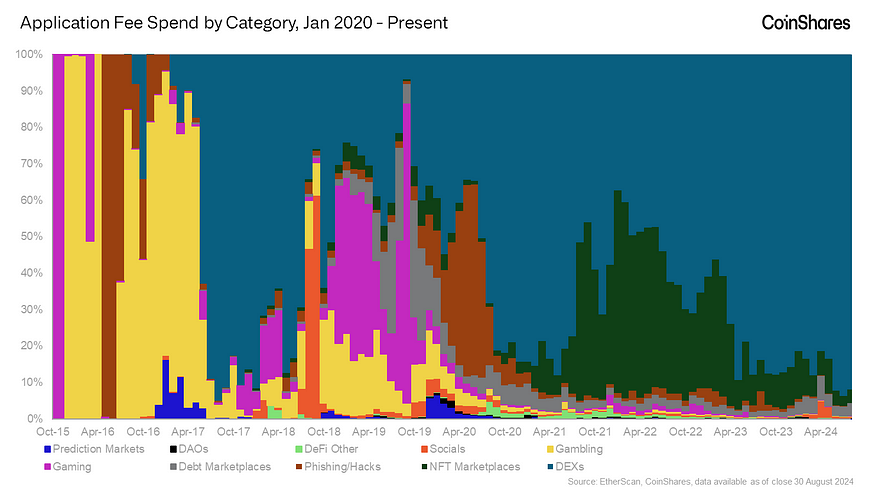 Today, over 90% of usage, measured in transaction fees, is on marketplaces. As shown above, this has been a drastic shift — with games, phishing scams, and NFT applications periodically dominating — but on-chain exchanges (often called DEXs), led by Uniswap, have more or less been the dominant use case on Ethereum since the summer of 2020.
Uniswap alone continues to capture a large portion of Ethereum transaction fees — 15% in the first half of 2024. This is a testament to the core value Ethereum provides and the ability for its users to freely speculate on digital assets such as ETH, application tokens, and stablecoins.
While NFT exchanges saw huge growth during the frenzy of 2021, their relative share of transaction fees has since fallen sharply. In the first half of 2022, OpenSea accounted for nearly half (42%) of all application transaction fees, totaling more than $500 million ($572 million). But the drop in demand was so great that fees using OpenSea in the first quarter of 2022 alone ($433 million) exceeded the total of all NFT markets since then ($296 million, Q2 2022-Q3 2024).
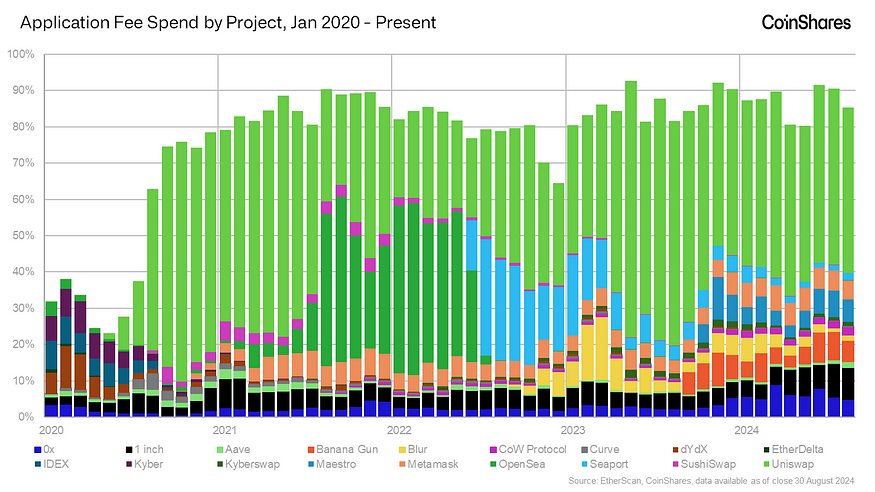 Other exchanges such as 1inch, 0x, and MetaMask have also made significant contributions to financial services as a major subcategory of application usage, and the emergence of new players such as Maestro shows that competition in this category continues and there is a persistent demand for user-friendly, liquid, long-tail trading.
While Ethereum supports a wide variety of applications, the marketplace (particularly Uniswap) is the primary driver. Clearly, being able to easily access and transparently trade assets on the same settlement system is a core component of user trading utility.
Token transfers are mainly in Ethereum and stablecoins
Another long-standing, fundamental use case on Ethereum is token transfers, which continue to play a core role in network activity. As the Ethereum ecosystem has expanded, the types of tokens transferred have diversified significantly, but Ether (ETH) and stablecoins have become the dominant assets in terms of transaction fee spending.
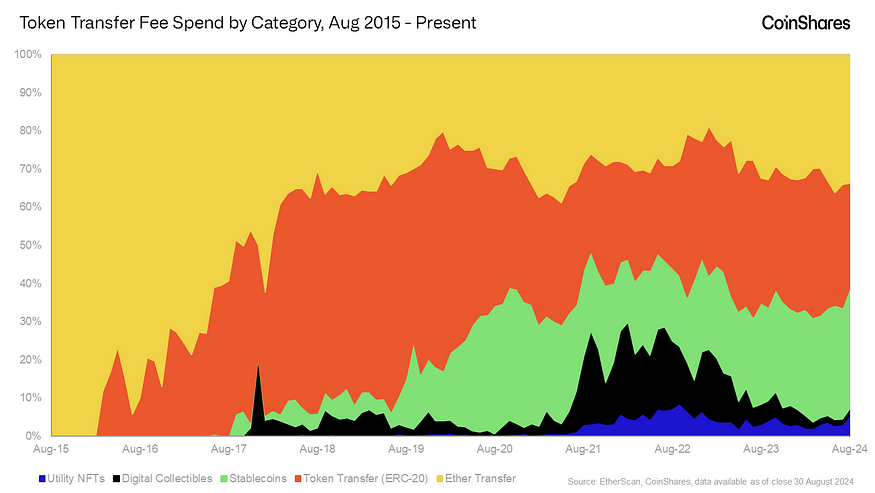 As the first and, at one point, only major asset on Ethereum, Ether naturally accounted for the majority of fees associated with token transfers. However, the introduction and eventual adoption of the ERC-20 standard in 2017 sparked a significant shift, with various new tokens minted in the Ethereum ecosystem playing an increasingly important role.
The standard, which outlined how to easily create customizable tokens, sparked an explosion in digital assets in an era often referred to as the “ICO boom.” As more tokens were created and traded, the landscape of Ethereum assets, and how much users were willing to pay to transfer them, took on new life.
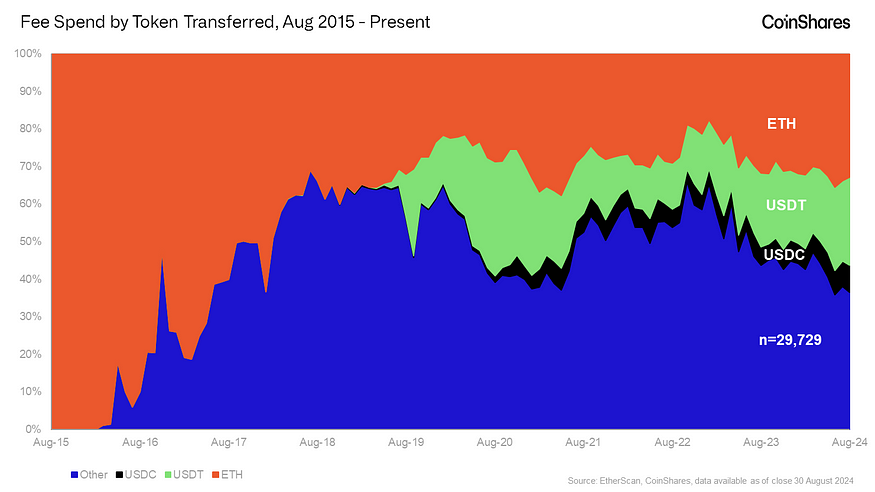 Since then, stablecoins have become a significant part of trading activity. Starting in mid-2019, Tether (USDT) began to become a widely used trading pair and a familiar medium of exchange, and the stablecoin category has only grown in influence with the launch of USDC by Circle in late 2020. In the Ethereum fee landscape, at certain times, the fees for stablecoin transfers have been comparable to or even exceeded those of ETH.
While USDT and ETH remain the most important tokens in terms of transaction fees, the broader digital asset ecosystem has introduced millions of other tokens. Many of these tokens are associated in some way with a specific application or project, thus facilitating a long tail of token transfer activity on Ethereum.
The resurgence of NFTs was greatly promoted by the release of the ERC-721 standard in 2018 and had its greatest impact in late 2021 and 2022. However, as the hype faded, so did the transactions related to transferring NFTs, resulting in a diminished, but still relevant, presence in the ecosystem.
Overall, while Ethereum transfer activity has diversified over time, Ether and stablecoins remain the primary drivers of transaction fees. This demonstrates the continued importance of ETH as the network’s native asset and the critical role stablecoins play across the industry. We believe that stablecoins are one of the most likely to continue and be the most intuitive use cases for crypto platforms to emerge over the years.
Ethereum infrastructure fee expenditures are mainly concentrated in MEV, bridges, and layer 2
Ethereum works very differently today than it did 5 years ago: who initiates transactions, how often transactions are settled, how fees work, the order of transactions, ETH’s supply policy — all of these have changed.
Some changes have been orchestrated by Ethereum’s core development team, others have arisen naturally through market forces. Take staking, for example. Before the project launched in 2015, a shift to a system that determines who settles transactions based on the amount of ETH locked up as “stake” was on the Ethereum Foundation’s roadmap. However, after launching in 2020, third-party providers became the most prominent players in the staking space due to scale requirements and the need for liquidity, settling the majority of Ethereum transactions.
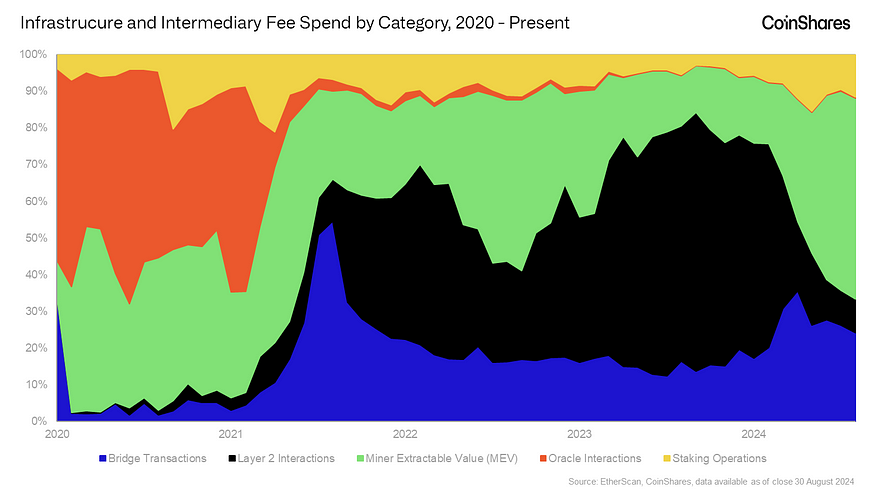 The increase in infrastructure usage since 2020 is partially attributed to staking, but more to layer 2 technologies, MEV, and bridges. Layer 2 (independently operated systems that periodically settle transactions in batches to the Ethereum base chain) dominated this category from 2022 to 2023. However, a protocol-level change to the Ethereum fee market in March (EIP-4844) reduced the cost of layer 2 settlements to almost zero (February = $41 million, June = $1.6 million).
Currently, more than 50% of infrastructure-related expenditures are related to Maximum Extractable Value (MEV). MEV refers to the value that can be exploited in the ordering of trades during the settlement process. In the most intuitive terms, MEV may mean capturing arbitrage opportunities, where profits come from the price difference between the same asset on two different exchanges. More cynically, it can be thought of as an opportunity for a trade validator to view trades before they occur and replace those that are profitable (e.g., trades executed on arbitrage opportunities) with his/her own trades.
As Ethereum continues to seek out more advanced uses and embarks on more complex changes, usage of its infrastructure may also grow. On the other hand, if the base-layer infrastructure begins to have a substantial impact on general transaction fees, as is the case with second layers, changes may have the opposite effect, with Ethereum’s core development team intentionally limiting such usage.
Ethereum spending down but still present in markets, ETH and long-tail asset transfers
So far, we’ve looked at each of the main categories of Ethereum usage and taken a deep dive into the relevant drivers within each category. Now, we’ll bring all of this together and see which specific services are in the highest demand across all segments.
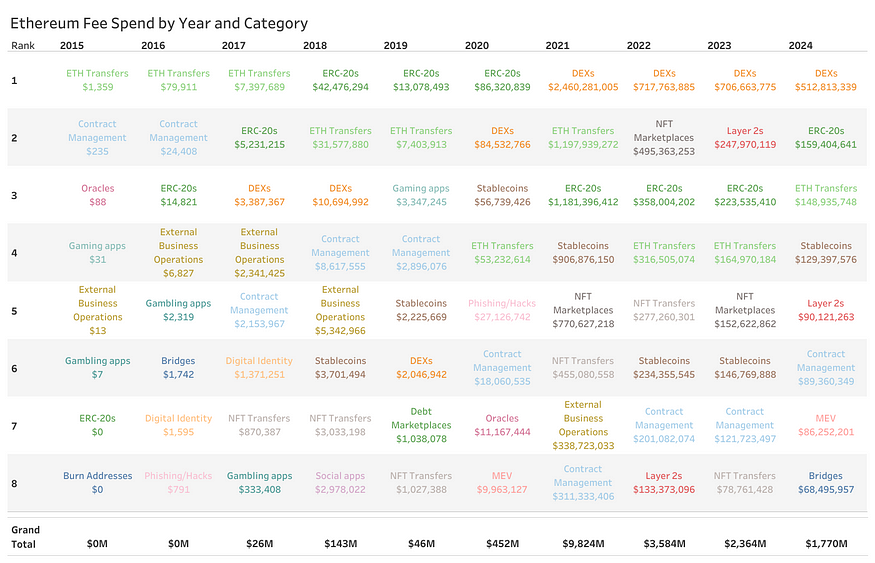 Source: CoinShares, EtherScan, BigQuery, based on monthly aggregated data through August 2024
The conclusions we draw from this table are something the Ethereum community should be both proud of and concerned about. Ethereum has successfully grown into a hosting platform for a wide variety of applications, with users willing to spend more than billions of dollars per year to access these applications; an achievement that has been achieved in less than a decade and is worth celebrating. However, the harsh truth is that this traffic is highly concentrated in a small number of use cases centered around asset speculation, and the demand trend for the Ethereum chain is declining.
Given that the value of ETH depends on the demand for Ethereum services, what matters most to investors is that the platform can provide lasting use cases, which ideally should become more valuable over time. While the current trends are discouraging, we are not declaring Ethereum doomed. In fact, we have found that the Ethereum community is quite open to change and willing to transform its ecosystem to pursue new goals.
As it happens, the main goal over the past few years has been to scale via layer 2 technologies. By all metrics , this has been a major success, with layer 2 technologies growing substantially.
However, while the rise of second layers has effectively solved scaling challenges, it has also cannibalized some of the primary use cases of Ethereum’s first-layer platforms, complicating the relationship between ETH’s value and the broader Ethereum ecosystem.
We believe that the latest major change, EIP-4844, strongly incentivizes Layer-2, which conflicts with the economic design advantages of EIP-1559, which ties the value of ETH to the demand of its Layer-1 platform.
Looking ahead, we believe the Ethereum community needs to focus on fostering on-chain utility that not only scales but also delivers meaningful long-term value to users. This is a major research question going forward, and one that we believe is core to a fundamental ETH investment strategy: Which Ethereum services will drive long-term, sustainable user demand?
Although we have tried to explore this question from a conceptual perspective , we still do not know the complete answer.
Methodology
Our goal is to identify the motivations behind Ethereum transactions in a data-driven manner. We do this by identifying Ethereum addresses, putting them into meaningful categories, and combining this dataset with on-chain transactions. The final output is a dataset that maps all Ethereum transaction demands (priced in gas) to different categories, such as decentralized exchanges, NFTs, etc.
With this output we can create this report that answers which services users pay for on Ethereum, and how much they pay, and based on these answers informs possible future uses of Ethereum.
We adhere to the premise that the nature or purpose of a transaction can be inferred from an understanding of the identity of the sender or receiver of the transaction. Technically, the gas expenditure category of a given transaction is either a property of the sender or the receiver. Given that contract addresses are persistent and available, we find this to be achievable.
Therefore, we built a mapping of addresses to categories in several different data sources, primarily: Dune Analytics, Artemis, and EtherScan. These data sources identify projects by receiving address and classify them in the case of Artemis. Internally, we identify projects that do not complete receiving addresses as needed. Once each address has an identified project, we further map each address to a category taxonomy.
Once we generated an identifiable dataset, we combined it with publicly available chain data from Google to get gas consumption, aggregated by month. However, we assumed that transactions with gas consumption below 24k were "simple ETH transfers" and transactions spending to NULL addresses were "contract creations". We used these as model assumptions, and we found that these assumptions were correct in the vast majority of cases.
Ultimately, we achieved gas categorized at the 85th percentile per month dating back to at least 2020, the 70th percentile dating back to 2016, and 88% of total gas spent since Ethereum’s launch.


