

The price of Dogecoin (DOGE) has shown both promising uptrends and potential warning signs recently. While there has been significant uptrend, there remains uncertainty as to whether this trend can continue. Traders are watching closely as it approaches a key resistance level.
At the same time, there are signs that Dogecoin may struggle to maintain its recent strength. The next few days will be crucial in determining the short-term trend.
Dogecoin BBTrend Reaches Highest Since May
Dogecoin’s BBTrend recently crossed 15, reaching its highest level since May 2024. This is a clear sign of a strong bullish trend, with Dogecoin showing strength in the market, supported by high buying interest and volatility.
However, after this impressive rise, BBTrend has started to decline slightly, but is still close to 15, indicating that the trend has not yet reversed, but could be at a critical moment.
BBTrend, or Bollinger Bands trend, is a key technical indicator that measures the strength and sustainability of price movements by analyzing how far the price deviates from the Bollinger Bands. Historically, Dogecoin’s BBTrend has crossed 12 during previous major rallies , signaling the continuation of the uptrend.
Read more: Buy Dogecoin (DOGE) Anonymously: Step-by-Step Guide
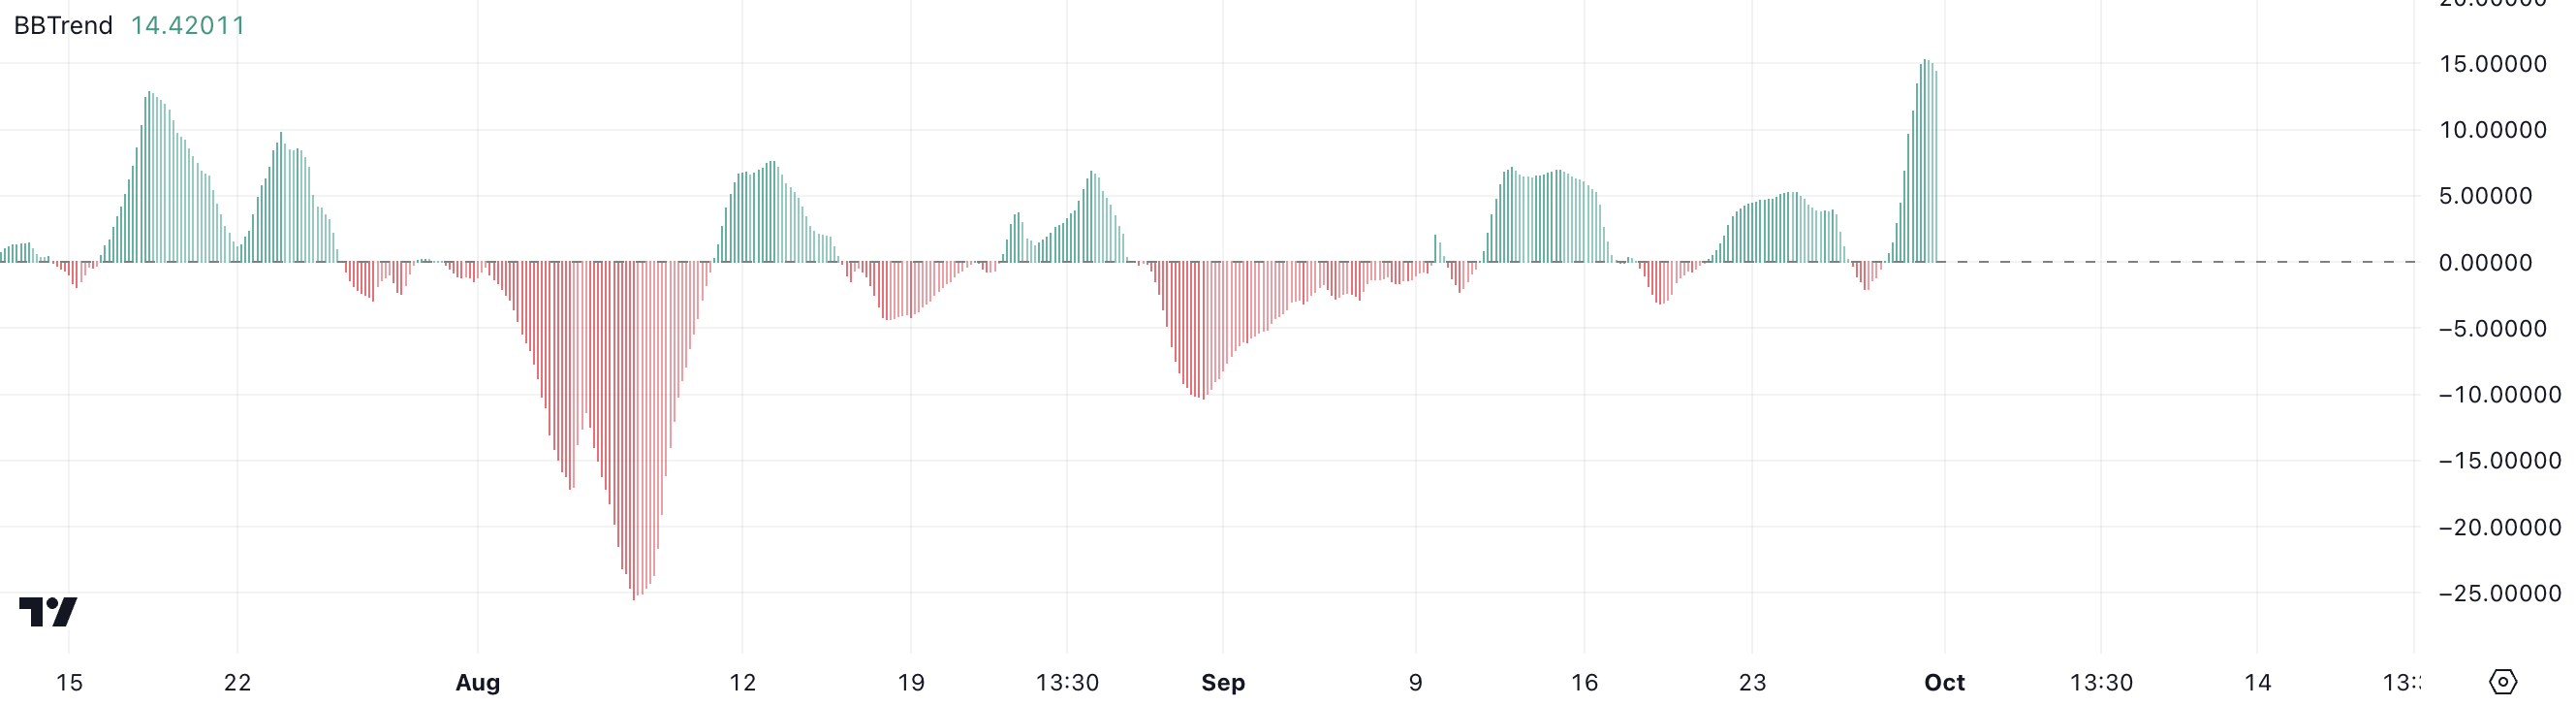
If BBTrend stays above this important level, it suggests that Dogecoin could continue its uptrend and maintain its current strength. However, the recent pullback from the 15 level raises concerns about potential fatigue.
While BBTrend above 12 is often considered a bullish signal, this slight decline could indicate that Dogecoin’s momentum may be starting to wane. The coin could be entering a consolidation phase or losing momentum after a prolonged rally.
So, while Dogecoin has seen strong price action, it remains to be seen whether BBTrend can sustain above 12, or whether further declines in the indicator could confirm a change in market sentiment and signal the end of the uptrend.
Dogecoin ADX shows the uptrend is weakening
The ADX for Dogecoin is currently at 33.68, down from its recent high of 45.69 over the past few days. This decline suggests that the trend still has some strength, but that the Dogecoin price may be starting to lose momentum . ADX, or the Average Directional Index, is a key indicator used to measure the strength of a trend.
Generally, when ADX is above 25, it indicates a strong trend, while below 20, it indicates a weak or non-trending market. Higher values, such as 45, indicate a very strong trend that Dogecoin has recently shown. Although ADX has now fallen to 33.68, it is still at a healthy level, showing that the uptrend is continuing.
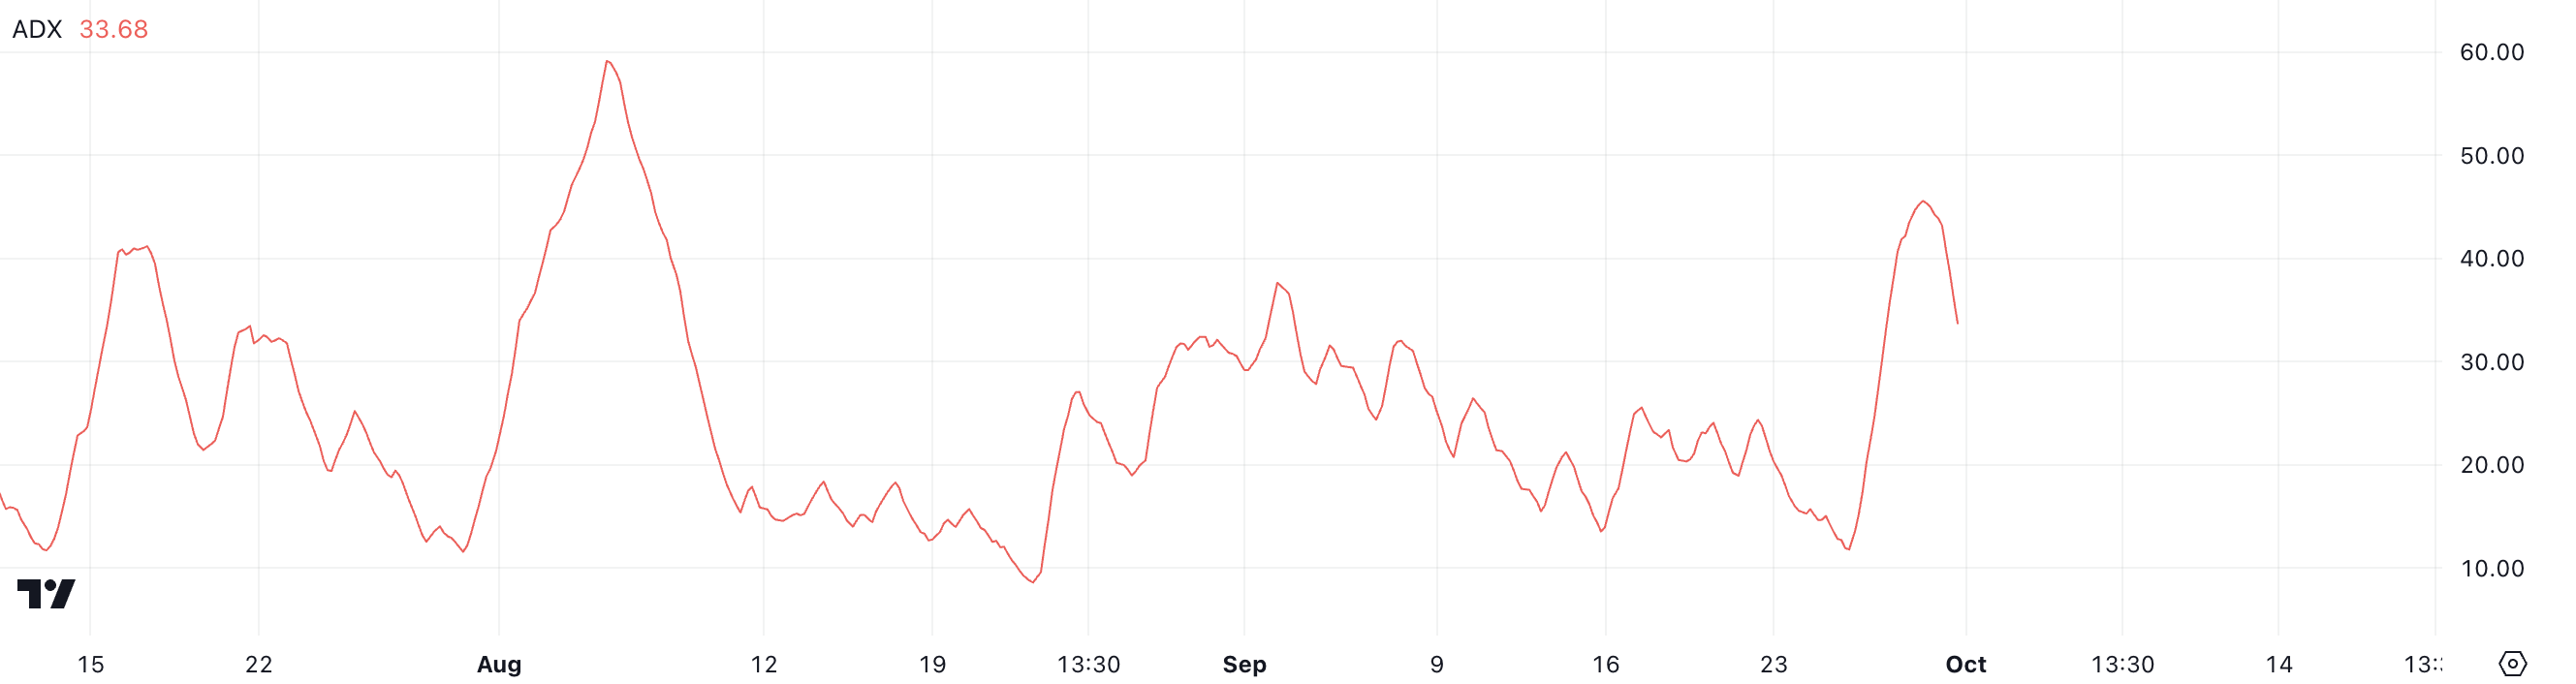
However, a significant decline from the highs raises a warning signal. 33.68 is still considered strong and indicates that Dogecoin’s price action has not lost all its momentum. However, a decline from 45 could mean that the bullish energy is starting to fade away .
This weakening trend strength could indicate that the excitement that has driven Dogecoin’s recent price rally is fading. If ADX continues to decline, it could indicate that the trend is at risk of reversing or entering a consolidation phase.
Dogecoin Price Prediction: Will It Break $0.14 Resistance in October?
Dogecoin’s EMA lines have been forming a bullish formation since the golden cross that occurred a few days ago triggered a sharp 30% price rally. A golden cross occurs when a shorter-term exponential moving average (EMA) crosses above a longer-term EMA, signaling a potential uptrend.
While these EMAs are still showing bullish signs, the shorter term EMA has started to decline significantly in recent days. This decline in the shorter term EMA could be an early warning that Dogecoin’s momentum is starting to slow down.
EMA lines smooth out price data and give more weight to recent prices, helping traders identify trends more accurately. In the case of Dogecoin, these EMAs initially showed a strong uptrend, but as the short-term lines weaken, there may be a change in market sentiment.
Read more: Dogecoin (DOGE) and Shiba Inu (SHIB): What’s the Difference?
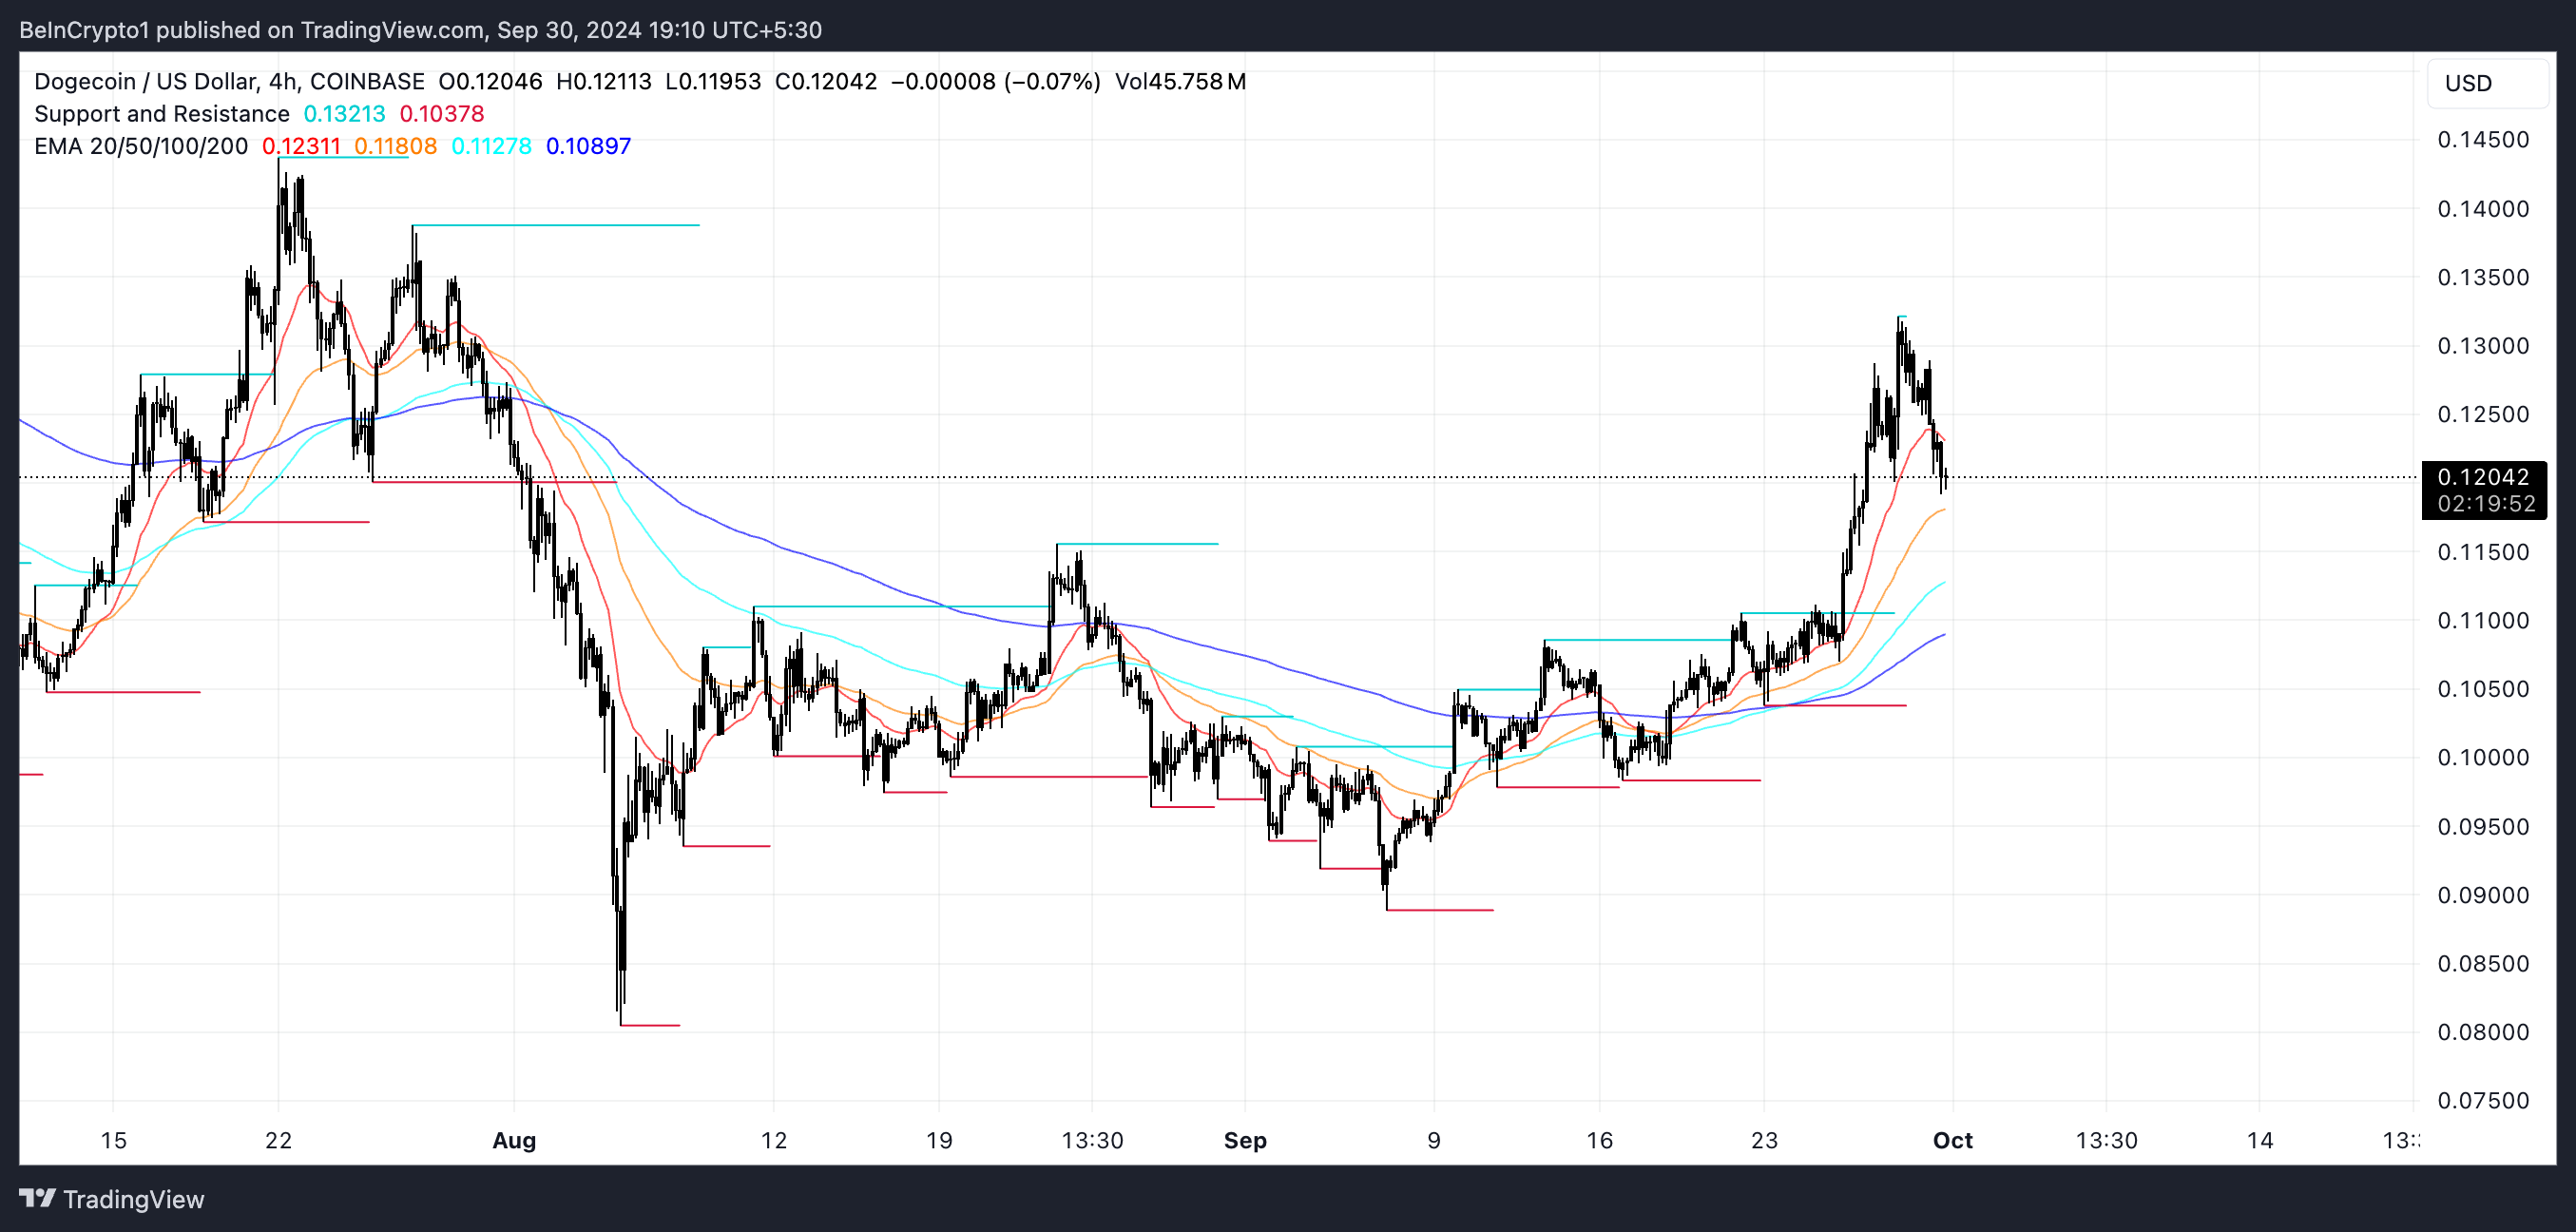
DOGE is struggling to break above the major resistance levels of $0.135 and $0.128. These resistance levels have held firm despite the recent rally, and if DOGE breaks through them, it could quickly reach $0.14. This is highly likely . However, the upward momentum is fading as other meme coins are starting to gain more attention , as the ADX, which measures the strength of a trend, is weakening.
As the ADX weakens, the trend may not be strong enough for DOGE to break above these resistance levels. In this case, a reversal may occur, which could lead to DOGE price dropping to $0.098 or $0.089 in the coming days.


