The price of Ripple (XRP) fell from $0.63 to $0.52 earlier this week due to another regulatory battle with the U.S. SEC. However, traders in the derivatives market see this as a temporary setback and are holding positions in anticipation of a rebound in altcoins.
This analysis examines the background to these sentiments and the future outlook for XRP.
XRP bulls building long positions
On Wednesday, the U.S. SEC filed an appeal challenging XRP’s non-security status, which was declared by the court in July 2023. Immediately after the announcement , XRP’s price fell , erasing its recent significant gains.
Traders initially panicked and decided to short the token, but that is now changing, according to data from cryptocurrency derivatives data platform Coinglass. According to the derivatives information portal, the long/short ratio for XRP has risen to 2.10.
This ratio shows whether traders are holding more long or short positions. A reading below 1 indicates that more traders are choosing to short, suggesting a downtrend. On the other hand, a reading above 1 indicates a predominance of long positions.
Read more: XRP ETF Explained: What It Is and How It Works

In the case of XRP, 67.75% of traders are long, while 32.25% are short. This suggests that most traders expect the value of XRP to increase once the SEC appeals discussions die down.
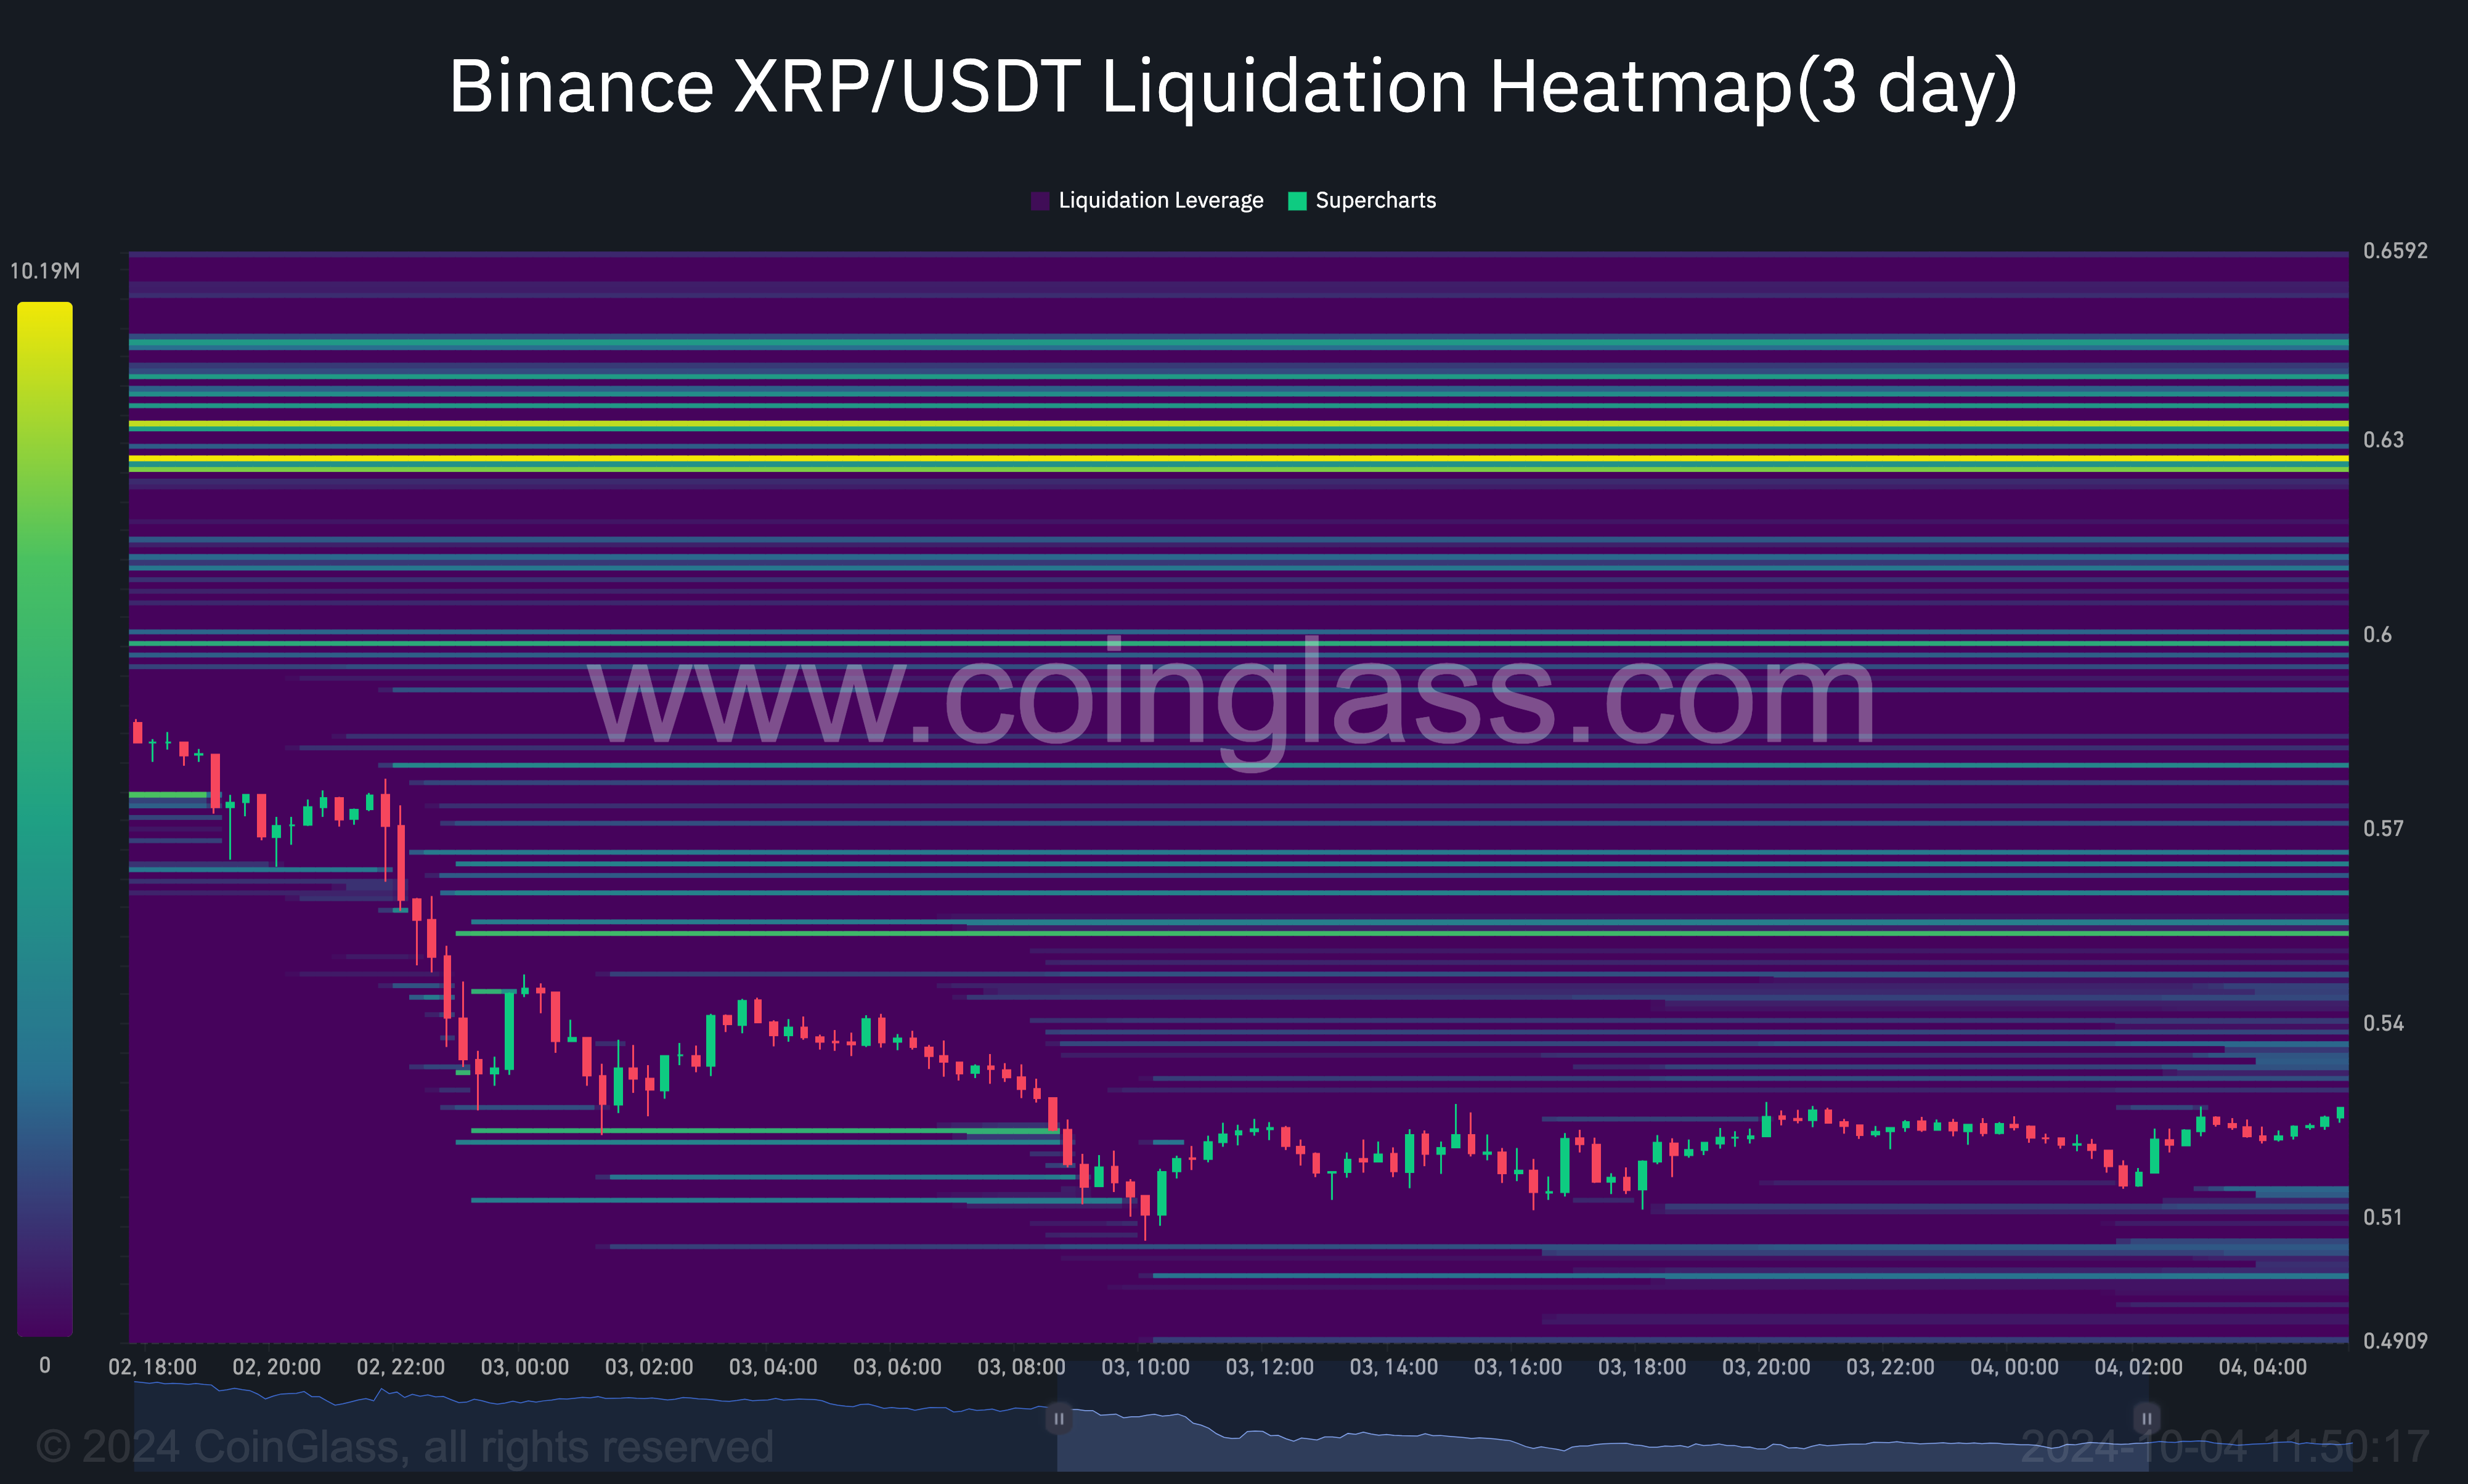
Additionally, the liquidation heatmap, which identifies high liquidity areas, seems to agree with this bias. Simply put, the liquidation heatmap shows the price levels at which large liquidations are likely to occur.
This also helps traders find the optimal liquidity position. Specifically, when the color changes from purple to yellow, liquidity is high at that point and the price may move in that direction. For XRP, this area is between $0.62 and $0.63. Therefore, the value of the altcoin may soon bounce to that level.

XRP Price Prediction: Oversold… Rebound Possible
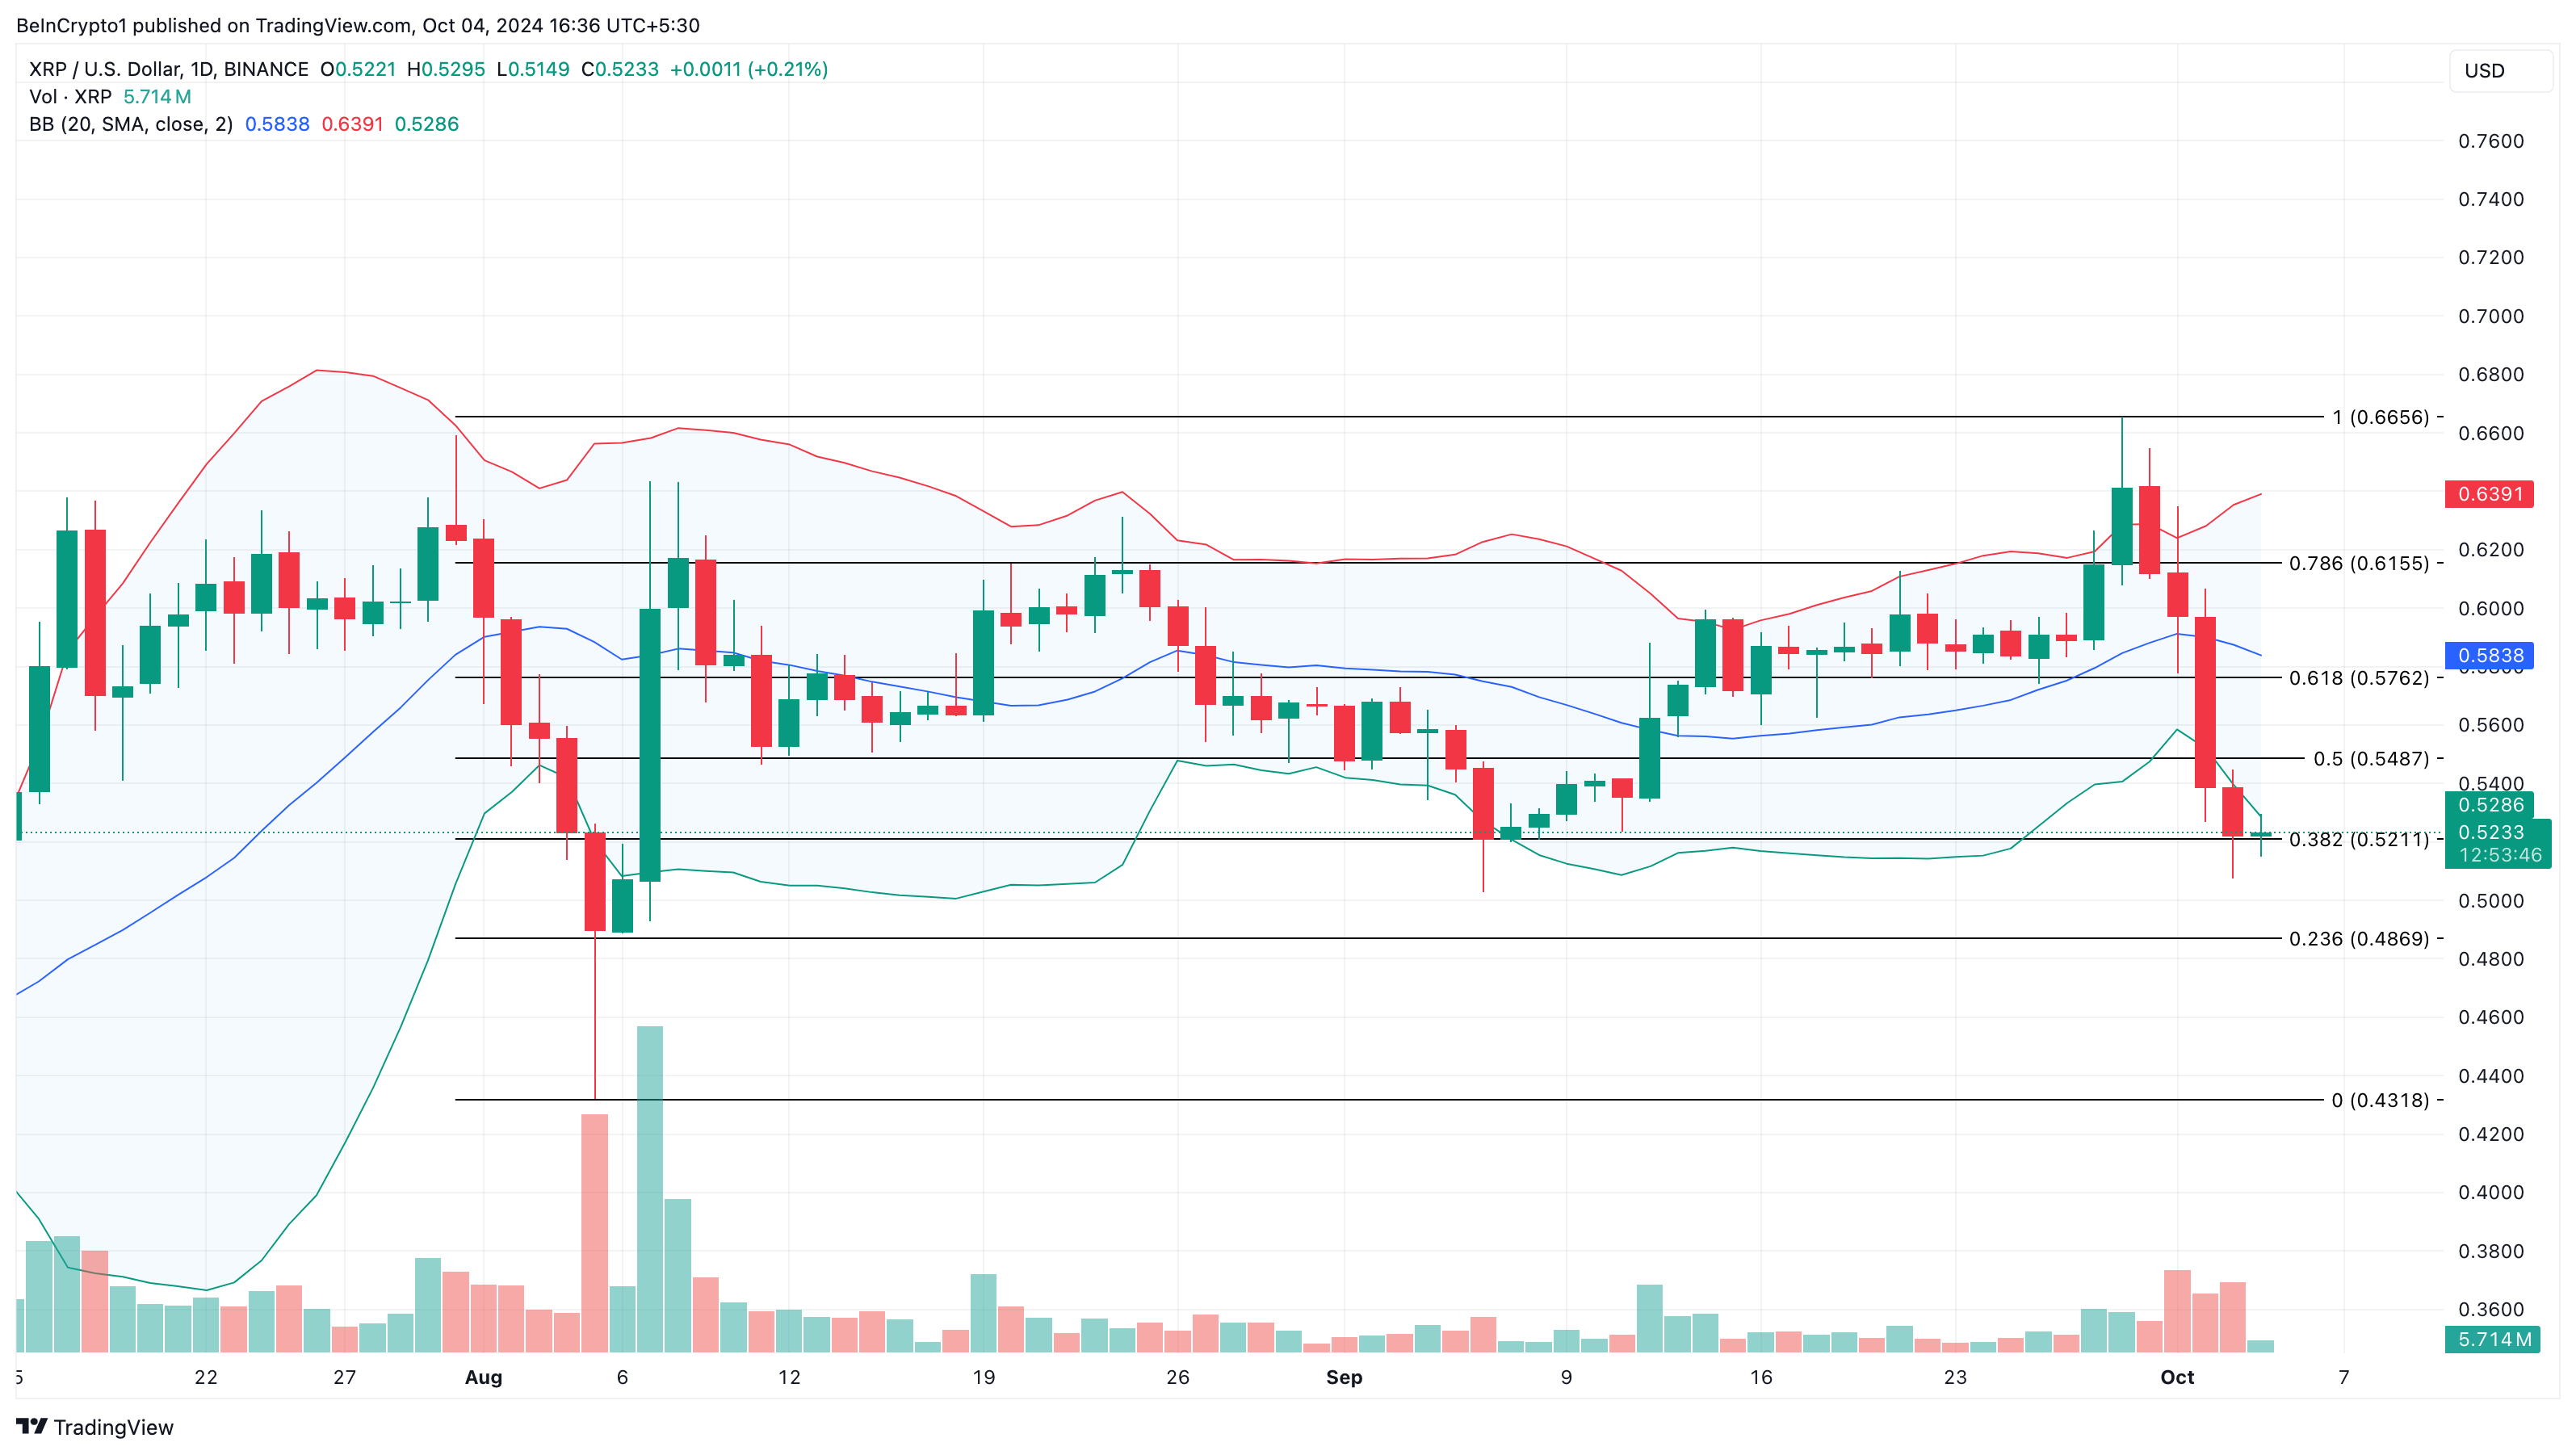
Looking at the Bollinger Bands (BB) on the daily chart , the bands have expanded as volatility around XRP has increased . However, in addition to highlighting the level of volatility, the BB also shows whether the token is overbought or oversold.
When the upper band of the BB touches the price, it is overbought. On the other hand, when the lower band touches the price, it is oversold. As you can see below, the lower band of the indicator has touched the price of XRP at $0.52.
This suggests that some buying pressure could be important in triggering a bounce. Also, the price of the altcoin is in the same position as the 38.2% Fibonacci retracement level. This ratio, also known as a support floor, could also be important in helping XRP bounce.
Read more: How to buy XRP and all the information you need

Therefore, it is highly likely that the price of XRP will overcome the resistance of $0.58. If so, the price of the altcoin can rise to $0.62. However , if Ripple is in a disadvantageous position as the SEC appeal progresses , this prediction may be invalidated. In that case, the price of XRP can fall to $0.48.


