

Author: Joel John
Compiled by: TechFlow

The killer application of cryptocurrencies has emerged in the form of stablecoins. In 2023, Visa's transaction volume was close to $15 trillion, while the total transaction volume of stablecoins was around $20.8 trillion. Since 2019, the transaction volume between wallets has reached $221 trillion.
In the past few years, an amount equivalent to the global GDP has flowed through blockchains. Over time, this capital has gradually accumulated on different networks. Users switch between different protocols to seek better financial opportunities or lower transfer costs. With the advent of chain abstraction, users may not even know they are using a cross-chain bridge.
Cross-chain bridges can be seen as routers for capital. When you visit any website on the internet, there is a complex network behind the scenes ensuring the accurate delivery of the bits and bytes displayed. A key component in this network is the physical router in your home, which determines the routing of data packets to help you access the required data as quickly as possible.
Cross-chain bridges play a similar role in the on-chain capital of today. When a user wants to move from one chain to another, the cross-chain bridge decides the routing of funds to ensure the user gets the maximum value or the fastest speed.
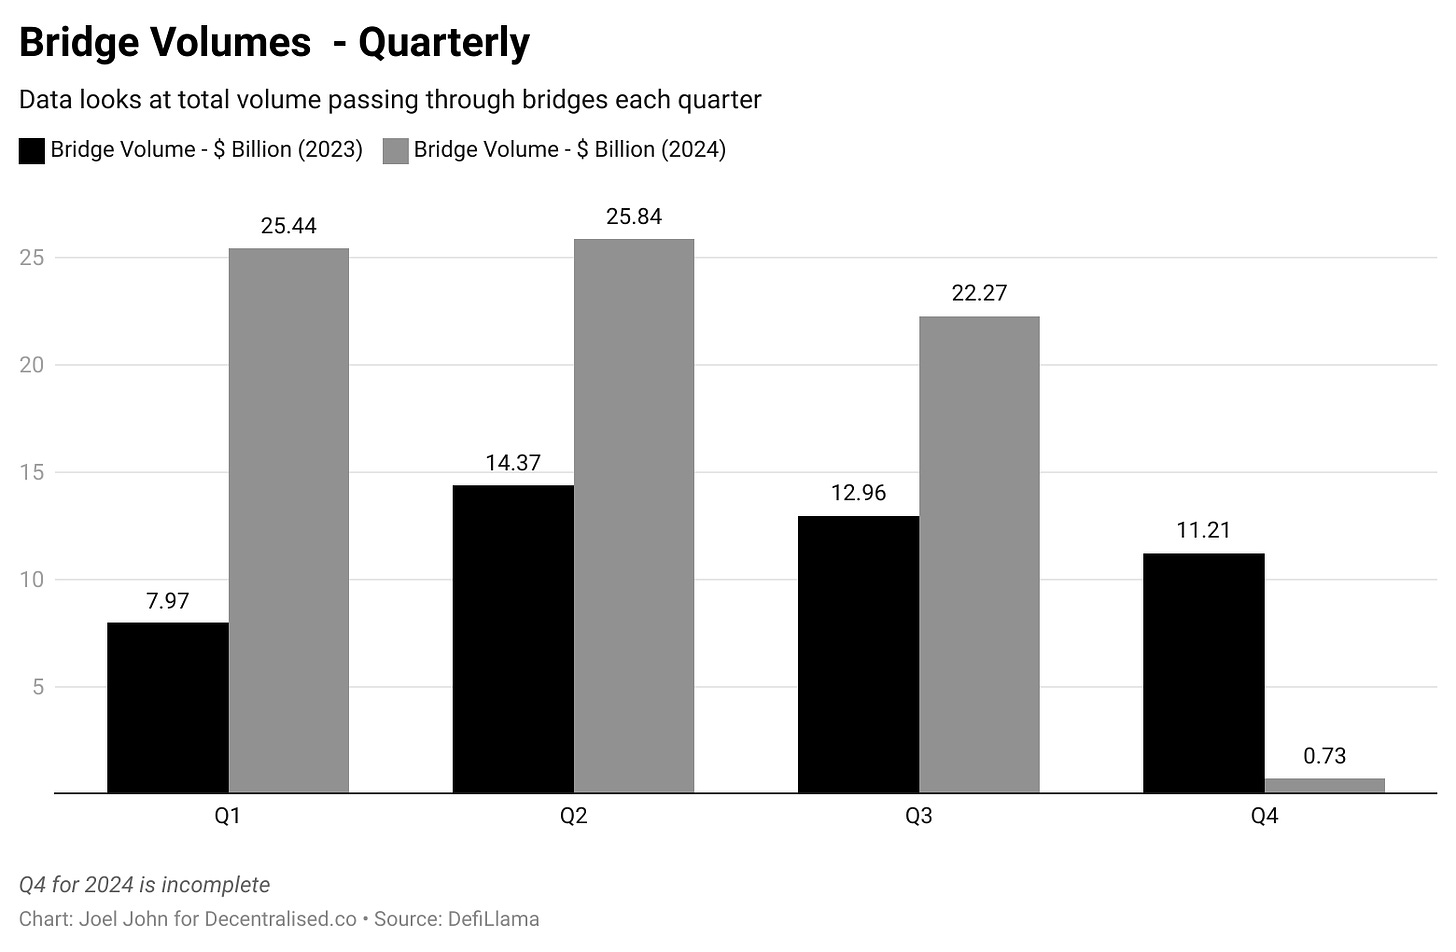
Since 2022, cross-chain bridges have handled nearly $22.27 billion in transactions. This is far less than the amount of capital flowing on-chain in the form of stablecoins. However, the revenue earned by cross-chain bridges per user and per dollar locked seems to be higher than many other protocols.
Today's discussion is about the business model behind cross-chain bridges and the exploration of the revenue generated through cross-chain bridge transactions.
Showcasing Revenue
Since mid-2020, blockchain cross-chain bridges have cumulatively generated nearly $104 million in fees. This figure has a certain seasonality, as users flock to cross-chain bridges to use new applications or pursue economic opportunities. If there are no yields, meme Tokens, or financial instruments available, cross-chain bridges will be impacted, as users tend to use the protocols they are most familiar with.
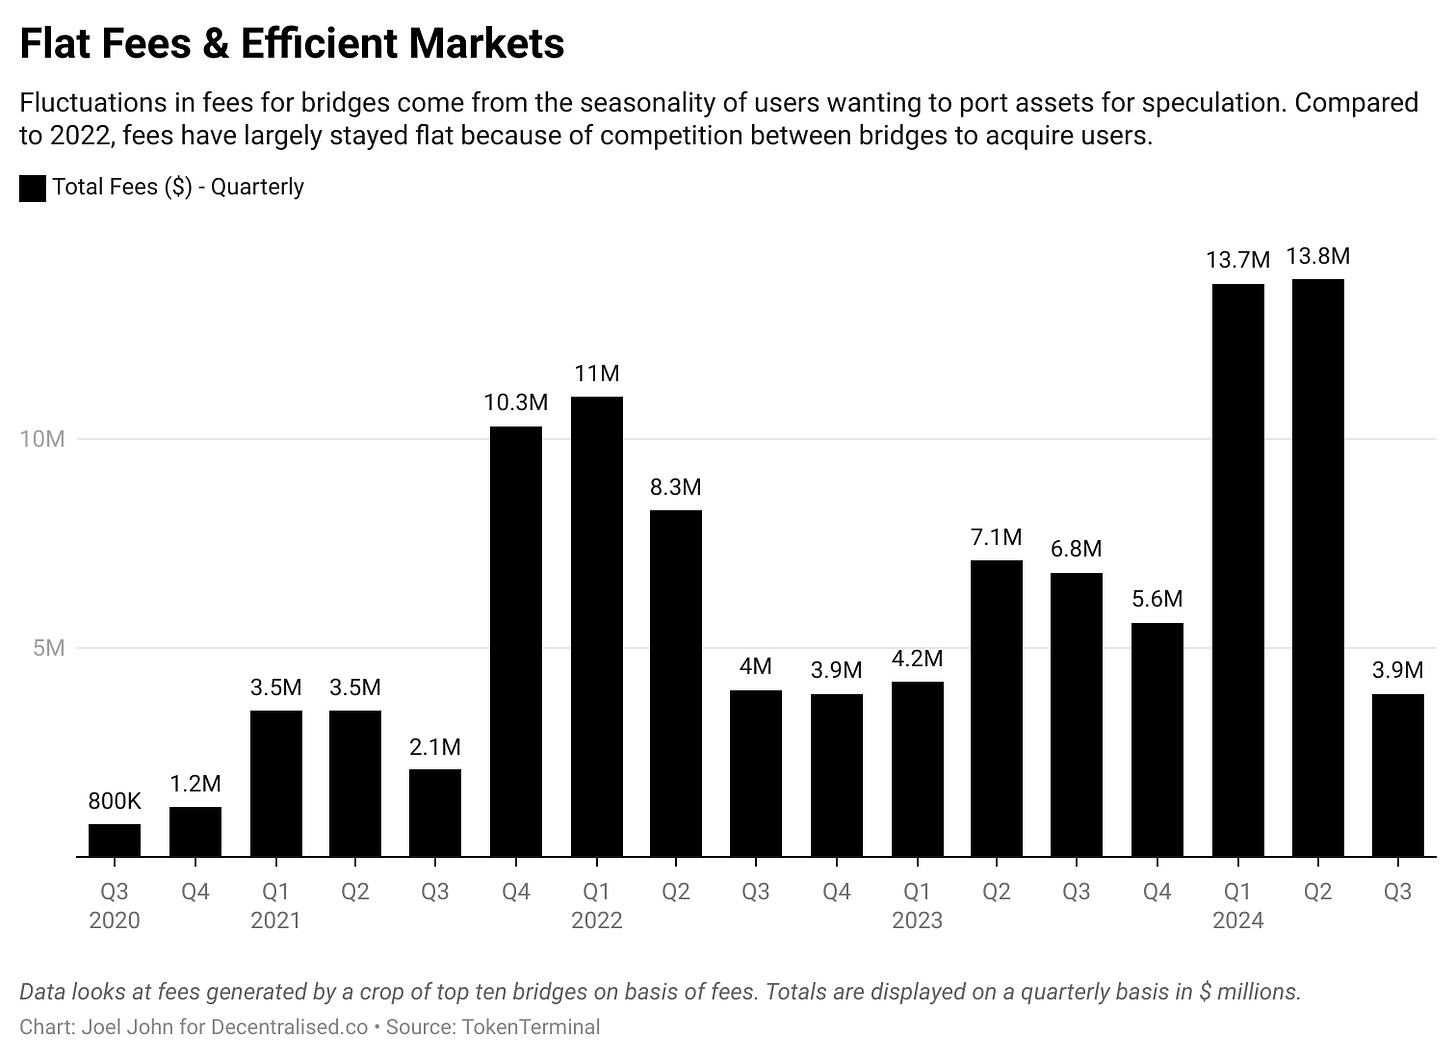
A rather sad (but interesting) comparison is to compare the cross-chain bridge revenue with similar meme-coin platforms like PumpFun. Their fee revenue was $70 million, while the fee revenue generated by cross-chain bridges was $13.8 million.
The reason for the fees remaining stable even as transaction volumes increase is the ongoing price war between chains. Understanding how most cross-chain bridges work can help explain how they achieve this efficiency. One way to understand cross-chain bridges is to draw an analogy to the Hawala network from a century ago.
Blockchain cross-chain bridges are similar to Hawala, connecting physically separated entities through cryptographic signatures.
While Hawala is now generally associated with money laundering, a century ago, it was an efficient way of moving funds. For example, in the 1940s, if you wanted to transfer $1,000 from Dubai to Bangalore - when the UAE was still using the Indian Rupee - you had a few options.
You could choose to go through a bank, which might take several days and require a lot of paperwork, or you could go to the gold market and find a merchant. The merchant would take your $1,000 and instruct an Indian merchant in Bangalore to pay the corresponding amount to someone you trusted. The funds would flow between India and Dubai without crossing borders.
How did this work? Hawala was a trust-based system, as the gold market merchants and the Indian merchants often had long-standing trade relationships. They did not directly transfer funds, but might settle balances later through commodities like gold. Since these transactions relied on the mutual trust between the participating merchants, there had to be a high degree of confidence in the integrity and cooperation of both merchants.
How does this relate to cross-chain bridges? The operating model of cross-chain bridges is similar in many ways. For example, you might want to move funds from Ethereum to Solana to pursue yields, rather than from Bangalore to Dubai. Bridges like LayerZero facilitate this by passing user information, allowing users to borrow Tokens on one chain and lend them on another.
Imagine it's no longer about locking assets or handing out gold bars, but these two traders giving you a code that can be redeemed for capital at either location. This code is akin to a way of transmitting information. Bridges like LayerZero use a technology called endpoints. These endpoints are smart contracts that exist on different chains. A smart contract on Solana may not be able to directly understand a transaction on Ethereum, so an oracle is needed to intervene. LayerZero uses Google Cloud as the verifier for cross-chain transactions. Even at the forefront of Web3, we still rely on Web2 giants to help us build better economic systems.
Imagine the participating traders don't trust their ability to explain the code. After all, not everyone can use Google Cloud to verify transactions. Another way is to lock and mint assets. In such a model, if you use Wormhole, you would lock your assets in a smart contract on Ethereum to obtain a wrapped asset on Solana. This is akin to the Hawala merchant giving you a gold bar in India, and you depositing US dollars in the UAE. The asset is minted in India and handed to you. As long as you return the gold bar, you can speculate with the gold in India and retrieve your original capital in Dubai. Wrapped assets on different chains are similar to gold bars - except their value is typically maintained across the two chains.
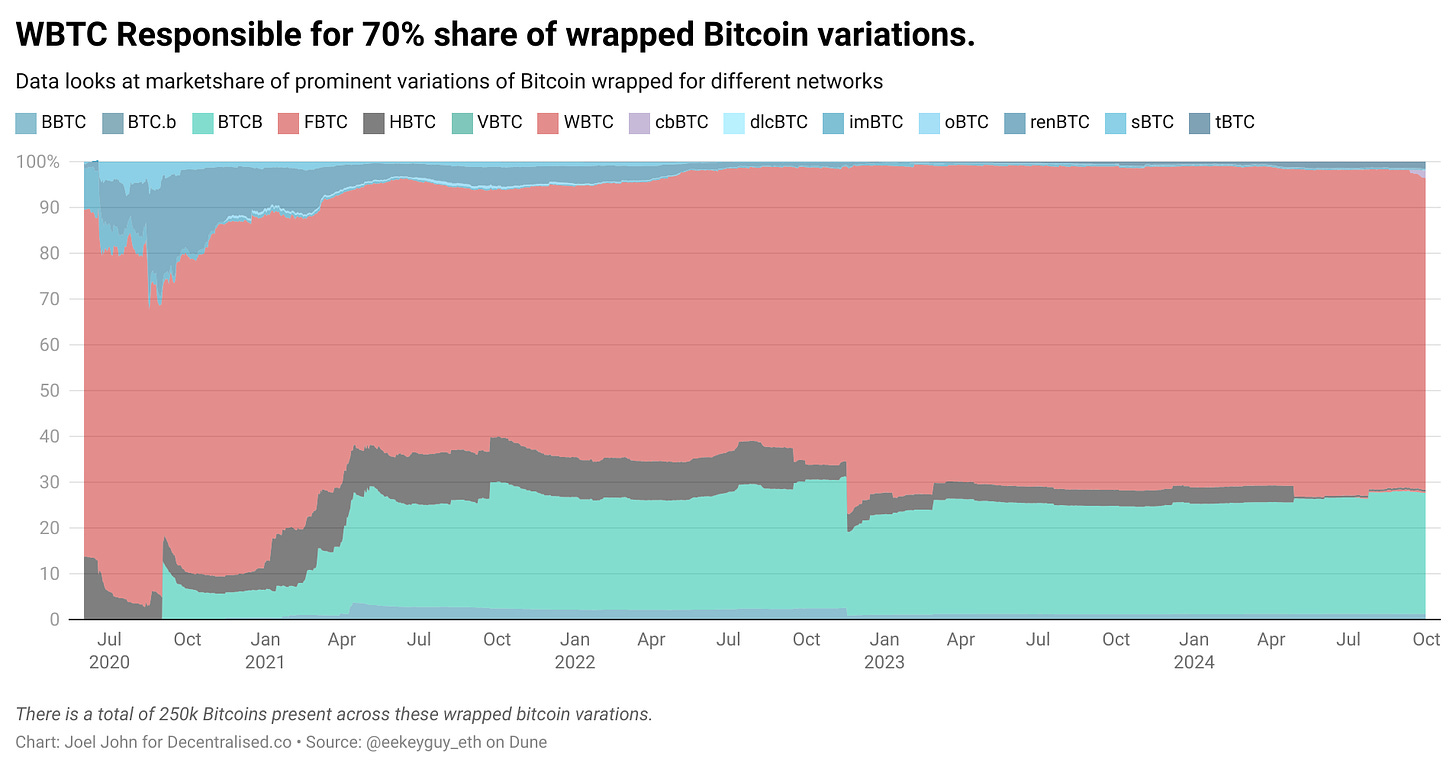
The image below shows the various iterations of Bitcoin wrapping that we have today. Many of these were minted during the DeFi summer to enable the use of Bitcoin to generate yields on Ethereum.
Cross-chain bridges have several key revenue streams:
Total Value Locked (TVL) - When users deposit capital, these funds can be used to generate yields. Currently, most cross-chain bridges do not lend out idle capital, but instead charge a small transaction fee when users move capital from one chain to another.
Relayer fees - These are small fees charged by third parties (such as Google Cloud in LayerZero) on each transaction to verify the transaction across multiple chains.
Liquidity provider fees - These are fees paid to individuals who deposit capital into the cross-chain bridge smart contracts. Imagine you're running a Hawala network, and now someone wants to move $100 million from one chain to another. As an individual, you may not have enough capital. Liquidity providers are the individuals who pool funds to help complete the transaction. In return, each liquidity provider gets a small share of the fees generated.
Minting costs - Cross-chain bridges can charge a small fee when minting assets. For example, WBTC charges 10 basis points per Bitcoin minted. In these fees, the main expenses for cross-chain bridges are in maintaining the relayers and paying the liquidity providers. They create value on the TVL through transaction fees and minting assets on both ends of the transaction. Some cross-chain bridges also employ incentivized staking models. Imagine you need to do a $100 million Hawala fund transfer to someone across the ocean. You might need some form of economic collateral to ensure the other party has sufficient funds.
They might gather their friends in Dubai to pool resources as a way to prove they have the capability to complete the transfer. As a reward, they might even return a portion of the fees. This operation is structurally similar to staking. The difference is that instead of using US dollars, users pool the native Tokens of the network and earn more Tokens in exchange.
So, how much revenue can all of this generate? What is the value of a dollar or a user in these products?
Economics
The data provided may not be entirely accurate, as not all costs are covered by the agreements. Sometimes, the costs depend on the protocol used and the assets involved. If cross-chain bridges are primarily used for low-liquidity long-tail assets, it may result in users experiencing slippage in their trades. Therefore, when looking at unit economics, I want to clarify that the following does not reflect which cross-chain bridge is better. What we care about is how much value is created across the entire supply chain during the cross-chain bridge event.
A good starting point is to look at the trading volume and fees generated by each protocol over a 90-day period. These data cover metrics up to August 2024, so the numbers reflect the previous 90 days. We assume that due to Across's lower fees, it has a higher trading volume.

This provides a rough idea of how much capital is flowing through the cross-chain bridges in any given quarter and the fees they generate during the same period. We can use this data to calculate the fees generated per dollar that passes through their systems.
For easier reading, I have calculated the fees generated for transferring $10,000 through these cross-chain bridges.
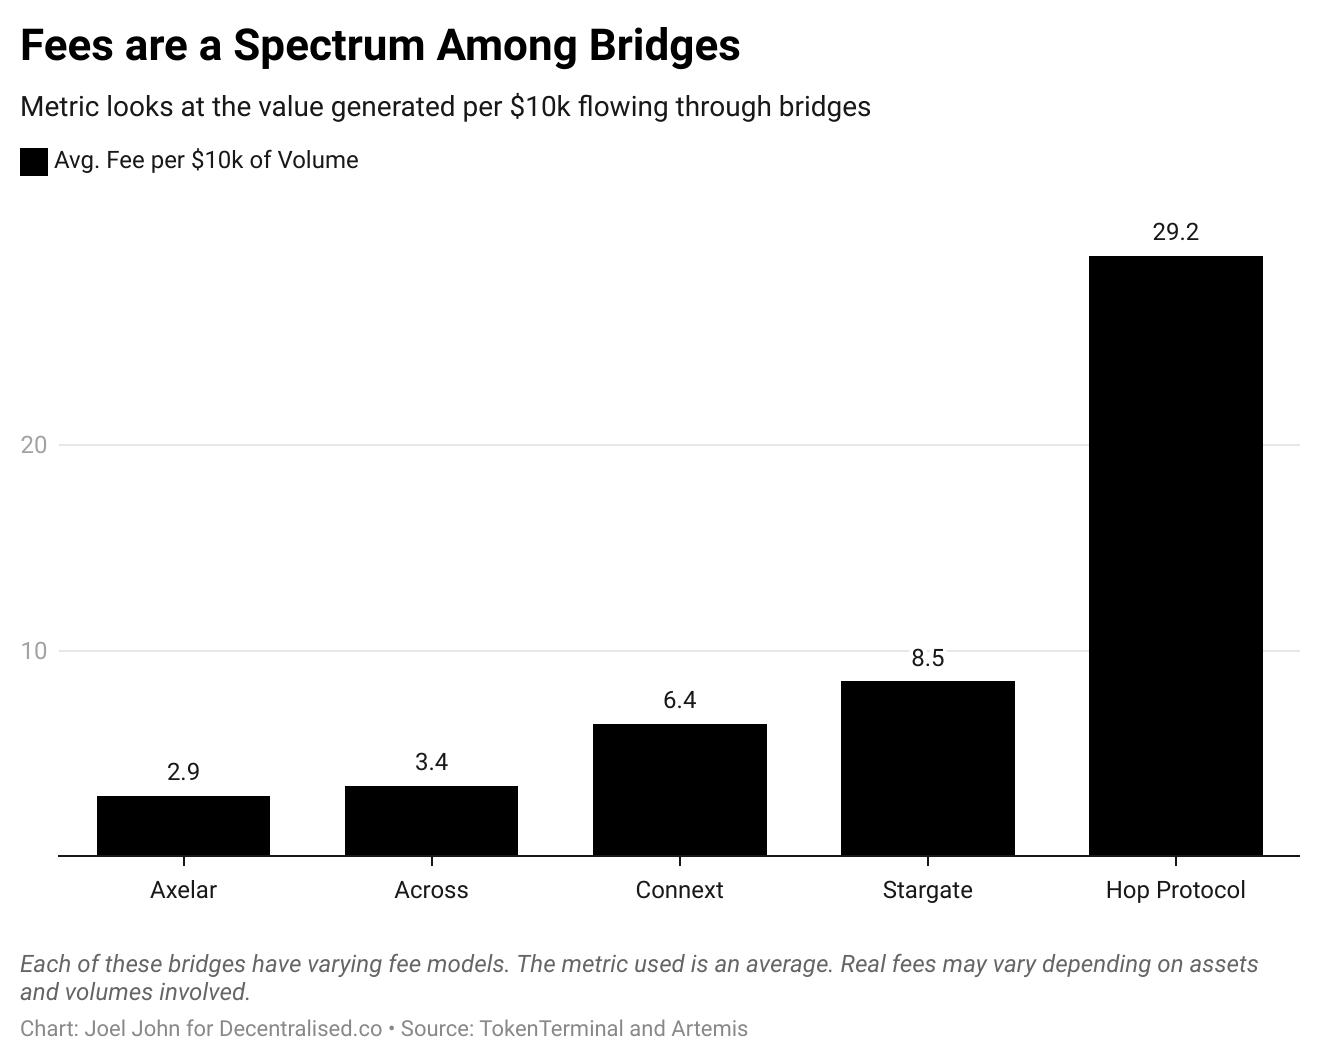
Before we begin, I want to clarify that this does not mean that Hop's fees are ten times that of Axelar. It means that for a $10,000 transfer, a cross-chain bridge like Hop can create $29.2 of value across the entire value chain (e.g., liquidity providers, relayers, etc.). These metrics will vary as they support different types and natures of transfers.
Interestingly, when we compare the value captured by the protocols to the value of the cross-chain bridges.
For benchmarking, we look at the transfer costs on Ethereum. As of the time of writing, during low gas fee periods, the fees on ETH are around $0.0009179, while on Solana, they are $0.0000193. Comparing cross-chain bridges to L1s is somewhat akin to comparing a router to a computer. The cost of storing a file on a computer is much lower. But the question we want to address is whether, from an investment target perspective, cross-chain bridges capture more value than L1s.
From this perspective, combining the metrics above, one way to compare the two is to look at the dollar fees captured per transaction by individual cross-chain bridges and compare them to Ethereum and Solana.
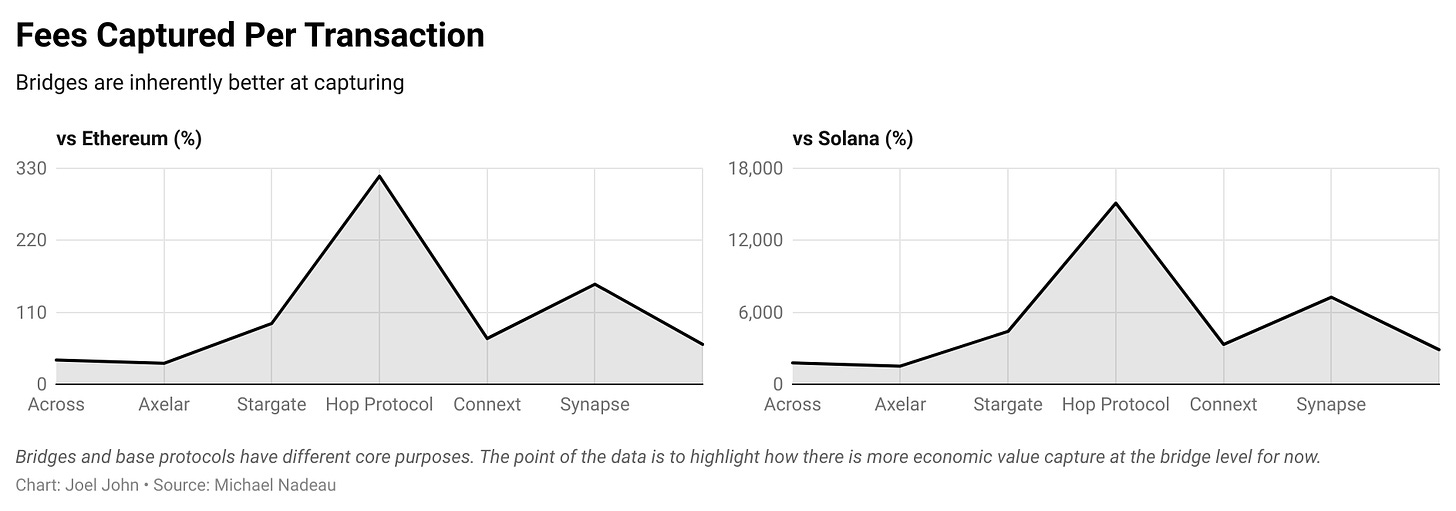
The reason some cross-chain bridges capture fees lower than Ethereum is due to the gas costs incurred when conducting cross-chain bridge transactions on Ethereum.
One could argue that the Hop protocol captures value 120 times more than Solana. But this misses the point, as the fee models of the two networks are quite different. What we are interested in is the difference between economic value capture and valuation, as we will soon see.
Among the top seven cross-chain bridge protocols, five have fees lower than the Ethereum L1. Axelar is the cheapest, at only 32% of the average Ethereum fees over the past 90 days. Currently, the Hop Protocol and Synapse have fees higher than Ethereum. Compared to Solana, we can see that the L1 settlement fees on high-throughput chains are orders of magnitude cheaper than the current cross-chain bridge protocols.
One way to further enhance these data is to compare the costs of transacting on L2s within the EVM ecosystem. As background, Solana's fees are only 2% of the regular fees on Ethereum. In this comparison, we will select Arbitrum and Base. Since L2s are designed for ultra-low fees, we will use a different metric to measure economic value - the average daily fee per active user.
During the 90 days for which we collected data for this article, Arbitrum had an average of 581,000 users per day, generating $82,000 in fees per day. Similarly, Base had an average of 564,000 users per day, generating $120,000 in fees.
In comparison, cross-chain bridges have lower user counts and fees. The highest among them is Across, with 4,400 users generating $12,000 in fees. Therefore, we estimate that Across generates $2.4 in fees per user per day. This metric can then be compared to the fees generated per active user on Arbitrum or Base to assess the economic value per user.

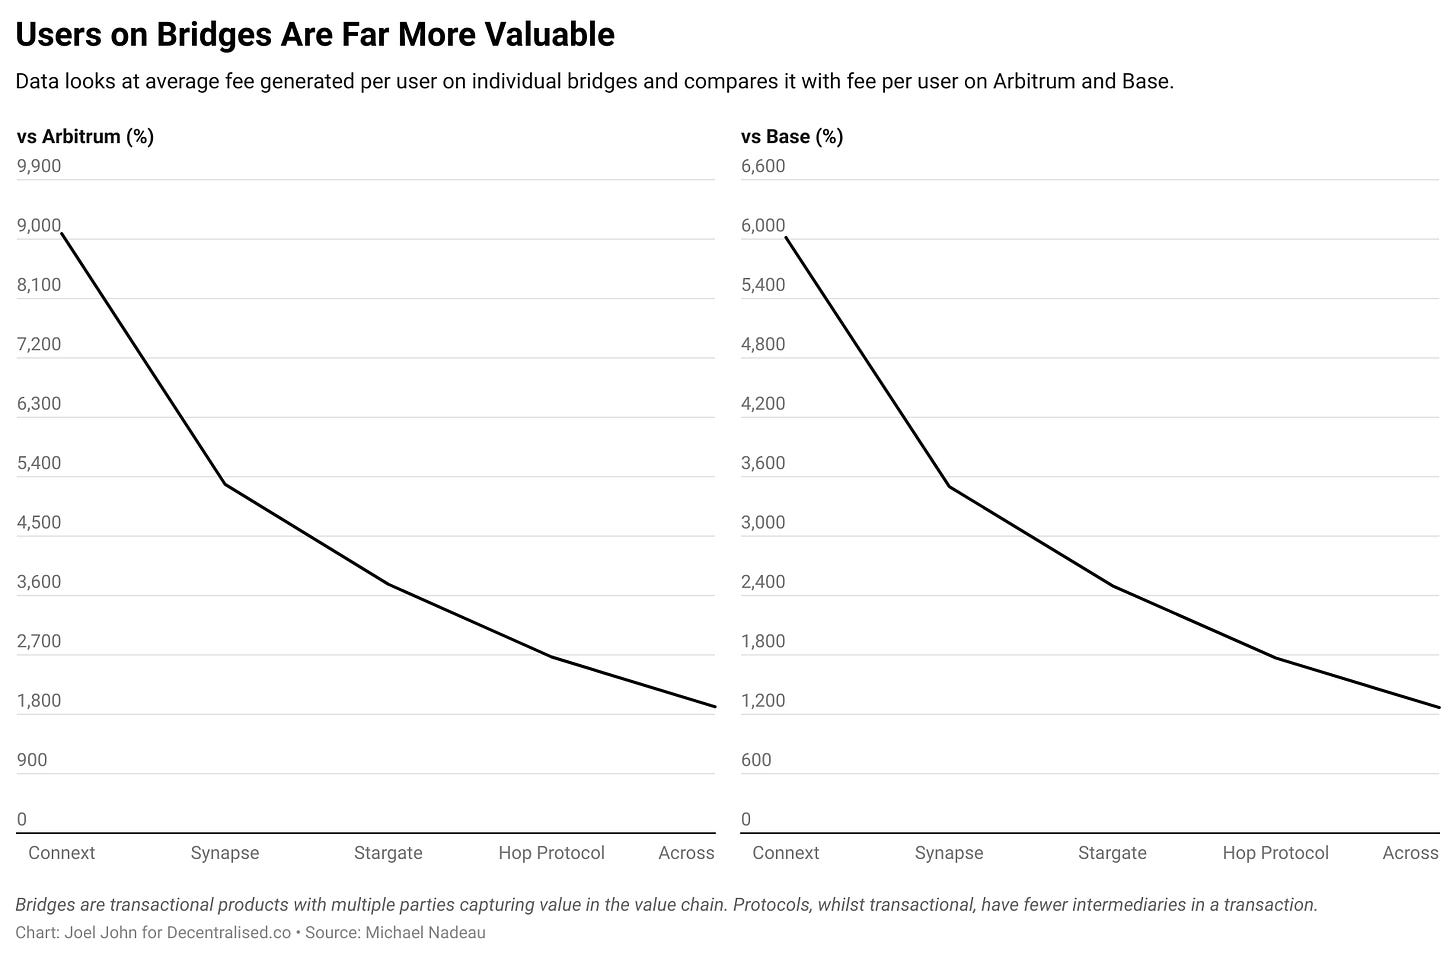
The average user on cross-chain bridges is more valuable than the average user on L2s. Connext's average user creates value 90 times that of an Arbitrum user. This is a bit like comparing apples and oranges, as cross-chain bridge transactions on Ethereum incur relatively high gas fees, but it highlights two clear factors.
Capital routers like today's cross-chain bridges may be one of the few product categories in crypto that can generate significant economic value.
As long as transaction fees remain high enough to deter users, we may not see users migrate to L1s like Ethereum or BTC. Users may be directly onboarded to L2s (like Base), and developers may choose to absorb the gas fees. Alternatively, we may see a scenario where users only switch between low-cost networks.
Another way to compare the economic value of cross-chain bridges is to contrast them with decentralized exchanges. The two are functionally similar, both enabling the conversion of Tokens. Exchanges allow for the conversion of assets, while cross-chain bridges enable the conversion of Tokens across blockchains.
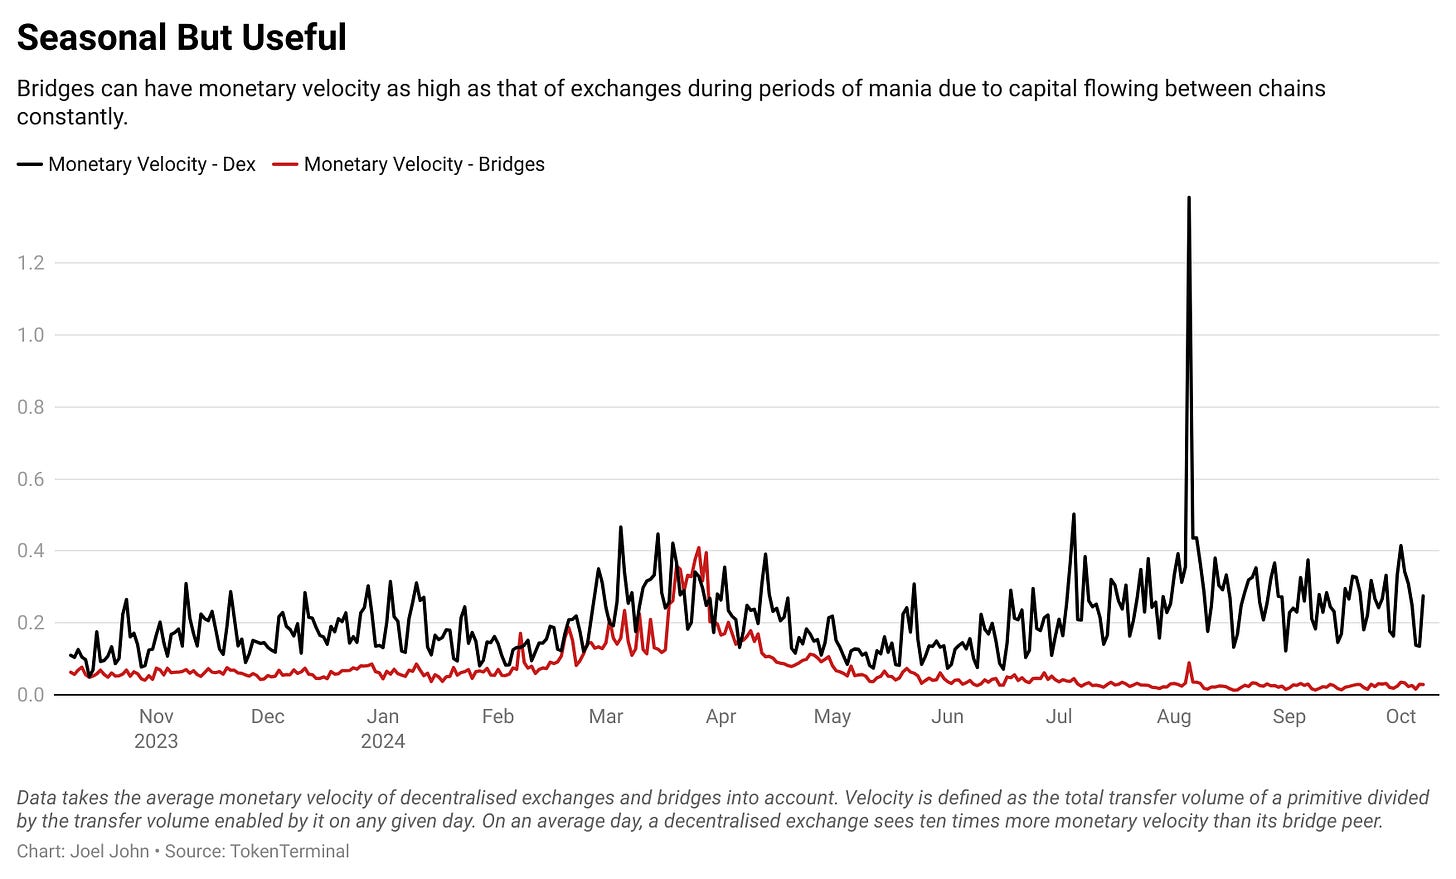
The data above is only for decentralized exchanges on Ethereum.
Here, I avoid comparing fees or revenues, and instead focus on the velocity of capital. Capital velocity can be defined as the number of times capital circulates between the smart contracts of a cross-chain bridge or a decentralized exchange. To do this, I divide the daily transfer volume of the cross-chain bridges and decentralized exchanges by their TVL.
As expected, decentralized exchanges have much higher capital velocity, as users frequently swap assets multiple times in a day.
However, interestingly, when excluding large L2-oriented cross-chain bridges (such as the native cross-chain bridges of Arbitrum or Optimism), the capital velocity is not too far off from decentralized exchanges.
Perhaps in the future, we may see cross-chain bridges limiting the capital they accept, and instead focusing on maximizing returns by increasing capital velocity. That is, if a cross-chain bridge can circulate capital multiple times in a day and pass the fees on to a small subset of users who park their capital, it could generate higher yields than other sources in the current crypto landscape.
Such cross-chain bridges may have more stable TVLs than traditional cross-chain bridges, as expanding the amount of parked capital would lead to diminishing returns.
Are Cross-Chain Bridges Routers?

Source:Wall Street Journal
If you think venture capital firms flocking to "infrastructure" is a new phenomenon, let's take a trip down memory lane. In the 2000s, when I was a kid, Silicon Valley was abuzz with enthusiasm for Cisco. The logic was that if internet traffic increased, routers would capture a lot of value. Much like NVIDIA today, Cisco was a high-priced stock because they were building the physical infrastructure that underpinned the internet.
The stock peaked at $80 on March 24, 2000, and as of the time of writing, trades at $52. Unlike many internet bubble stocks, Cisco's share price never recovered. Writing this piece against the backdrop of meme-coin mania, it makes me ponder the extent to which cross-chain bridges can capture value. They have network effects, but it may be a winner-take-all market. One that is increasingly trending towards an intent and solver-based model, with centralized market makers filling orders in the backend.
Ultimately, most users don't care about the decentralization of the cross-chain bridge they use, they care about cost and speed.
In such a world, the cross-chain bridges that emerged in the early 2020s may be akin to physical routers, more likely to be displaced by intent or solver-based networks, which are the 3G of the internet.


