

Did you think the landscape of public chains was already stable? In fact, the situation is quietly changing.
Conclusion first:Ethereum's dominant position cannot be shaken for the time being, but its high fees make it slightly weak in user experience; Solana remains the star of the high-frequency trading and Non-Fungible Token market, while BNB continues to attract a large number of exchange users relying on Binance, the "traffic giant". Ton Chain, relying on its deep integration with the Telegram community, is rising rapidly, and its on-chain activity and capital inflow show its huge potential. And the emerging public chains - SUI and Aptos - are frantically catching up in speed and efficiency.
The market does not wait for anyone, and opportunities come and go in a flash. Each public chain has its own unique user group, transaction frequency and activity, and changes in these indicators will directly affect the performance of its token price. In this article, we will analyze the current status of these six major public chains in detail through on-chain data, active addresses, transaction fees, total locked-in value (TVL) and other core indicators (data as of October 14, 2024), to help you seize the next potential opportunity.
A brief review of the six major public chain ecosystems
To understand who will be the next investment hotspot, we must first understand the current status of the major public chains:
- Ethereum (ETH): The world's first smart contract platform, regarded as the "elder brother" of the public chain ecosystem. As of October 14, 2024, the price of ETH is $2560, and it is still the core of DeFi and Non-Fungible Tokens, but its high transaction fees have deterred many ordinary users.
- Solana (SOL): Focusing on high performance and low fees, Solana has attracted a large number of Non-Fungible Token and DeFi projects with its extremely fast transaction speed. However, the problem of network instability is still an obstacle that Solana needs to overcome.
- SUI: As an emerging public chain, SUI focuses on efficient transactions and smart contract execution, and has currently obtained the approval of Grayscale Trust, with its token price hitting a new high, and its development potential cannot be ignored.
- Aptos (APT): Seen as the "next Solana", Aptos is growing rapidly in terms of technical background and ecosystem expansion, attracting a lot of developer attention.
- BNB Chain (BNB): Relying on Binance's global user base, BNB has the advantages of high transaction volume and active users, relatively low fees, and is popular with investors.
- Ton: Built by the team behind Telegram, Ton Chain has quickly risen to prominence by leveraging Telegram's strong traffic, and its decentralized ecosystem and messaging functions have made it a focus in the Web3 community. Its on-chain data performance is impressive, attracting more and more users and projects.
Comparison of on-chain data - uncovering hidden opportunities and risks
We start from four key indicators: daily transaction volume, daily active addresses, transaction fees, and total locked-in value (TVL). These data can reveal the market performance of each public chain and provide in-depth analysis for investors.
1. The game between daily transaction volume and transaction fees
Daily transaction volume and transaction fees are core indicators for measuring the activity and user experience of public chains, reflecting the usage frequency and cost of the network.
Analysis:
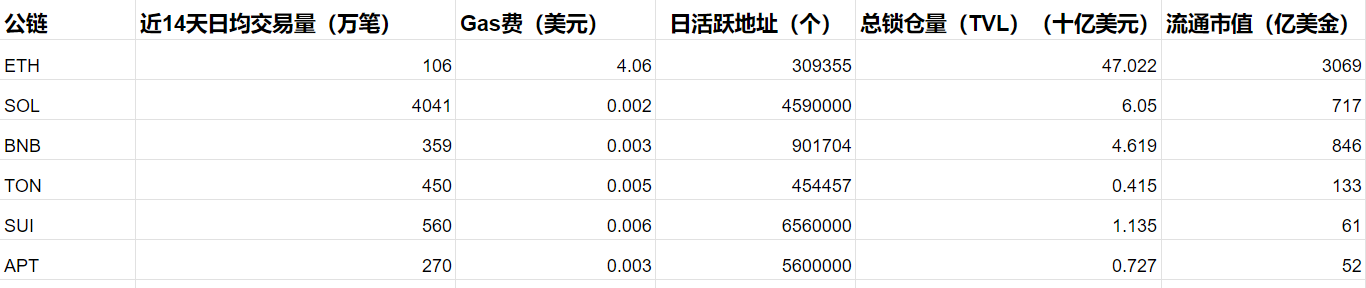
- Solana: Solana leads with a daily transaction volume of 40 million, thanks to its extremely low transaction fees (only $0.002/transaction). This high-frequency trading environment is very suitable for Non-Fungible Token and DeFi transactions, and users can trade small amounts without any worries. Solana has become the preferred choice for high-frequency trading users with its low fees and high transaction volume.
- Ethereum (ETH): ETH's daily transaction volume is 1.1 million, but its high transaction fees ($4/transaction) are still Ethereum's biggest shortcoming. Nevertheless, Ethereum remains the first choice for high-value smart contracts and complex DeFi transactions.
- BNB: BNB's daily transaction volume is 3.59 million, with a transaction fee of $0.003/transaction, and its strong user base is mainly due to the support of the Binance exchange. Relying on relatively low fees and high-frequency transactions, BNB is popular with small and medium-sized investors.
- Ton Chain: Ton Chain's daily transaction volume is 4.5 million, with a fee of $0.005/transaction. Compared to Solana, the fees are slightly higher, but relying on the traffic pool of the Telegram community, Ton Chain's transaction frequency and activity continue to grow.
- APT and SUI: Aptos and SUI have daily transaction volumes of 2.7 million and 5.6 million respectively, and their transaction fees are also relatively low. As emerging public chains, their low-cost features are attracting more and more users.
2. Daily active addresses - measuring user engagement
Daily active addresses is an important indicator for measuring the activity of network users, reflecting the ecosystem participation and user stickiness of the public chain.
Analysis:
- SUI: SUI leads with 6.56 million daily active addresses, mainly due to the recent impressive performance of the SUI token, which has broken through $2.2, a new high, and more and more investors and developers are focusing on this platform. According to Developer data, the number of developers on the Sui chain has reached 1,108, an increase of about 64% in the past year, making it the fastest growing public chain.
- BNB and Ton Chain: The number of daily active addresses on the BNB Chain reaches 900,000, and the number of daily active addresses on the Ton Chain reaches 450,000. With the support of the Telegram community, Ton Chain is gradually attracting more users, especially its influence in the Web3 community is rapidly expanding.
- Solana and APT: Solana and APT have 4.59 million and 5.6 million daily active addresses respectively, with outstanding performance in low fees and high transaction volume.
- Ethereum (ETH): Ethereum has the lowest number of daily active addresses, only 300,000, and Ethereum's user stickiness mainly comes from its high-value smart contracts and DeFi ecosystem.
3. Total Locked Value (TVL) - measuring liquidity
Total Locked Value (TVL) reflects the liquidity and locking status of funds in the public chain ecosystem, and is often used to measure the maturity of DeFi and the degree of user trust in the platform.
Analysis:
- Ethereum (ETH): ETH remains the absolute leader in the DeFi field, with a total locked-in amount reaching $47 billion, far exceeding other public chains. A large number of DeFi protocols and Non-Fungible Token markets still choose Ethereum as their deployment platform, consolidating Ethereum's dominant position in terms of liquidity and user trust.
- BNB: The total locked-in amount of BNB is $4.6 billion, which, although lagging behind Ethereum, still has a strong influence among small and medium-sized investors. BNB maintains a relatively high liquidity thanks to its low transaction fees and the powerful Binance ecosystem.
- Solana (SOL): Solana's TVL is around $6 billion, which has decreased compared to the previous period, mainly due to the instability of its network causing some capital outflows. However, Solana still occupies an important position in the Non-Fungible Token market and still has active users and capital support in the DeFi field.
- TRON and Aptos: TRON's total locked-in amount has reached $400 million, and Aptos' total locked-in amount has reached $700 million. As two emerging public chains, Aptos has quickly attracted capital inflows thanks to its community support and innovative technical solutions. In the future, as more projects and applications are deployed, the liquidity of TRON and Aptos chains is expected to further improve.
- Sui: According to defillama data, the TVL of the Sui network has reached $1.13 billion, setting a new historical high. Now, the locked-in amount of crypto assets on the Sui chain has risen to the top 7 in the entire blockchain market. Among them: the lending protocol NAVI Protocol has a TVL of $493.65 million, with a weekly increase of 1.41%; the lending platform Suilend has a TVL of $256.38 million, with a weekly increase of 13.41%; the lending protocol Scallop Lend has a TVL of $245.33 million, with a weekly increase of 2.21%.
How to Evaluate Layer 1 Blockchains
The valuation of Layer 1 public chains has always been a focus of market attention. Compared to the traditional financial market, the valuation of blockchains is more complex, requiring a comprehensive assessment based on on-chain data and historical price trends. The following are some common valuation methods to help investors determine whether the token price of a public chain is overvalued or undervalued.
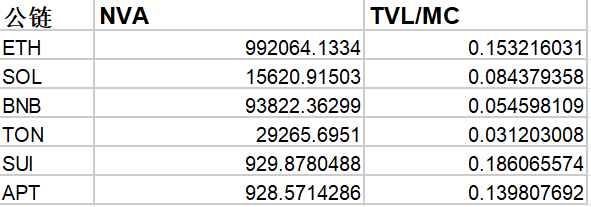
1. Network Value to Active Addresses Ratio (NVA Ratio)
The NVA ratio measures the market value of each active user on the network by comparing the network market value to the number of daily active addresses, similar to the price-to-sales ratio (P/S Ratio) in the traditional market.
NVA = Network Market Value / Daily Active Addresses
Analysis:
- Aptos' market value is $5.2 billion, with 5.6 million daily active addresses, resulting in an NVA ratio of 928. Compared to Sui, whose market value is $6.1 billion and 6.56 million daily active addresses, the NVA ratio is close to 929. This indicates that the activity and market value of Solana and Sui are relatively well-matched, and their prices are relatively reasonable.
2. Total Value Locked to Market Capitalization Ratio (TVL/MC Ratio)
The TVL/MC ratio is used to measure the relationship between the network's locked-in amount (TVL) and market value, reflecting the efficiency of capital utilization.
TVL/MC = Total Value Locked (TVL) / Network Market Value
Analysis:
- Sui's TVL is $1.13 billion, and its market value is $6.1 billion, resulting in a TVL/MC ratio of 0.186. Aptos' TVL is $7.2 billion, and its market value is $5.2 billion, with a TVL/MC ratio of 0.139. This indicates that the growth rate of Sui's TVL is faster than the growth rate of its market value, suggesting that the network token may be undervalued.
Conclusion
Based on the above on-chain data and valuation methods:
Solana, with its low transaction fees and high transaction volume, exhibits a relatively reasonable valuation level.
Although Ethereum still leads in market share and liquidity, its high fees have led to a relatively high NVT ratio, making its price relatively overvalued.
As an emerging public chain, TRON, with its strong community support and innovative features, has shown significant growth potential, and investors can continue to pay attention to its future locked-in amount and user growth.
BNB, on the other hand, has maintained a relatively healthy valuation thanks to its large flow pool and relatively low transaction fees.
Aptos and Sui are in a rapid growth phase and have great potential for the future.
The market is ever-changing, and opportunities come and go quickly. In such a market environment, accurately evaluating the on-chain data and valuation level of each public chain will be the key to seizing the next investment opportunity.


