
Ethereum has seen a strong surge in the past day, becoming one of the cryptocurrencies with the largest gains in the fourth quarter. After a slow recovery over the past few weeks, Ethereum's price has experienced a significant surge and is now showing the strongest recovery momentum since the beginning of the quarter. After breaking through several key resistance levels, ETH is currently trading at around $2,616.
If you want to learn more about the crypto world and get the latest news and information,Weibo Dolphin Dolphin1has more great articles waiting for you~
The recent surge can largely be attributed to a significant increase in open interest contracts. The increase in open interest indicates that more investors and traders are entering the market, which typically leads to increased volatility and the possibility of further price increases.
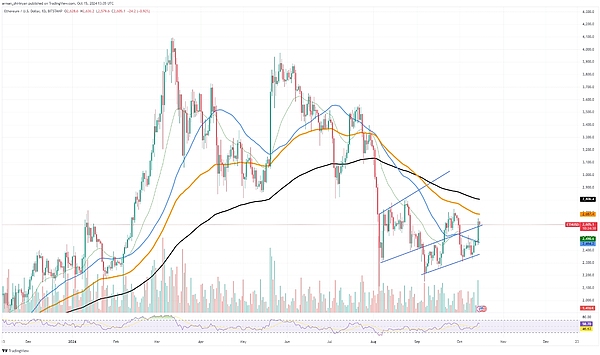
The increase in open interest, with both long and short positions increasing, usually indicates increased market confidence. From a technical perspective, Ethereum has broken through several key resistance lines that have been suppressing the asset's price for months, and has rebounded from the recent support level of around $2,400. The price performance is also developing an upward trend.
The breakout of the 50-day moving average typically signals the start of a stronger bullish trend. However, Ethereum still faces more resistance, especially in the $2,800 price range, and may have difficulty overcoming this without sufficient buying pressure.
Whether Ethereum can maintain this momentum in the coming days is the current question. The recent surge in open interest may indicate that traders are preparing for greater market volatility, but whether this will lead to another major push or if profit-taking will stall the rally remains to be seen.
Is Shiba Inu about to enter an uptrend?
Based on recent price activity, Shiba Inu appears to be on the verge of entering a new bullish phase, indicating a potential uptrend. Combining the significant price increase and on-chain activity, SHIB may signal an improvement in market performance in the near future.
According to technical analysis, as SHIB has broken through the important resistance level of around $0.000018, a potential bullish reversal may have already begun. Maintaining above this level could indicate that the meme coin is set to enter a new uptrend, so traders and investors should closely monitor the situation. If the price can hold above this critical level, bullish investors may set their next target at $0.000020.
Breaking through this level would signal a more significant reversal and could force SHIB to return to the higher resistance levels seen earlier this year.
It is important to remember that the entire crypto market still faces uncertainty, and SHIB will need sustained buying pressure to maintain its upward momentum. Investors hoping to confirm the start of a new bull market should closely monitor price movements and on-chain signals.
Solana faces some risks
Looking at the chart, Solana appears to be forming a double top pattern, which could signal trouble for the asset in the near future. Over the past few weeks, the SOL price has steadily risen, approaching the critical $155 level.
Given the asset's historical performance, this price point is a strong resistance level, and there are growing concerns that the market may not have enough momentum to overcome this resistance. A double top pattern is typically seen as a bearish formation, occurring when the price tests a resistance level twice but fails to break through, leading to a subsequent decline.
In the case of Solana, the chart shows the asset previously reached the $155 level but experienced a significant pullback due to its inability to sustain further upward momentum. As SOL approaches this level again, traders and investors are now cautious about the prospect of another reversal.
As a result, Solana has not benefited from the current market conditions. While the price has risen, the typical trading volume growth that accompanies a strong breakout has not occurred.
Given Solana's immediate support levels at $140 and $135, if it is unable to break through the $155 resistance level again, it may experience a significant decline. Traders should currently closely monitor the $155 threshold. If the asset fails to break through and confirm the double top pattern, Solana's bearish phase may begin soon.
That's the end of the article. FollowWeibo Dolphin Dolphin1for more great articles. If you want to learn more about the crypto world and get the latest news and information, feel free to consult me. We have a professional exchange community that publishes daily market analysis and recommends high-potential coins. There is no threshold to join the group, and everyone is welcome to participate!


