The price of Bitcoin (BTC) has risen 6% in the past 30 days. However, the current trend strength indicated by the ADX shows signs of weakening. Additionally, the recent net inflow of BTC to exchanges suggests a shift to a more cautious attitude among holders.
BTC needs to break through the $68,506 resistance level to reach a new all-time high, but if it fails to maintain key support levels, a downward correction may occur.
BTC's current trend is not as strong as before
The current ADX of Bitcoin (BTC) is 33.55, indicating a moderate trend strength. The Average Directional Index (ADX) measures the strength of a price trend, regardless of its direction.
A value above 20 indicates that the trend is strengthening, and a value above 50 indicates a very strong trend. The fact that BTC's ADX is 33.55 means that the trend still exists, but it is not overwhelmingly strong.
Read more: Bitcoin (BTC) Price Prediction 2024/2025/2030

BTC is currently in an uptrend, but the current trend is much weaker than when the ADX rose above 50 recently. This decrease in trend strength suggests that the driving force for BTC to move higher has weakened somewhat.
The weakening of the trend means that confidence in a sustained upward movement has decreased, and the likelihood of BTC entering a correction or experiencing a downward correction has increased.
BTC net flow shows an interesting situation
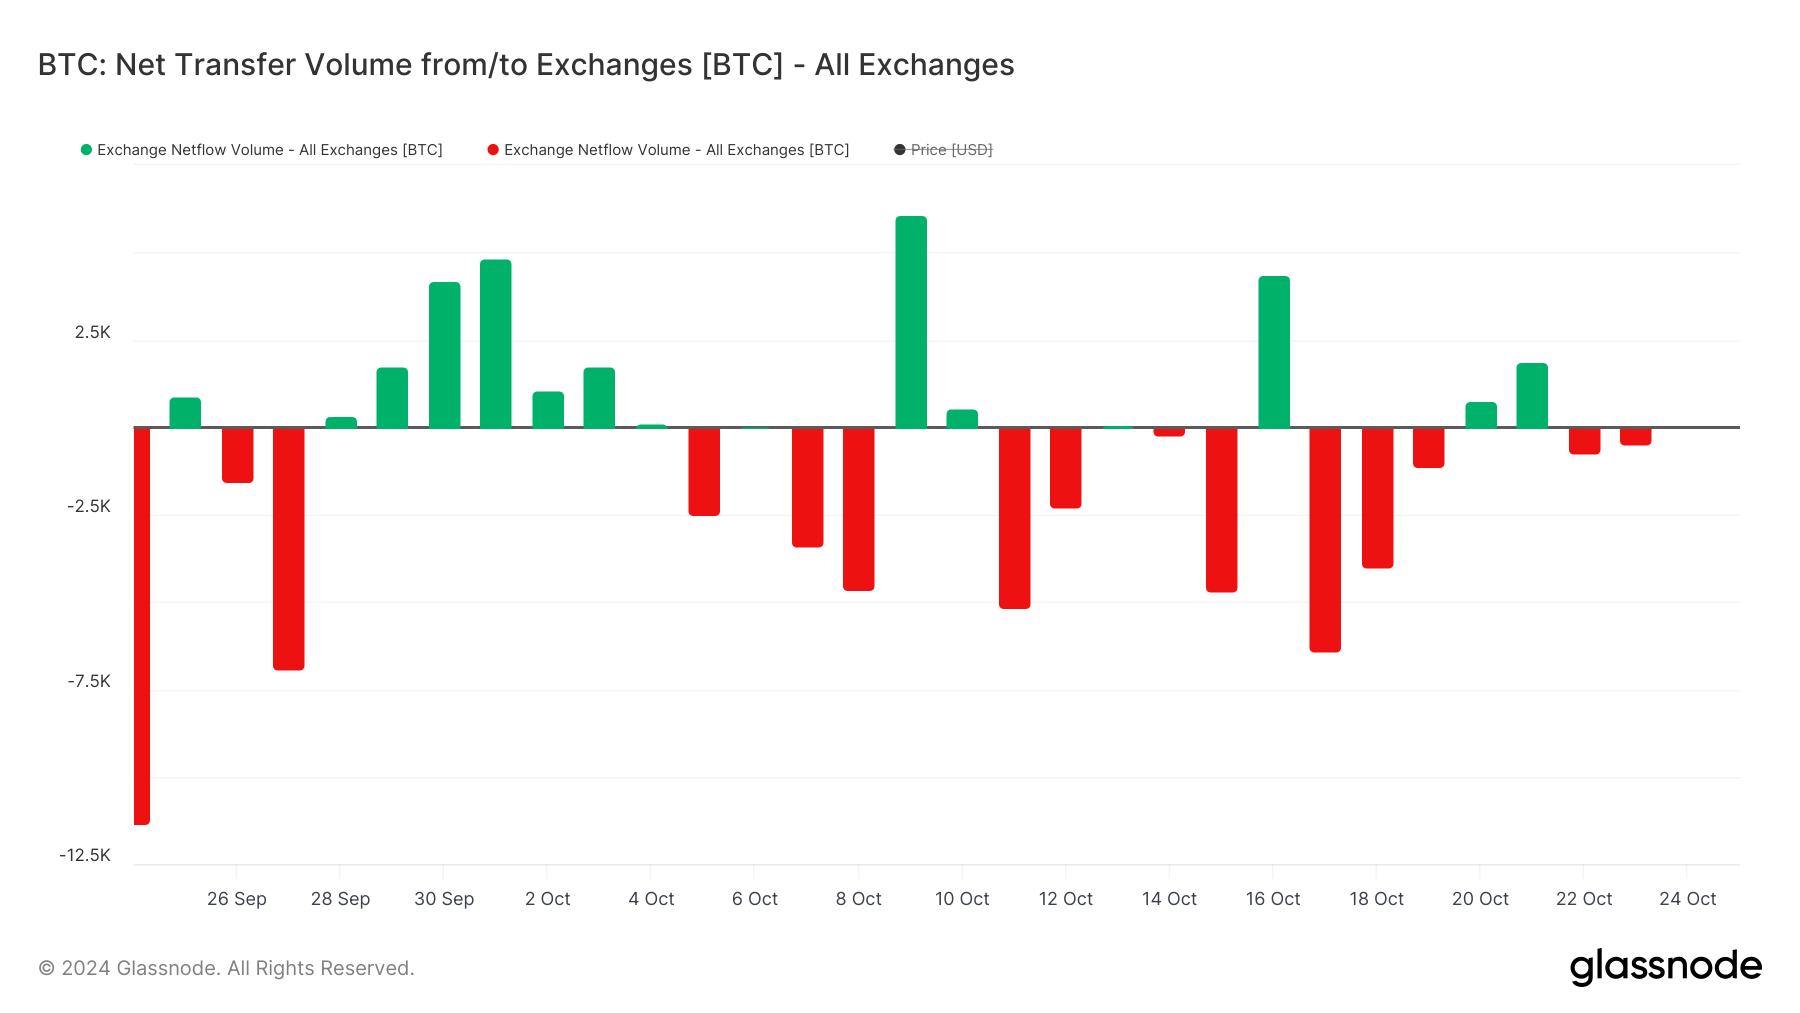
From October 17 to 19, the net transfer volume of BTC to exchanges was around 12,000 BTC, indicating a significant net inflow. Generally, when users move assets from exchanges, it is considered a positive signal as it suggests they do not have plans to sell.
Conversely, an increase in net inflow to exchanges may indicate that BTC holders are preparing to sell, which could suggest an increase in selling pressure.

After a 3-day period of net outflow, where more BTC left exchanges than entered, the trend briefly turned positive and fluctuated over the past two days. The recent net outflow has turned negative again, but the volume is much lower than the sharp increase seen between October 17 and 19.
These changes suggest that holders may have less confidence than before, and their sentiment is shifting to a more cautious direction, which could limit strong upward momentum in the short term.
BTC price prediction, will a new high be reached soon?
The BTC price chart shows that the short-term EMA line is still above the long-term line, which is a positive signal. However, the gap between these EMAs has narrowed compared to a few days ago, indicating that the upward momentum is weakening.
This may suggest that the uptrend is losing steam and the market may be in a more cautious phase.
Read more: What is a Bitcoin ETF?

If BTC can break through the $68,506 resistance level, it has the potential to rise further and reach $70,036, setting a new all-time high.
However, if the current trend reverses, BTC's price may retest the $62,648 support level. If this support level is not maintained, BTC could decline further, with the next major support level at $57,830.


