Author: Digital Asset Research Source: digitalassetresearch Translator: Shan Ouba, Jinse Finance
The long-awaited week is finally here. The US presidential election will be held tomorrow, and then on Thursday, we will have the FOMC interest rate meeting.
As always when elections are approaching, the market tends to become volatile, leading people to believe that this time is really different, and that the election result is very important.
The election result will have a significant impact on asset prices.
If Harris wins, it's all over, and we'll enter a decade-long bear market. If Trump wins, we'll see an unprecedented surge.
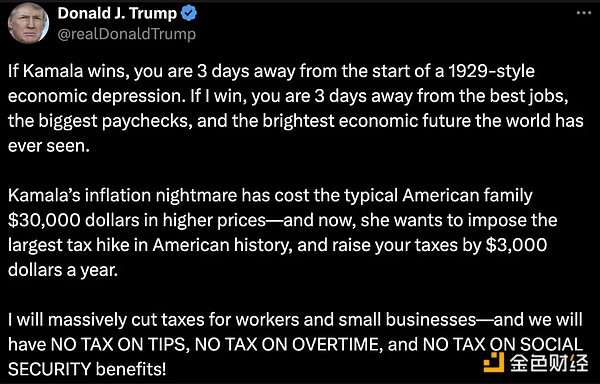
These two statements are far from the truth. Seeing people on social media excitedly say that Trump must win to save the market is simply ridiculous.
But people seem to ignore that Biden's economics and Harris' collaboration have actually set new highs in asset prices.
So, tell me again, how bad are the Democrats in the market?
This is a completely unfounded claim, showing how limited these people's real understanding of the market is.
As long as the government continues to spend money and accumulate debt, the cycle will continue to operate, regardless of who is in power.
Regardless of the outcome, the immediate impact of the election is likely to be temporary. The public is the one who trades on news, and they are almost always wrong.
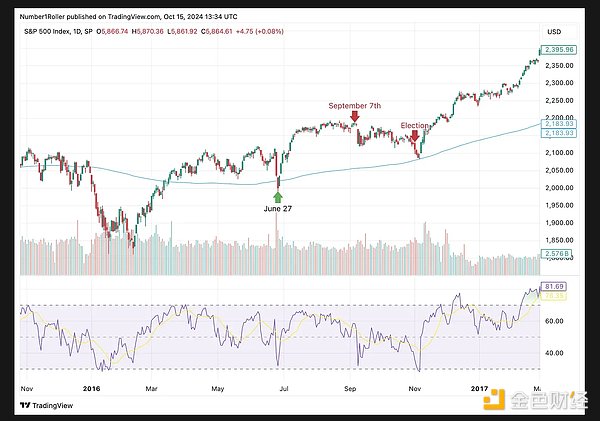
Look at the 2016 election, when Trump's victory was undoubtedly one of the biggest surprises in US election history. Experts thought it would be the end of the world, and the market would continue to decline.
What actually happened? The market immediately fell 2-3 days, then rebounded.
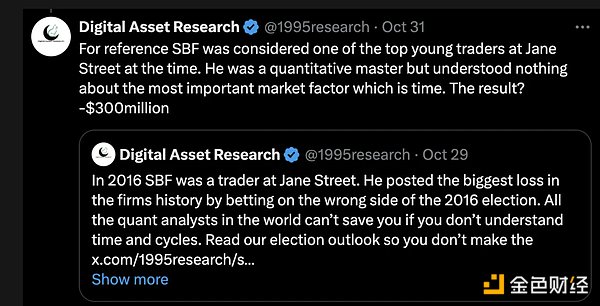
To emphasize this point, I shared this post on social media last week. We see that the savvy SBF shorted at the election low, losing $300 million. Of course, Wall Street thought Trump was a disaster for the market, so much so that their quantitative models were severely impacted.
If Harris wins, will we see a similar scenario?
I am by no means a supporter of Harris, I just want to point out that if Harris wins, the market will not immediately collapse.
The market is currently enthusiastic about trading on Trump, but fearful of Harris' policies. I imagine that if she wins, Wall Street will panic again, only to find a few days later that we are in a bull market.
However, putting the election aside, let's focus on what's really important.
I've discussed in detail the potential for a slow market that I've seen in 2012 and 2016, and our current situation is more similar to those two cycles than the 2020 cycle.
In simple terms, this week we are at another critical time point. It just happens to be election week, but you can see that the timing seems destined for this news.
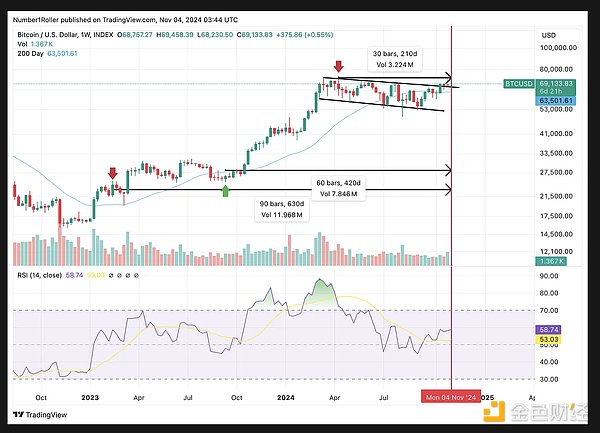
Looking at the weekly chart, we can see that we are 30, 60 and 90 weeks away from the key turning points of the current cycle. 90 weeks ago, we reached a weekly high, marking the beginning of the banking panic. 60 weeks ago, we touched the low end of the 2023 summer range. 30 weeks ago, we experienced a mood swing before the escalation of tensions in the Middle East.
Next, we see the intersection of the daily and weekly cycles. Below, you can see that the analysis based on the time angle has been valid since the beginning of this month, with consistent major turning dates. Today is November 3rd, and we are 90 degrees away from the low in August.
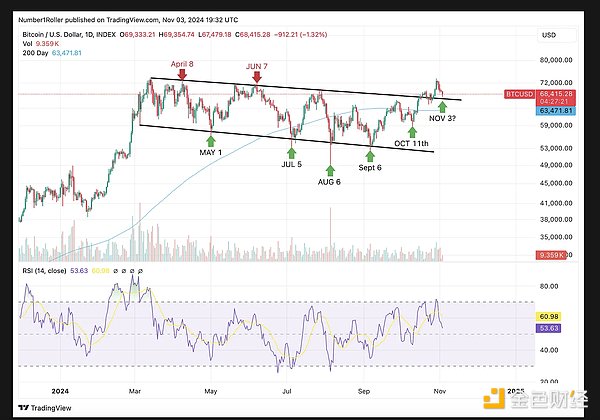
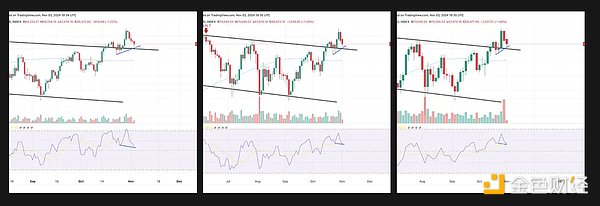
Finally, these important time factors are consistent with the bullish reversal of the RSI, just at the retest of the breakout range. The chart below shows the situation in multiple time frames, with 1-day, 2-day and 3-day charts all showing bullish signals.
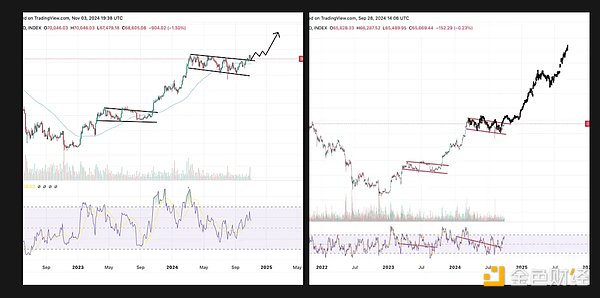
The last thing I want to leave you with is an update on the fractal chart of BTC and NVDA that I've been sharing for a few months. Not only does it almost perfectly match expectations, but it also reminds us of what BTC's true expansion looks like. Even in this fractal chart, it suggests a gradual upward process for the last two months, followed by a more significant move starting in December that will continue until 2025.
So, don't be distracted by the noise of the election. Anyone who thinks Harris is bad for the market can ask why our current market levels have set records. Anyone who thinks Trump can save the market can ask which market needs saving.
Time is the most important factor, and regardless of who the person or woman is, the cycle will continue to progress. We are still in a healthy bull market trend, making higher highs and higher lows. The current correction is expected to reverse this week in line with time rules and bullish technical indicators. The market will test your patience and conviction again and again, don't be swayed by short-term noise.


