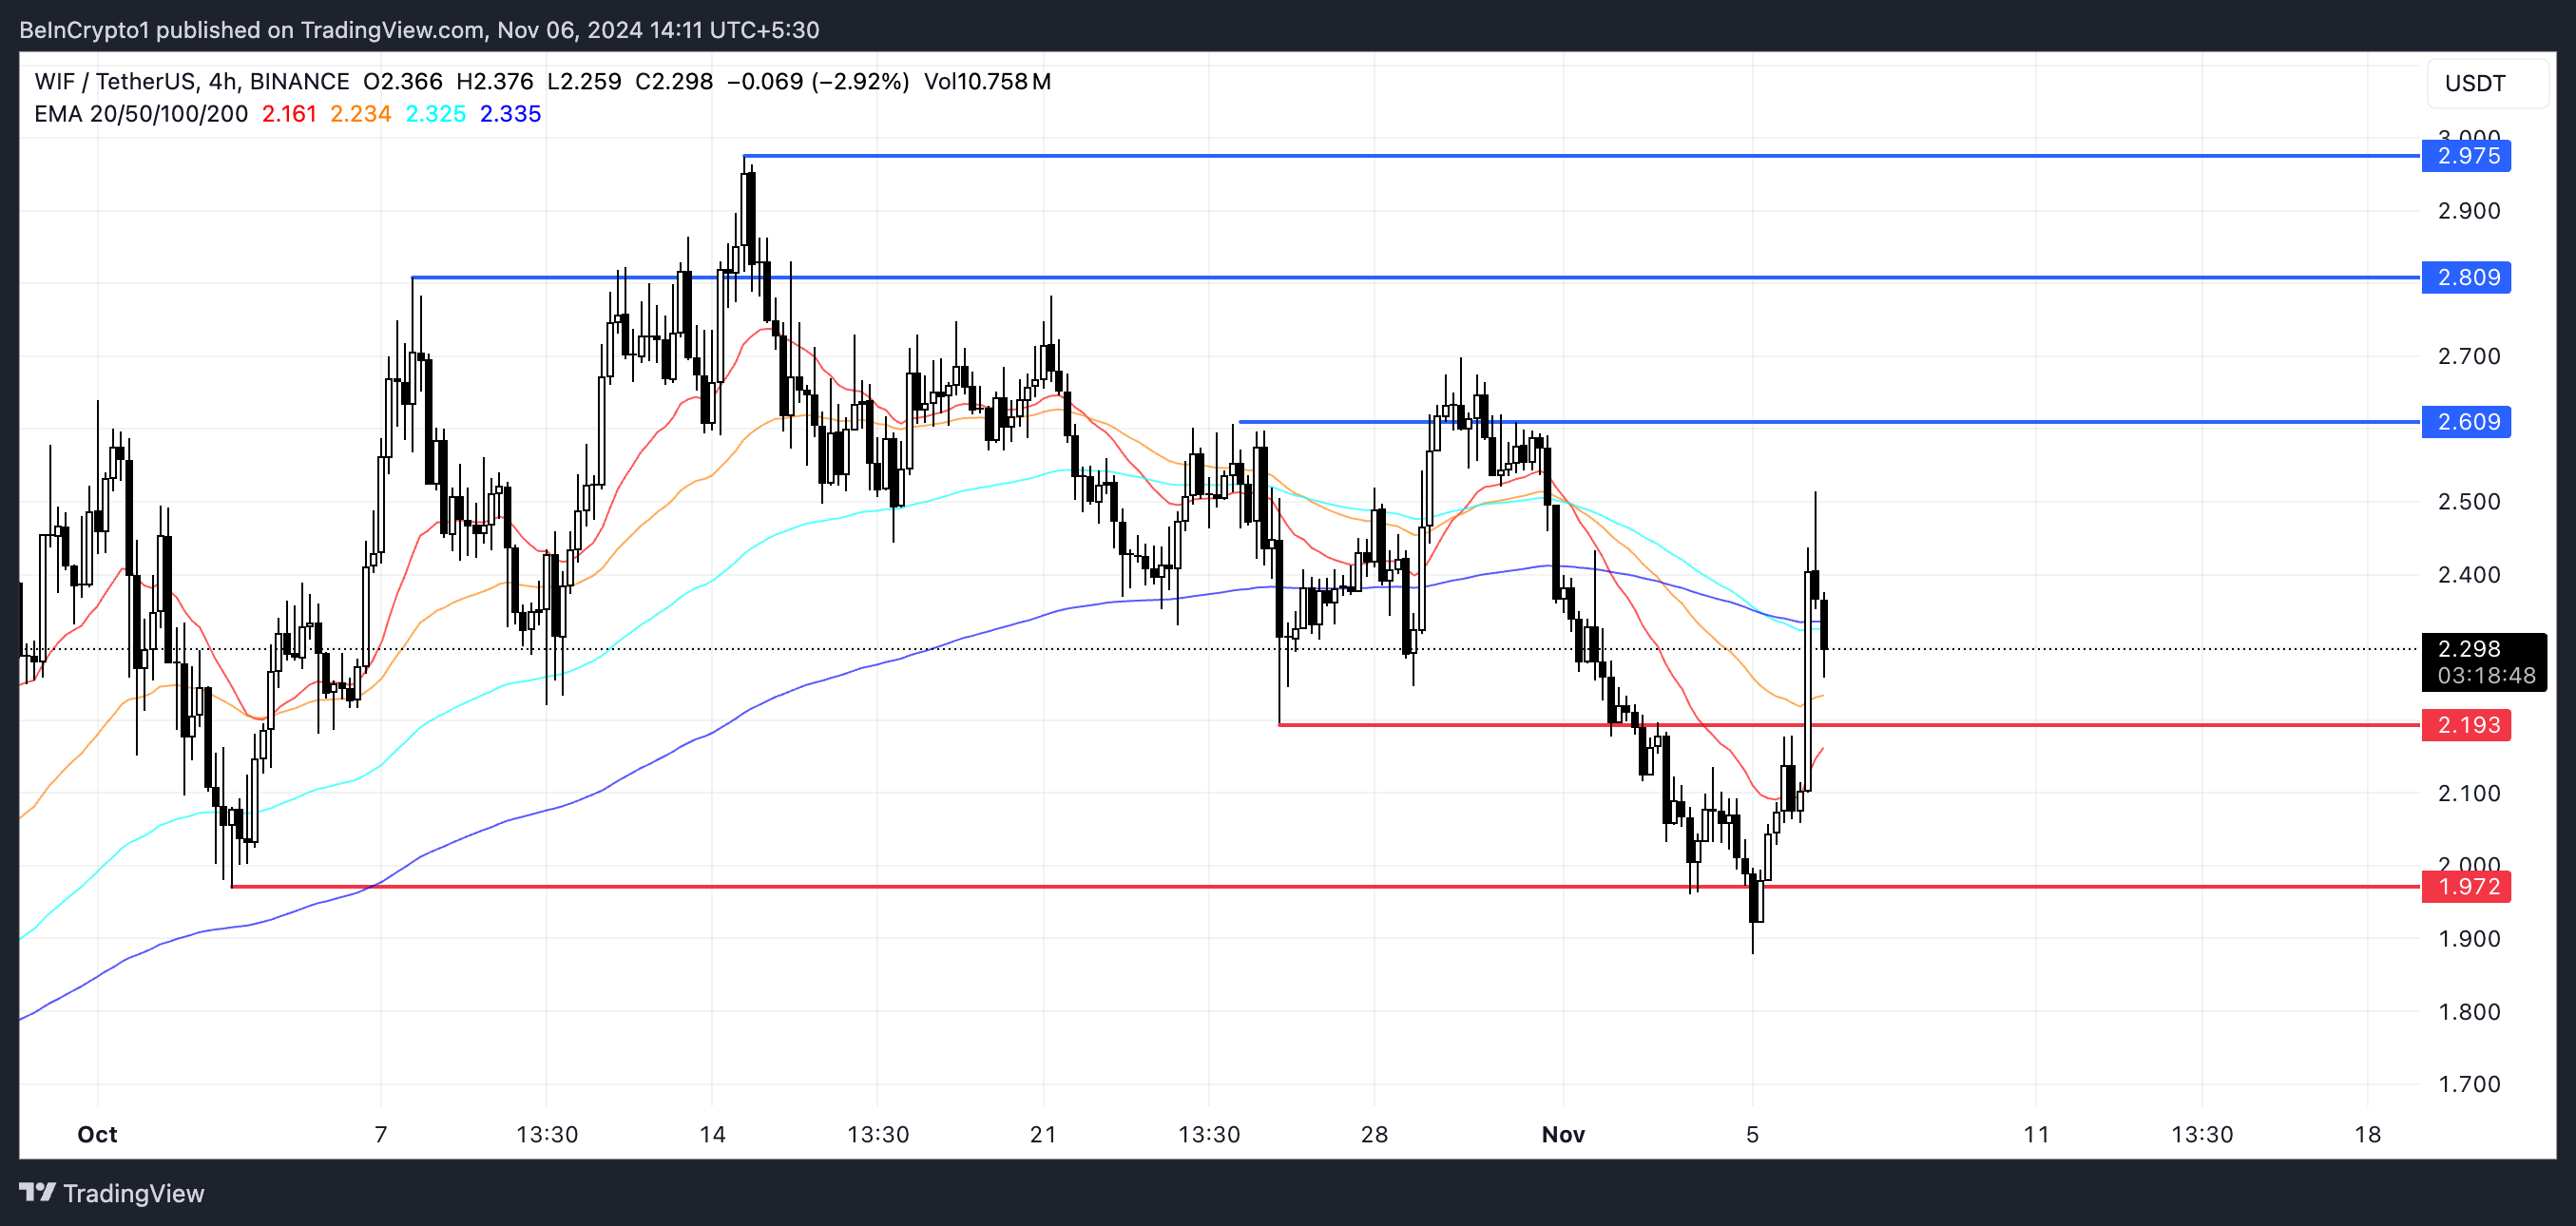
The price of Dogwifhat (WIF) has risen by more than 10% in the last 24 hours, raising questions about whether it can rise even higher. Technical indicators show a balanced trend that could turn bullish, and the RSI indicates that WIF is not yet overbought, leaving room for further upside without immediate correction risk.
Additionally, WIF's ADX remains strong, supporting the possibility of a sustained trend if the short-term EMA crosses above the long-term EMA, forming a golden cross. If this bullish formation occurs, WIF could target higher resistance levels, but if it fails to maintain the uptrend, the price could return to key support areas.
RSI, WIF Not Yet Overbought
Dogwifhat (WIF) has surged more than 10% in the last 24 hours, generating significant gains as one of the most prominent meme coins, but its RSI level of 58.30 has not reached the overbought zone. This indicates that WIF is in a neutral stage, suggesting that the buying momentum has not reached extreme levels despite the recent price increase.
The RSI, or Relative Strength Index, measures the speed and change of price movements. Levels above 70 are considered overbought, while levels below 30 are considered oversold.
Read more: How to Buy Solana Meme Coins: A Step-by-Step Guide

Since WIF's RSI is below the overbought threshold, there is room for the price to continue growing. This neutral RSI level suggests that WIF can maintain its uptrend and proceed without major downside risk.
However, traders should closely monitor the RSI. If it approaches 70, the peak of buying pressure could increase the likelihood of a price correction.
WIF ADX Currently Strong Trend
Currently, WIF's ADX is at 29.5, slightly down from above 35 in recent days. This indicates that the trend is still strong, but the strength has slightly weakened.
The ADX, or Average Directional Index, represents the strength of a trend, but not its direction. Levels above 25 indicate a strong trend, while levels below 20 suggest a weak or non-trending market. Despite the decrease, the ADX level above 25 suggests that WIF is still in a strong trend.

At the same time, WIF has the potential to form a golden cross, where the short-term EMA crosses above the long-term EMA, often considered a bullish signal. If this golden cross materializes, supported by the strong ADX, it could trigger a new price rally.
This setup indicates that WIF can maintain its upward momentum, regardless of whether the trend strength is maintained or regains strength.
WIF Price Prediction, Potential for 30% Upside?
Currently, WIF's EMA lines show a bearish configuration, with the short-term EMA below the long-term EMA, indicating recent downward pressure.
However, the recent price movements have significantly raised the short-term EMA, suggesting the possibility of a trend reversal. If these short-term lines cross above the long-term lines, a golden cross will form, providing a bullish signal and potentially triggering a price increase.
Read more: How to Buy Dogwifhat (WIF) and Other Information

If this bullish crossover occurs, WIF's price could break through resistance levels around $2.6, $2.8, and $2.97, potentially representing a 30% price increase.
Conversely, if the uptrend fails to materialize and bearish momentum resumes, WIF could revisit the support areas around $2.19 and $1.97.


