Pendle [PENDLE] saw significant gains at the beginning of the year, reaching a peak of 600% in April. In the following months, the price retraced to the 75% Fibonacci retracement level and rebounded in August.
As of the time of writing, Pendle is trading at $5.3, up 355% year-to-date.
Pendle is experiencing remarkable growth, fundamentally transforming yield optimization by marking future earnings and maximizing returns.
With the monthly chart potentially closing above $6.3, the price may challenge the historical high of $7.52 in December.
Join the discussion group → → VX: TZCJ1122
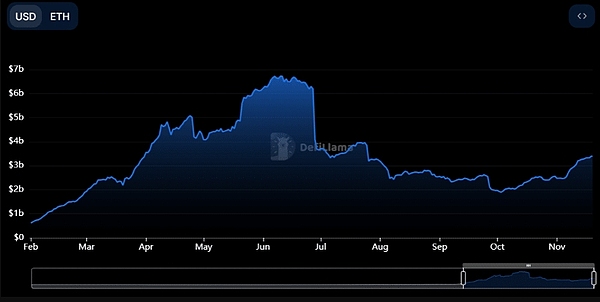
Pendle's TVL continues an upward trend
The token's TVL has been steadily rising since February, surpassing $60 billion in June, indicating strong growth and high user adoption.
However, a significant drop occurred in July, with TVL declining to around $30 billion, reflecting a possible market adjustment or liquidity outflow.

Since August, the TVL has shown resilience, stabilizing around $30 billion, and then gradually recovering in October and November.
At the time of writing, Pendle's TVL stands at $33.92 billion, highlighting the restoration of market confidence and increased participation in its ecosystem.
Price action sparks new optimism
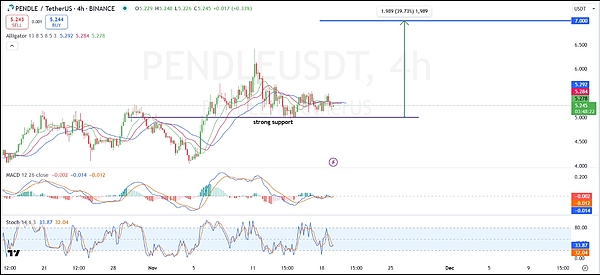
The 4-hour chart of PENDLE shows the price consolidating above the strong support level of $5.00. If the bullish momentum continues, the target price could be $7.00, implying an upside potential of 39.73%.

The price action remains range-bound, with the Alligator lines converging, indicating a lack of clear directional momentum.
Additionally, the MACD is slightly bearish, with the line below the signal line, reflecting weak momentum.
However, the histogram shows decreasing bearish pressure, suggesting a potential reversal. Meanwhile, the Stochastic RSI is approaching the oversold region at 33.87, indicating the price may rebound.
Pendle rebounds due to funding rate adjustment
The chart illustrates the relationship between Pendle's price (yellow line) and the Funding Rate Weighted Average Funding Rate (green area) over time.

In early November, the funding rate briefly turned negative, accompanied by a slight price decline, indicating short-term bearish sentiment.
However, as the funding rate stabilized and turned positive, Pendle regained momentum, reflecting renewed confidence.
That's the end of the article. Follow the public account: Web3团子 for more great articles~
If you want to learn more about the crypto world and get the latest news, feel free to consult me. We have the most professional community, where we publish daily market analysis and recommend high-potential coins. No threshold to join, welcome everyone to discuss together!
Join the discussion group → → VX: TZCJ1122


