Author:Ostium
Compiled by: TechFlow

This article represents personal views and is intended to provide entertainment and informational reference, not investment advice. If you need investment advice, please consult a qualified professional.
In Ostium Research's 15th market outlook, we analyzed the market dynamics for the coming week together with @cointradernik, focusing on the price trends, market positions and potential event risks for Bit, ETH, gold, copper and the US dollar index.
Important Economic Calendar This Week
This week will see a number of important global interest rate decisions, with extremely high market attention:
Tuesday: Reserve Bank of Australia (RBA) interest rate decision (expected 4.35%, previous 4.35%)
Wednesday: US Consumer Price Index (CPI) year-on-year (November) (expected 2.7%, previous 2.6%)
Wednesday: Bank of Canada (BOC) interest rate decision (expected 3.25%, previous 3.75%)
Thursday: Swiss National Bank (SNB) interest rate decision (expected 0.75%, previous 1%)
Thursday: European Central Bank (ECB) interest rate decision (expected 3%, previous 3.25%)
Thursday: US Producer Price Index (PPI) year-on-year (November) (expected 2.5%, previous 2.4%)
Bit (Bitcoin)
Current Price: $99,460
Weekly Analysis
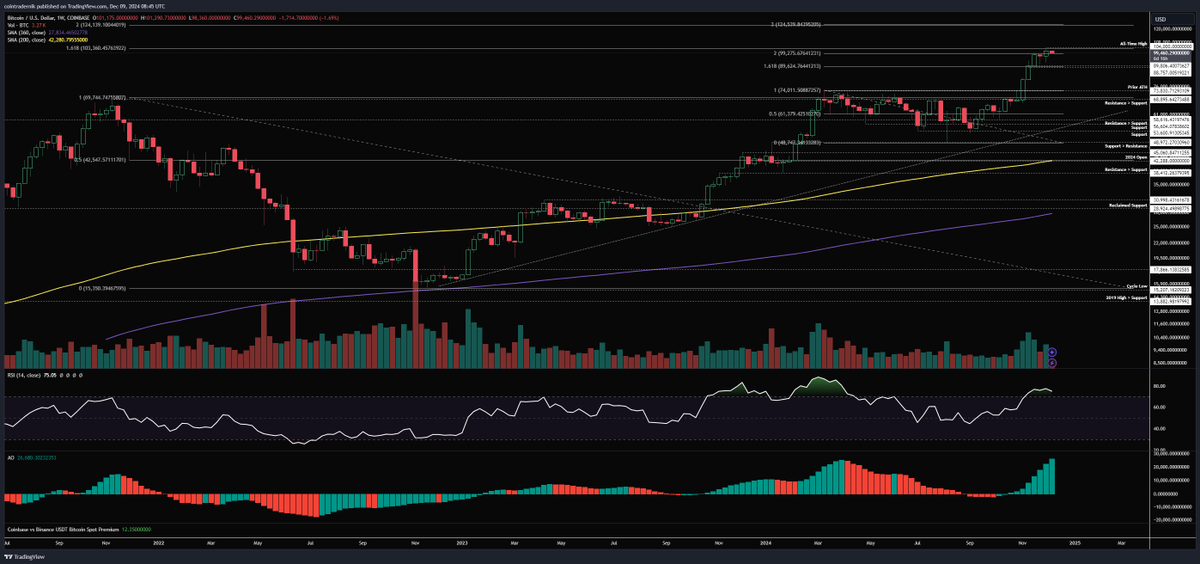
Last week, Bit made history by closing above $100,000 for the first time, surpassing the previous two weekly highs above $99,000. Although trading volume has declined slightly, the price momentum remains strong, and the weekly structure remains bullish. Bit is currently firmly above the key resistance zone, and if the price continues to gain market recognition, it may further rise.
However, it should be noted that Bit's price performance this year has closely matched an "11-week lagged M2SL/DXY liquidity correlation". This correlation has almost precisely predicted Bit's price fluctuations in 2024. If this correlation continues, Bit may start a multi-week price correction this week, with the bottom potentially forming in late January to early February next year.
However, it is also possible that this correlation may be broken. If Bit's weekly structure and momentum dominate, the price may see a new round of uptrend, targeting ~$125,000, which is the next major resistance area.
Key Observations:
If the weekly closing price is above the previous week's high of $104,000, it may indicate that the correlation has been broken, and Bit may rise to $125,000 before the end of the year.
If the price fails to stabilize above $104,000 this week and instead falls back below $99,000, it may indicate that the correlation continues to play a role, and Bit may further decline before January, possibly even breaking below $89,000.
In summary, this is a very critical week for Bit's trend, and it is worth close attention.
Daily Analysis:
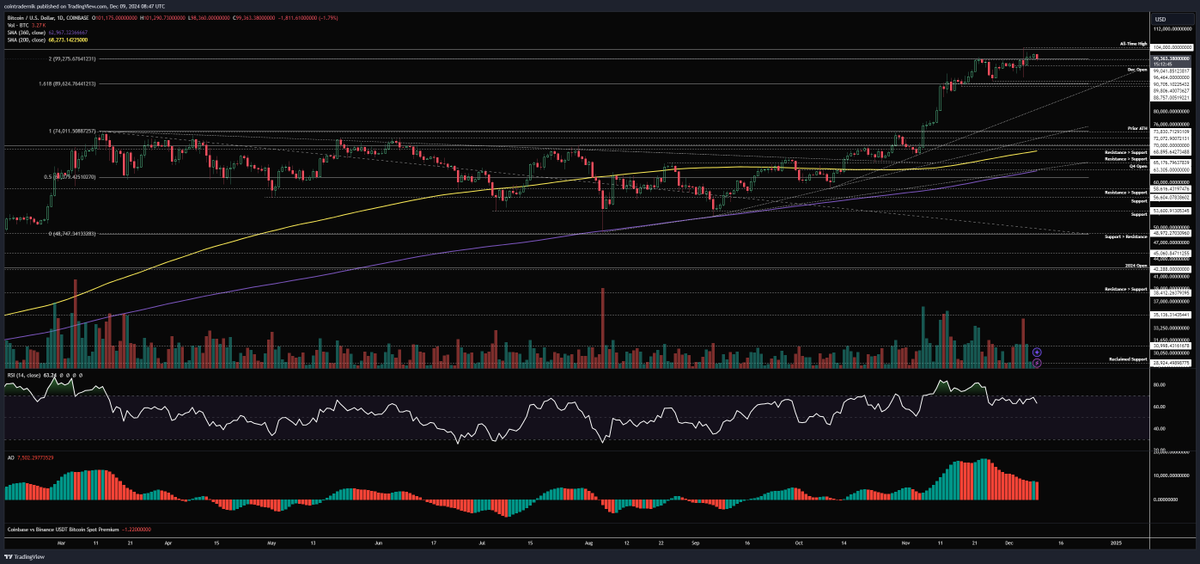
On the daily chart, Bit's momentum is starting to weaken. Since August, the series of higher lows formed by the RSI (Relative Strength Index) may experience a pullback. If the RSI falls below 50 and stabilizes below this level this week, it may signal that Bit is entering a correction phase. However, the momentum has not yet completely dissipated, and the daily structure remains bullish. Any pullback at the beginning of the week is expected to retest the previous week's high, and the market's response to this will determine the subsequent trend. If the daily closing price breaks above $104,000 and converts it into support, Bit may rise to $125,000; but if the price fails to stabilize at this level and instead falls back below $99,000, even below the December opening price of $96,500, it may indicate that the market momentum is exhausted.
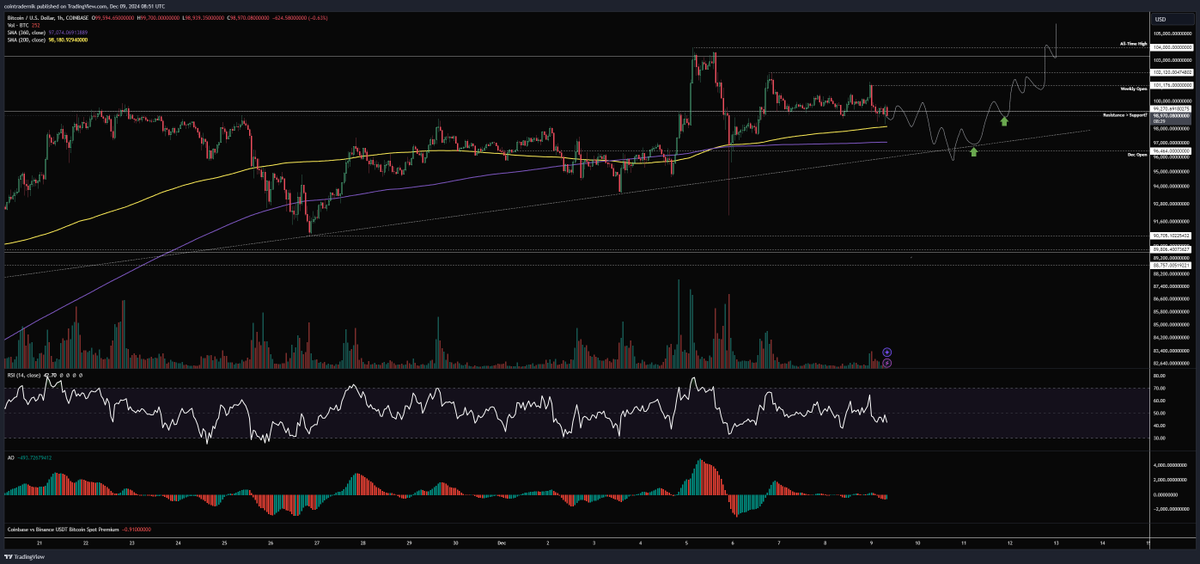
Long Strategy: If the price continues to slowly correct at the beginning of the week, and the weekly opening price and weekly high (formed at the beginning of the week) are not reached, consider taking a long position around the December opening price. Once the price firmly stabilizes above $99,300 and converts it into support, further increase the position, with a target of the new high of $104,000 later this week. This scenario is more likely to indicate that the Bit correlation has been broken.
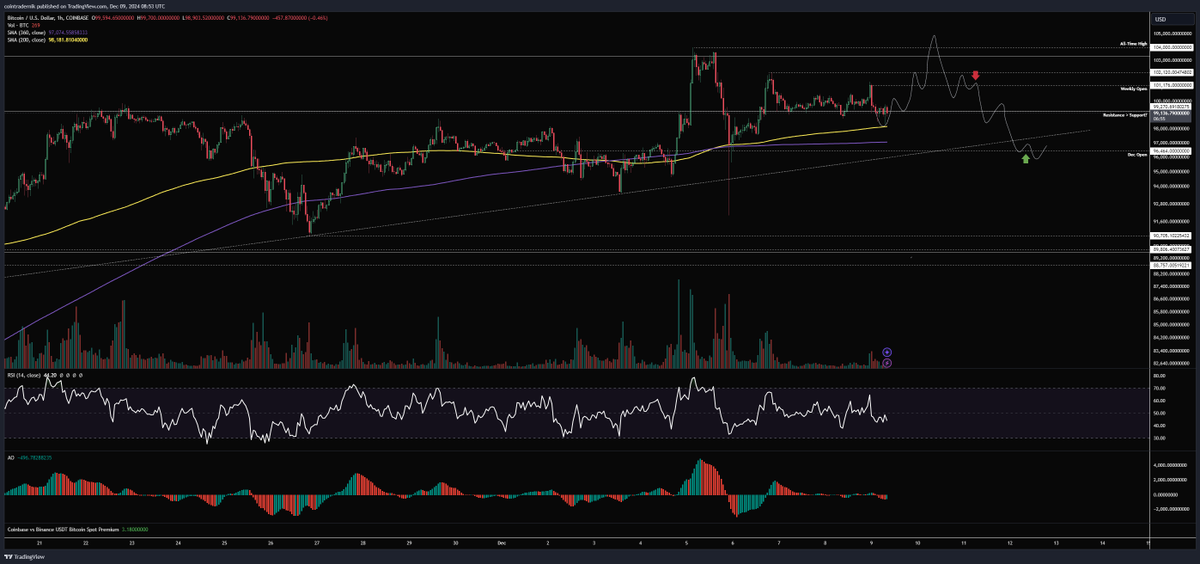
Short Strategy: If the price breaks through the weekend high to $104,000, but is then rejected and falls back below the weekly opening price of $101,200, it may trigger a long position liquidation squeeze, leading to further downside. The trend line support may be tested later this week, and this is more likely to indicate that the correlation is still in effect and a larger correction is beginning.
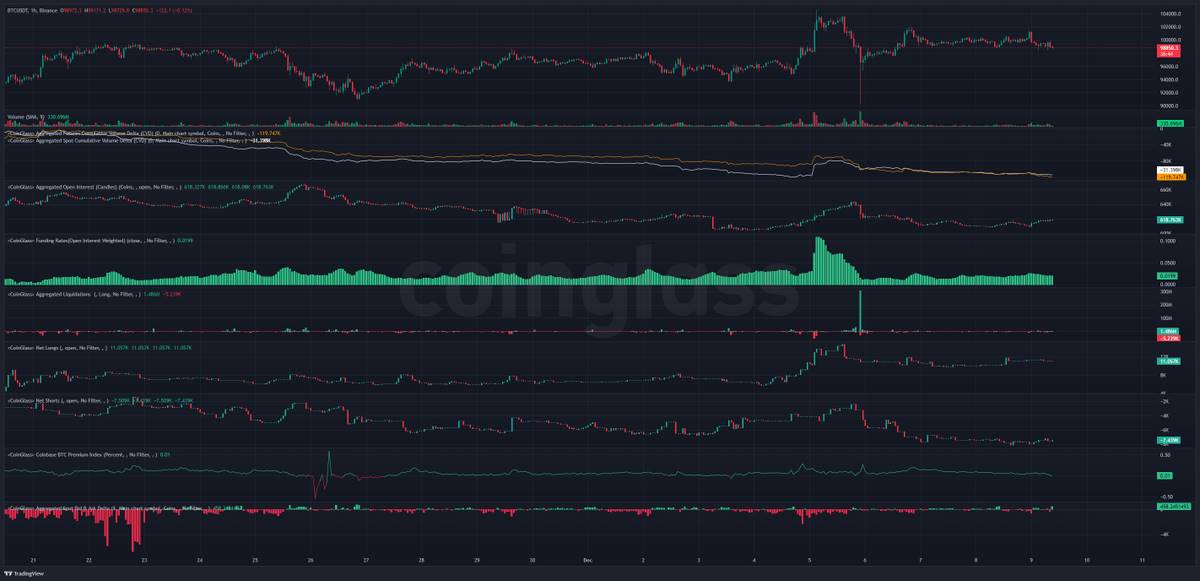
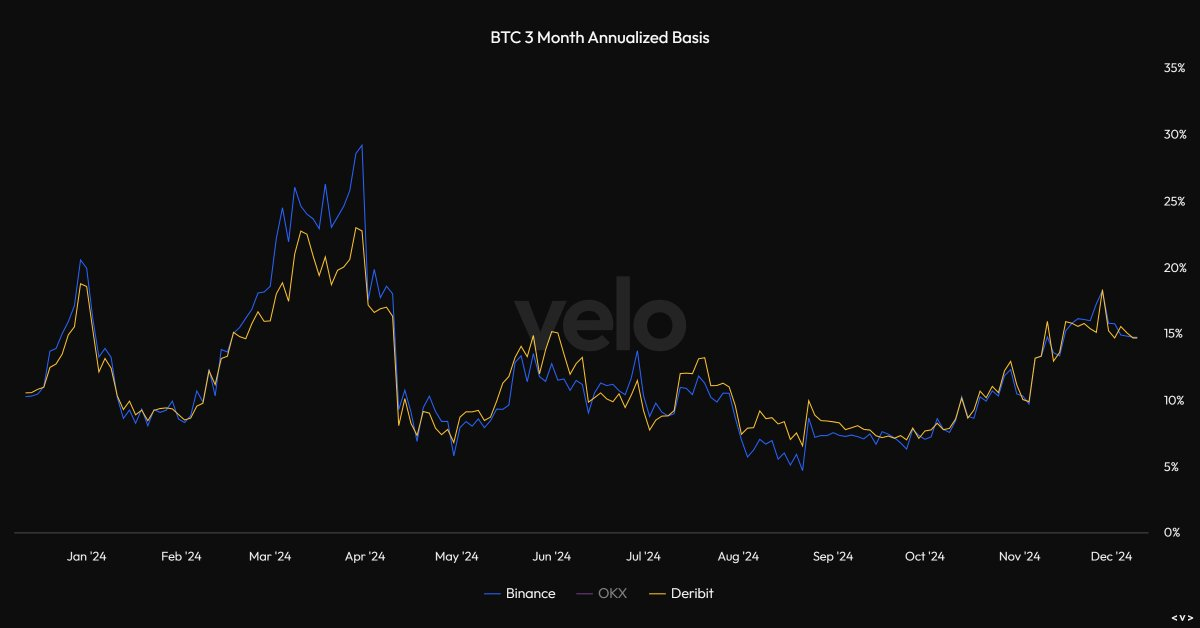
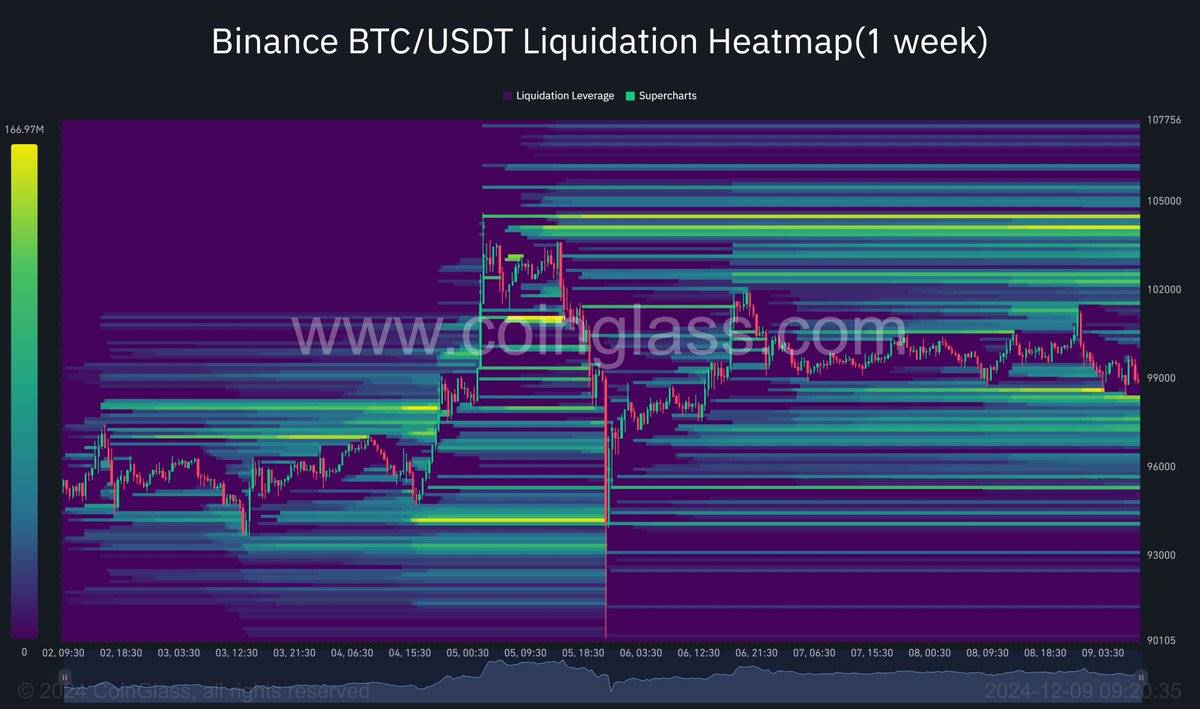
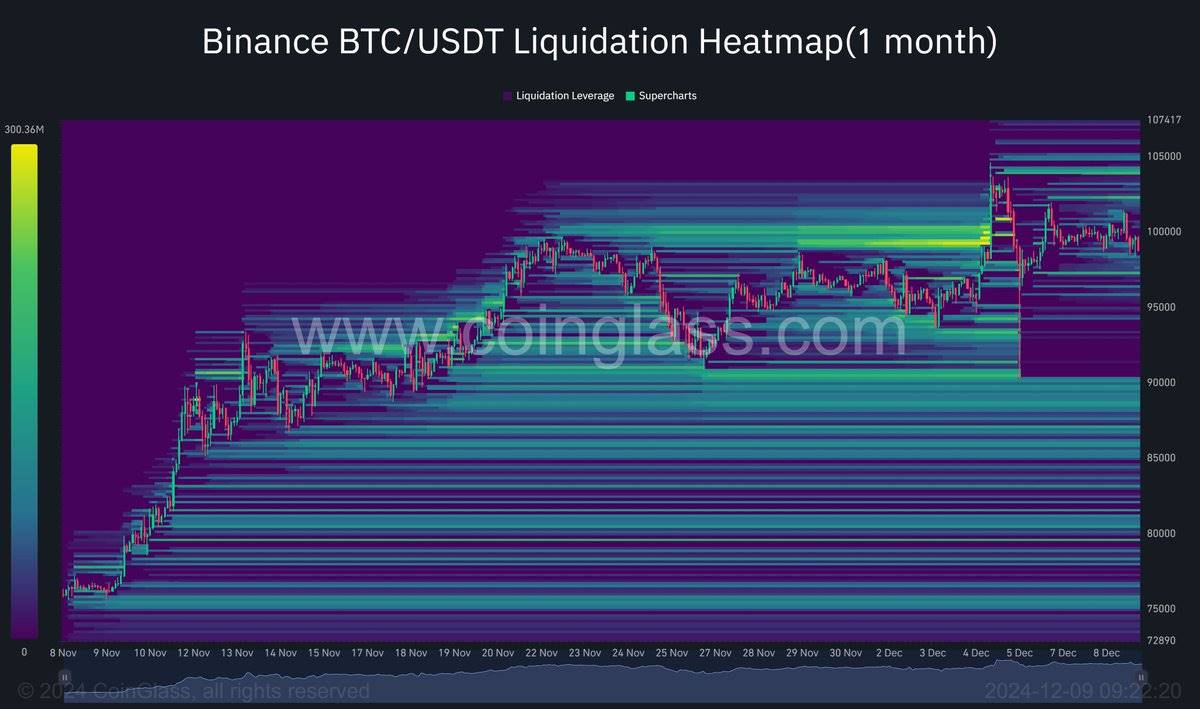
The current market positioning shows that last week's flash crash has cleared the over-leveraged derivatives market, providing stronger support for Bit to break above $104,000. The changes in the 3-month annualized basis and liquidation levels further validate this.
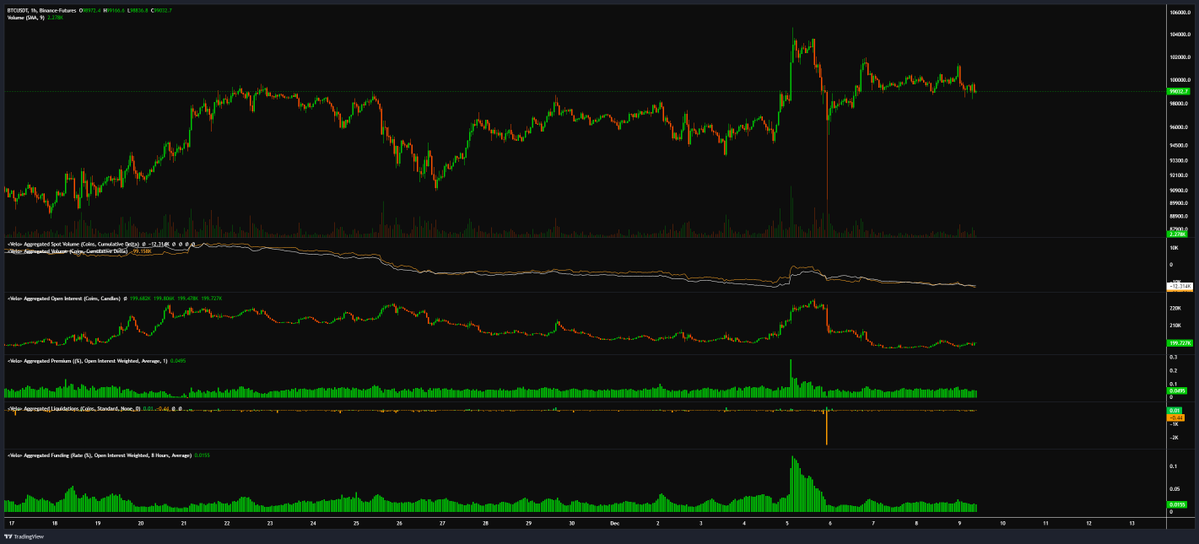
This can be further verified from the 3-month annualized basis:
In addition, the expected 1-week and 1-month liquidation levels are shown below.
ETH (Ethereum)
Current Price: $3863
Weekly Analysis
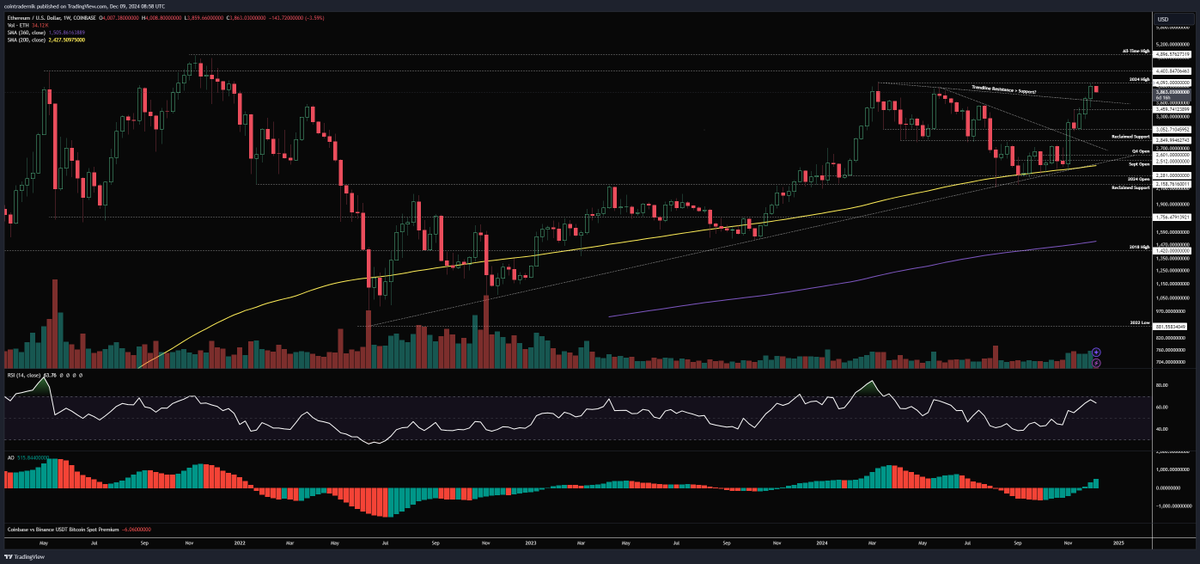
ETH price firmly broke through the last trend line resistance last week and found support above it, subsequently rising to a new annual high of $4093, and finally closing around $4000, accompanied by increased trading volume and momentum. If the price retests this trend line this week, it is expected to act as support and push the price to retest $4093. Once the weekly closing price breaks above this level, the price may further rise to $4400, or even challenge the historical high of $4900. Based on the current structure and momentum, ETH remains in a strong bullish trend, and I believe it will continue to strengthen before the end of the year, even if Bit corrects. Only when the weekly closing price falls below $3450 will the bullish view need to be reassessed.
Daily Analysis
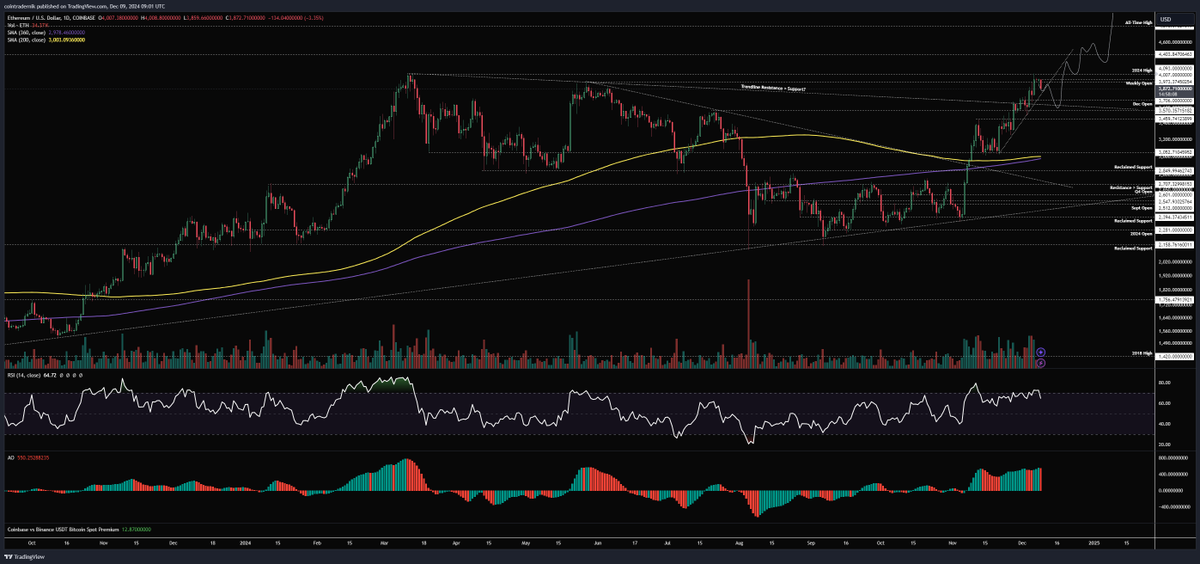
The daily chart shows that the trend line support for ETH since mid-November remains solid. If the price continues to maintain above this trend line this week, it is expected to form a low point at the beginning of the week, and then the daily closing price will break through the 2024 high of $4093 and convert it into support, driving the price further upward towards 2025. If the price breaks below the trend line, it may pull back to the December opening price of $3700, and after converting it into new support, continue to rise.
ETH/BTC Analysis
Weekly Analysis
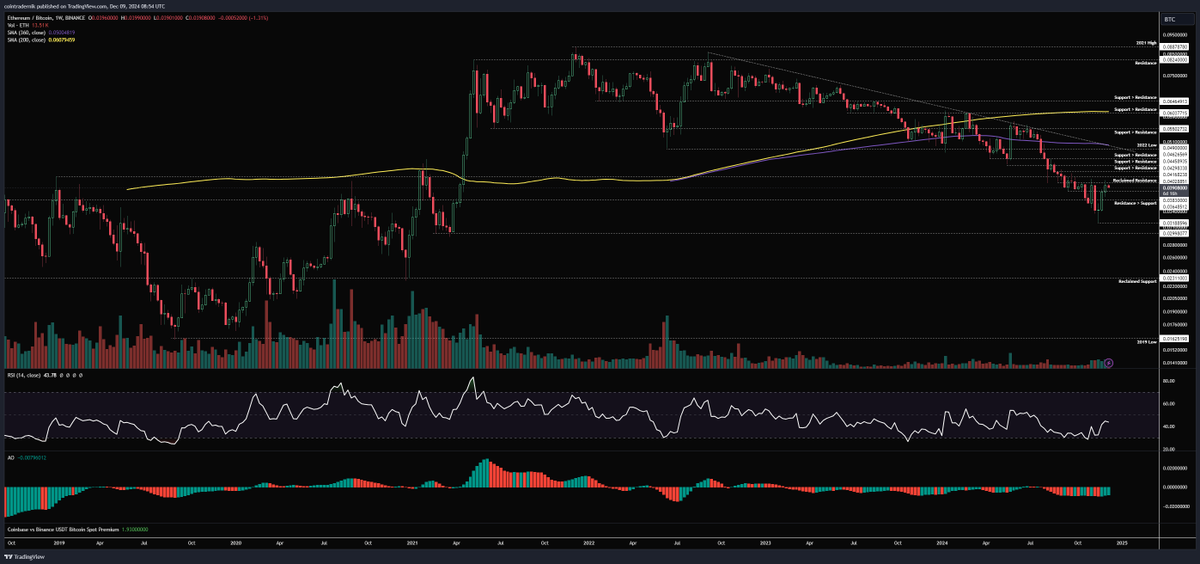
ETH/BTC has continued the rebound momentum from the previous week on the weekly chart, with the price rising to the resistance around 0.0403, and closing at 0.0396. This week, it is expected to further break through 0.0403 and test 0.0417, which will be a decisive resistance. If the price breaks through and stabilizes above 0.0417, it may trigger a larger-scale reversal, targeting the long-term trend line resistance and the 2022 low of 0.049. If the price deviates from this resistance zone and falls back below 0.0383, it may indicate a failed bottom formation. The weekly structure will also turn bullish if it is accepted above 0.0417.
Daily Analysis:
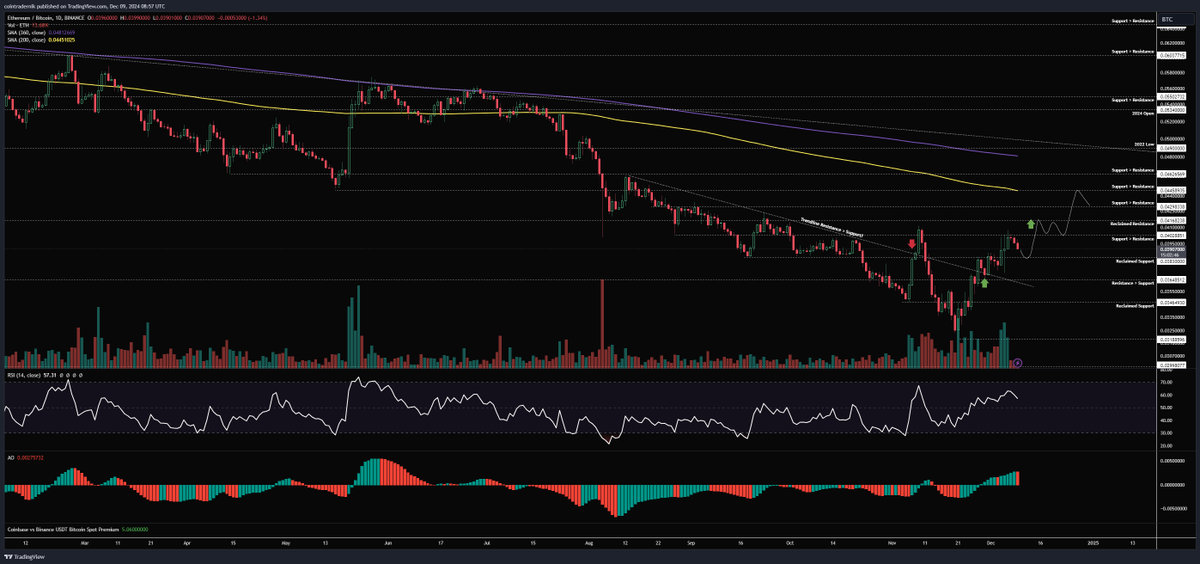
Looking at the daily chart, our previous expectation that the price would not see a false breakout after breaking through the local trend line resistance appears to be correct. The trend line has now turned from resistance to support, driving further price increases. Going forward, we expect 0.0383 to become a new support level, and the price is expected to break through and stabilize above 0.0403 this week, then test 0.0417. Around this key level, the price may need to consolidate for a period to confirm the market's breakthrough of this level. Once 0.0417 is successfully broken, the next target will be the 200-day moving average (200dMA) at 0.0445, which may become a key resistance for the subsequent uptrend.
Gold
Current Price: $2650
Weekly Analysis
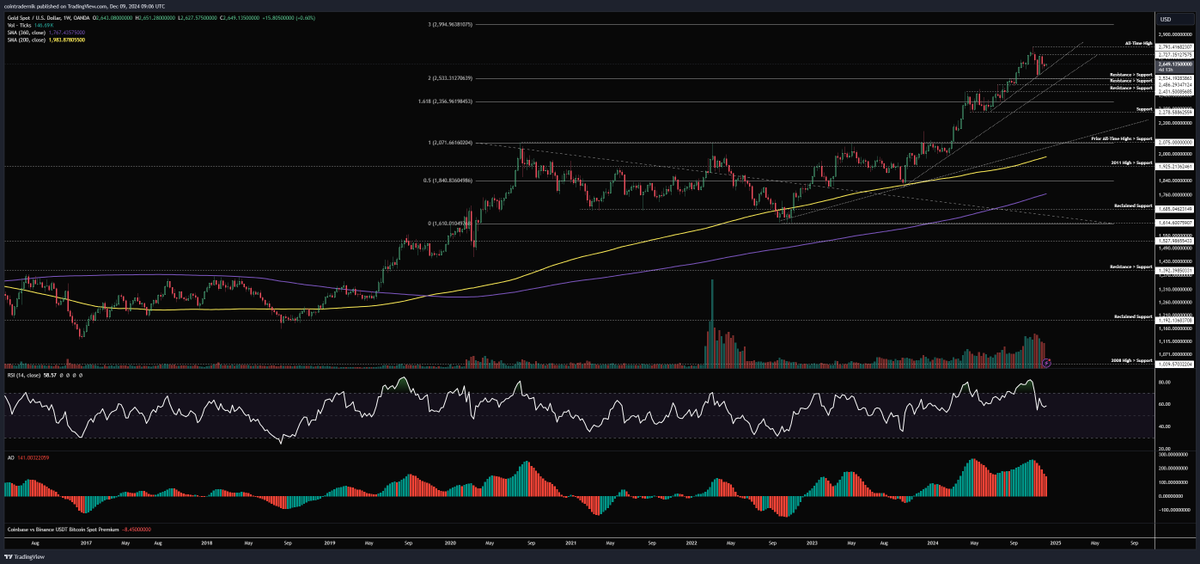
Looking at the weekly chart of gold, the price has been trading above the trend line support, consolidating below $2727 in the past few weeks, and last week formed a higher low above the trend line. The market is currently approaching a key decision point. If the weekly close breaks below the trend line support, it may trigger a deeper correction, with targets at $2535 and $2430 in turn; if the weekly close breaks above $2727, it may signal the start of the next uptrend, with a target of $3000. The market is currently in a wait-and-see state, and the direction needs to be further confirmed. If the weekly close breaks below $2535, it may turn into a bearish structure and confirm the formation of a medium-term top.
Daily Analysis
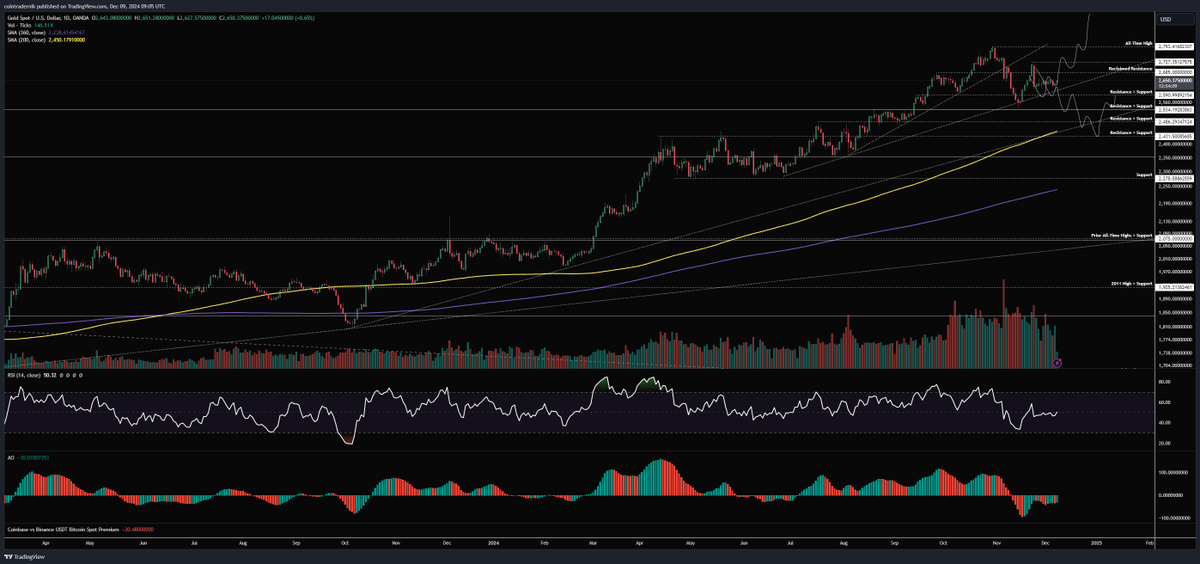
The daily chart shows that gold is following the previously outlined bullish path. If the price breaks above $2685 and converts $2727 into support, it will confirm the next stage of the uptrend, with a target of breaking above $2800 and moving towards $3000. However, if the price forms a lower high below $2685 this week and breaks below the trend line support to below $2590, it will confirm the bearish path, which may lead to further correction, breaking below the November low and testing the lower trend line support and 200-day moving average at $2450.
Copper
Current Price: $4.27
Weekly Analysis
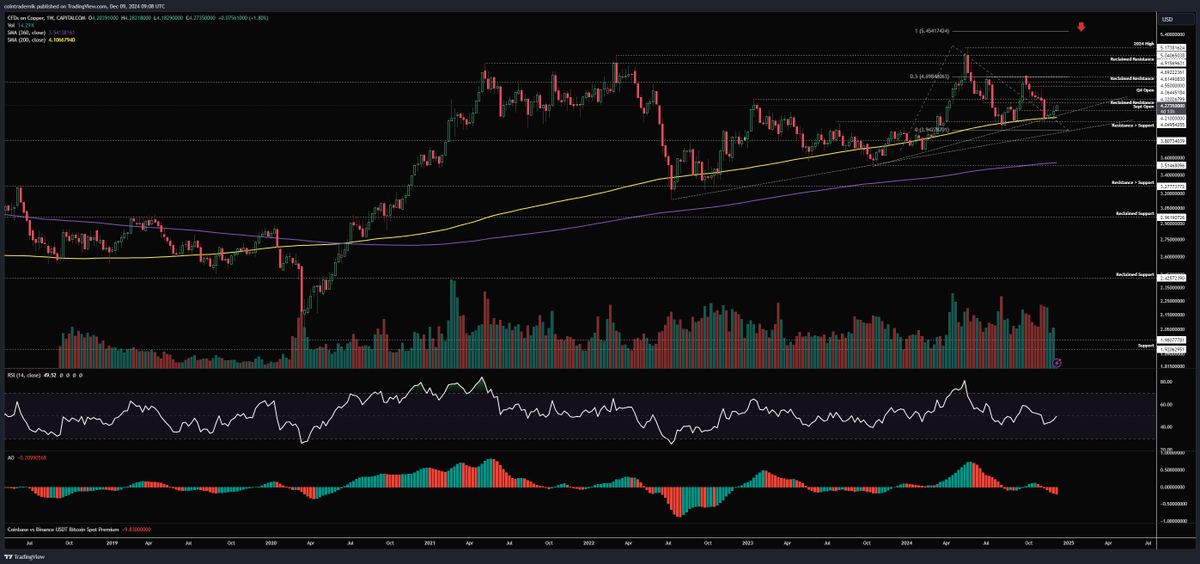
Looking at the weekly chart of copper, the price has finally shown signs of rebounding from the major support area, which may be related to the recent news about China's loose fiscal policy. Although the specific policy is not yet clear, the price trend in the market has already reflected the expectation of a policy shift in China. If the weekly close breaks above $4.36 this week, it will confirm the current as a medium-term bottom, and the price may retest the $4.70 high and further rise to around the multi-year range top of $5. As long as the price remains above $4, the market structure remains bullish.
Daily Analysis
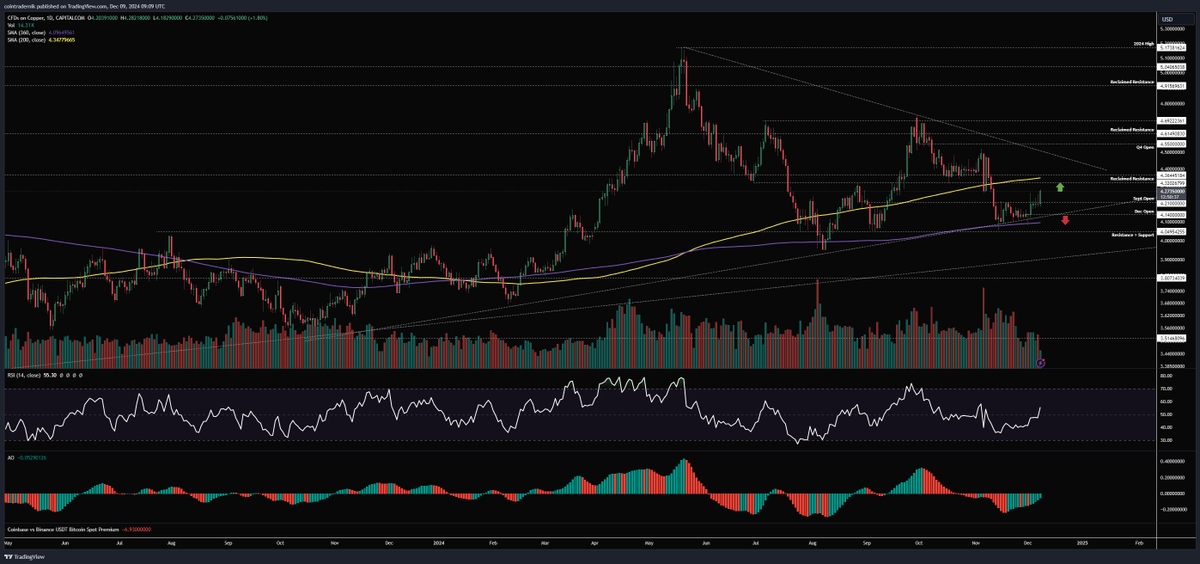
The daily chart shows that copper prices have found support at the 360-day moving average, and the momentum indicator also shows that the price is rebounding. The price is currently between this support and the resistance of the 200-day moving average, and the resistance of the annual high trend line also needs to be broken. If the current trend is confirmed as a bottom, the $4.20 area is expected to become a support, and the price may break through $4.36 in the next few weeks, attempt to break through the trend line resistance, and retest $4.70 in early 2025. If the price falls below the 360-day moving average ($4.09), it may indicate that the current bullish view is invalid.
US Dollar Index
Current Price: 105.6
Weekly Analysis
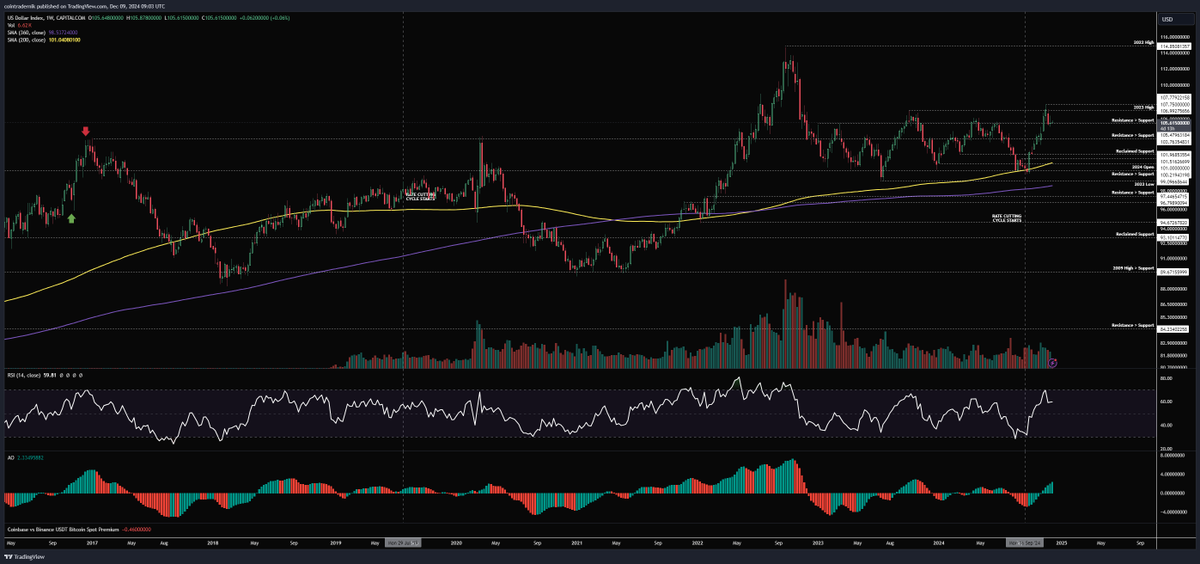
The US Dollar Index failed to break through the 2023 high again last week, but closed slightly above 105.5, not yet confirming that the price rise to 107.8 was a "false breakout". If the weekly close falls below 105.5, it may trigger further correction, with targets at the 200-week moving average and the range bottom, which is expected to be achieved in the next few weeks or months. However, if the price holds above 105.5 this week and rebounds from there, it may signal the start of a larger uptrend, with the 2023 high of 107 then being converted into support, and the price target pointing to above 108. The market is currently approaching this key turning point.
Daily Analysis
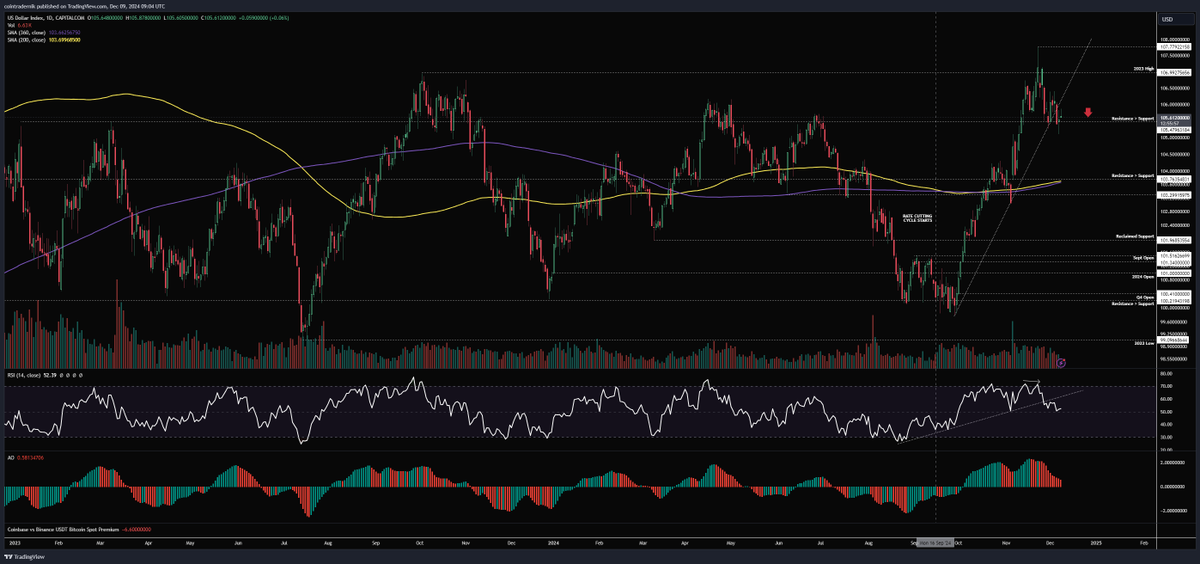
Looking at the daily chart, the expected weakening of the momentum and pullback of the RSI in the US Dollar Index has been partially realized, but the price still needs further confirmation. If the price forms a lower low and high below 105.5, it will confirm that the previous upward move was a false breakout, and the price is expected to fall back to the confluence area of the 200-day and 360-day moving averages (around $103.7), which was the previous resistance turned support area. However, if the price breaks through the trend line and stabilizes above the 2023 high of 107, the US Dollar Index will rise further, with a target of above 108.


