The market, project, and cryptocurrency information, opinions and judgments mentioned in this report are for reference only and do not constitute any investment advice.
After the issuance of the BTC Spot ETF, the correlation between the BTC price and the US stock market has become increasingly stronger. This was fully reflected in the market performance since November.
On November 5, Trump was elected as the 47th President of the United States, and the US stocks and BTC simultaneously launched the "Trump rally". The confidence of the trading parties in Trump's economic policy was very strong, driving this rally to continue to rise, lasting until December 18. On that day, the Fed issued hawkish remarks, hinting that it might change its monetary policy, and the market expects the number of rate cuts in 2025 to be revised down sharply from 4 to 2. After that, both the US stocks and BTC launched a significant downward revision.
The capital flow was the same. Before December 18, it was in a vigorous inflow state, and after the 18th, it quickly turned into an outflow state.
Although it hit new highs, before the 18th, BTC maintained an upward trend and gradually approached $110,000. The Fed's policy shift led to a cooling of trading sentiment, and the cooling caused BTC to be "cold at high altitudes" and was forced to start a downward revision.
EMC Labs believes that the world is still in a rate cut cycle, and the current cooling is only a temporary setback. With the gradual recovery of liquidity, BTC will once again attack the $100,000 mark after adjusting at high levels.
Macroeconomic Finance: The 2025 US rate cut expectation is reduced from 4 to 2
On December 18, the Fed announced that after the December rate cut, it issued hawkish remarks, stating that "the risks to achieving employment and inflation targets are roughly balanced, and if risks emerge that could impede the achievement of targets, the committee will be prepared to adjust the monetary policy stance as appropriate".
The so-called "target" is to "achieve full employment" and "maintain price stability". Balancing the two through federal interest rate adjustments is seen as the basic work content of the Fed.
According to the data released by the US in December, the number of new jobs in November increased by 227,000, indicating that the job market remains strong; the unemployment rate remained at 4.2%, flat with the previous few months, indicating that the job market is relatively stable. The CPI data shows that the inflation rate rose by 2.6% year-on-year, slightly higher than 2.4% in October, indicating that inflationary pressure has rebounded, and there have been 2 rebounds.
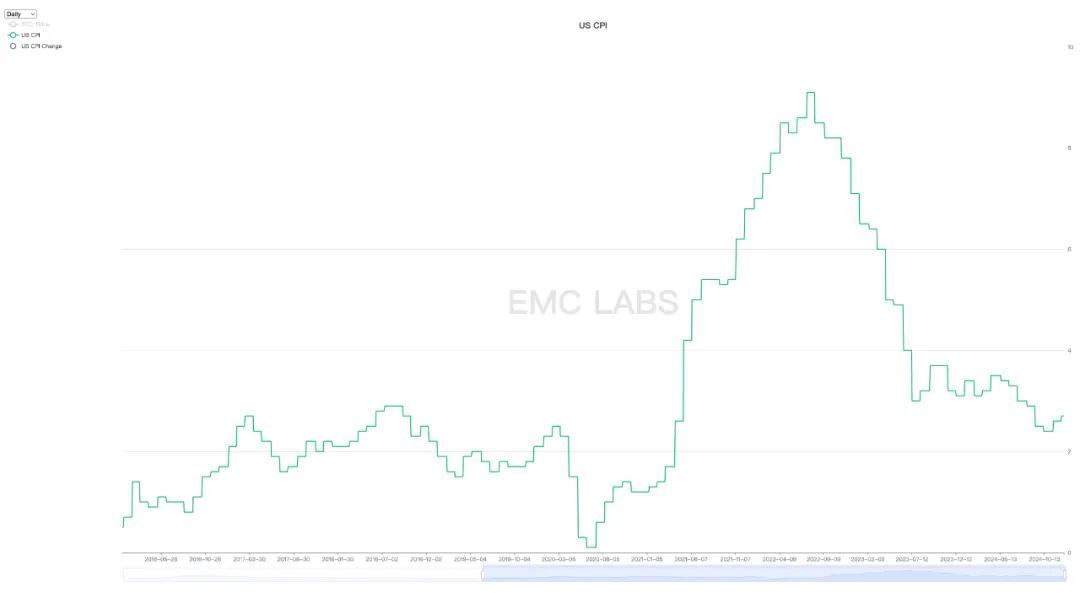
US CPI
Since September 2024, the Fed has cut interest rates three times, a total of 100 basis points, and the federal funds rate has now fallen to 4.33%. Although it is still at a high level, the data does not show that it has suppressed economic activity. Both new employment and the unemployment rate indicate that the US economy is in a healthy state. However, the rebound in inflation for two months has led the Fed to decide to temporarily suspend rate cuts to observe whether inflation data can fall back.
This pause is seen as the end of the first stage of the rate cut, and the second restart will require more economic data guidance, that is, weakening economic activity or CPI decline.
In 2025, although it has experienced twists and turns and chaos, the three major US stock indexes have achieved a significant increase for two consecutive years. Looking ahead to 2025, systemic risks are still not large, and the variable is the conflict between Trump's economic policy and monetary policy.
Due to market linkage reasons, for BTC to break out of the adjustment and completely attack the $100,000 mark, the stock trading parties need to have a clear direction, and the stock index needs to return to an upward trend.
Crypto Assets: $100,000 Mark and Market Saturation
In December, BTC opened at $96,464.95 and closed at $93,354.22, down 3.23% for the month, with a range of 17.74%. Trading volume was lower than November but still maintained at a relatively high level, indicating that there was a lot of disagreement and selling pressure after breaking through the $100,000 mark.
Looking back on 2024, BTC rose 120.76% for the full year, but 4 out of the 12 trading months were in a downward state. From April to October, a period of 7 months, BTC was in a long-term sideways consolidation after hitting a historical high of $70,000, during which it was hit by the restart of interest rate hikes, the German government's sell-off, and the collapse of the yen carry trade, with ups and downs and dangers.
It was a rather difficult year.
ETH and SOL, the two major smart contract platforms, rose 46.27% and 86.11% respectively, both lagging behind BTC, which was strongly supported by US stock capital. Except for a small number of coins that are still in the price discovery or manipulation-intensive stage, only about 20% of the top 100 coins by market cap have an annual increase higher than BTC, which is very different from the previous bull market.
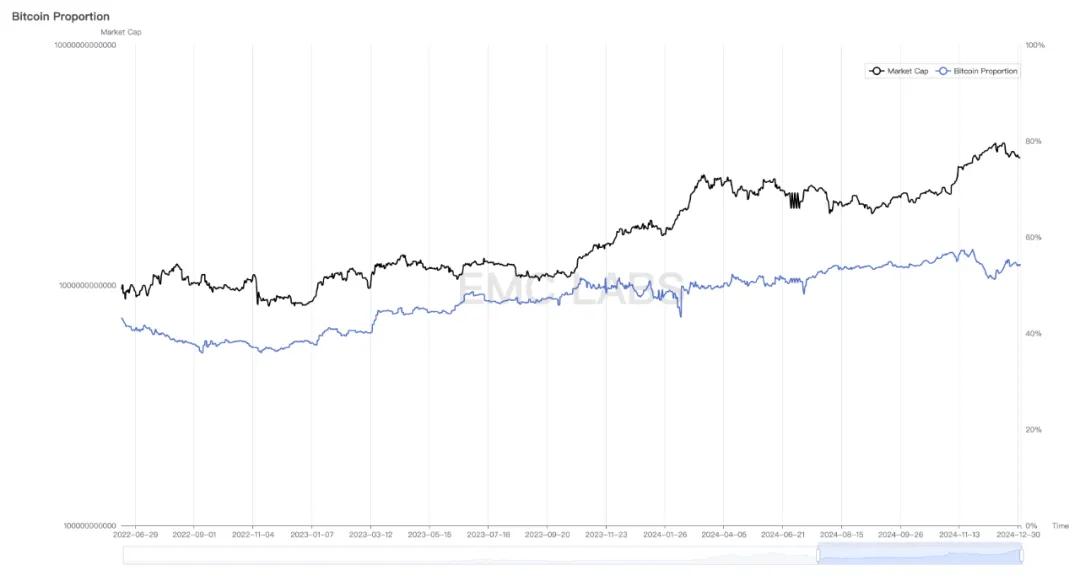
BTC Dominance
BTC's market dominance has been above 50% for a long time, reaching a high of 57.53% (November 21), and then began to decline, reaching a low of 51.22% (December 8), and then rebounded again, but the trend has not been able to continue. This shows that Altcoins have not been able to get enough long-term capital attention, and more are experiencing rapid rises and falls under the control of short-term speculative capital or manipulation, making it much more difficult for investors to operate.
In addition, although concepts and projects such as LRT, RWA, AI, Layer 2, and DePhin have emerged one after another, they have not been able to produce the long bull market tracks of DeFi and high-performance public chains that lasted for a year or even 20 months in the previous bull market. This is particularly worth noting.
Capital: Quickly Turned to Outflow After December 18
According to the data of traceable capital (stablecoins, BTC ETF, ETH ETF), the crypto market recorded a net inflow for the whole year of 2024, and a net inflow was recorded every month. This data shows that BTC and the crypto market are in the upward phase of this cycle, and the liquidity released by the rate cut cycle has driven the market to rise in a pulsed manner.
Especially after the Fed started cutting interest rates in September, the second wave of liquidity began to gradually recover, and in November, it began to flow in exuberantly after the crypto-friendly candidate Trump won the election, setting a monthly record of $26.9 billion. In the whole of December, the market inflow reached $15.7 billion, ranking second highest in this bull market and fourth highest in history.
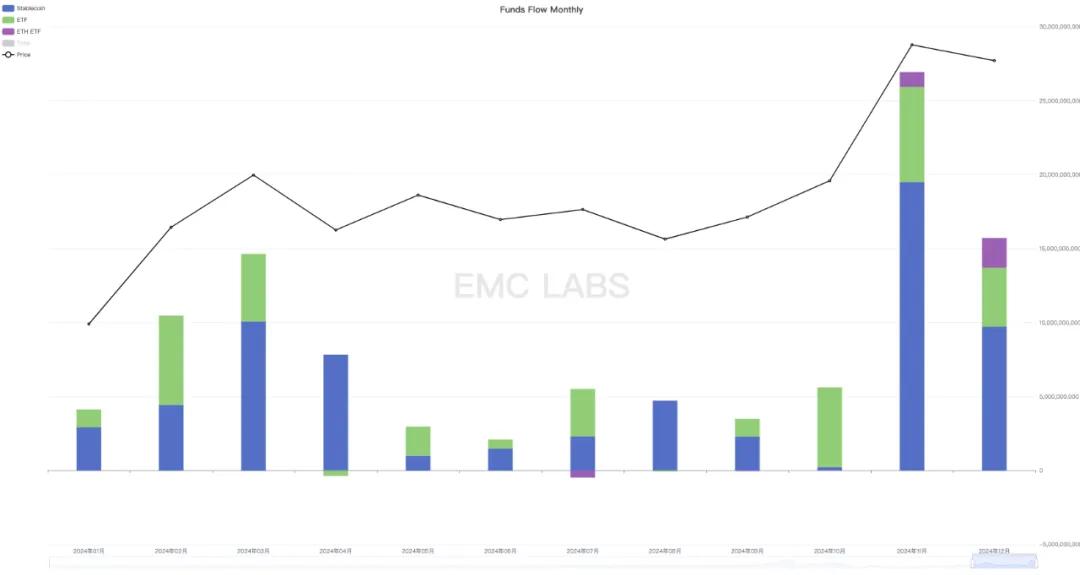
Monthly inflow and outflow of stablecoins, BTC ETF and ETH ETF
In addition, Microstrategy invested about $12.8 billion in BTC in November and December, directly driving the company's market value to soar and entering the Nasdaq 100 index.
However, after the Fed lowered its rate cut expectations on December 18, the two major ETFs and stablecoin channels quickly turned to outflows the next day, and although there have been fluctuations since then, the overall trend is still one of amplified outflows. BTC prices also fluctuated downwards, from a high of $108,388.88 to a low of $91,271.19, with a maximum drawdown of 15.84%.
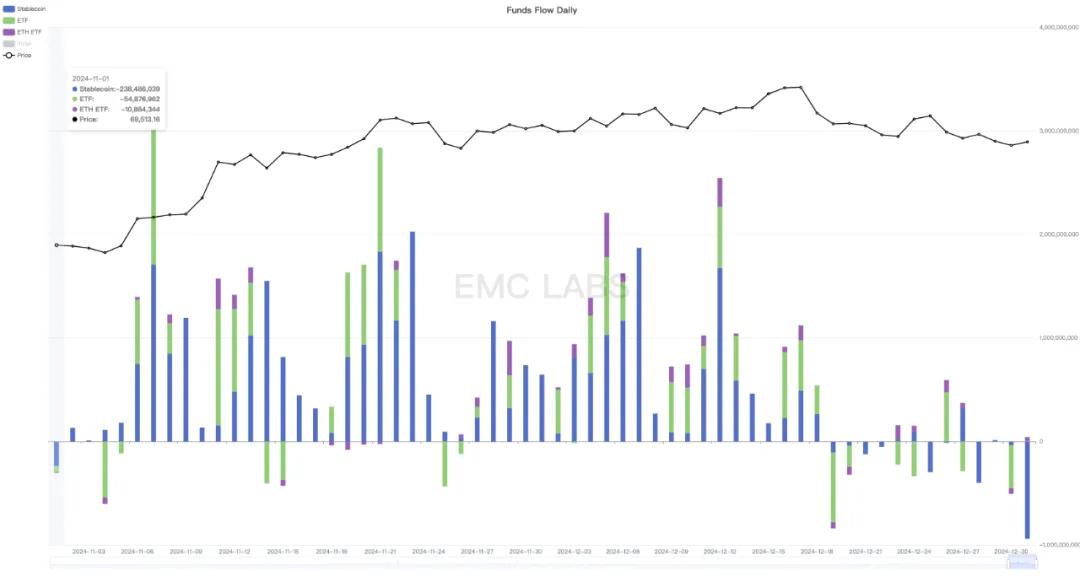
Daily inflow and outflow of stablecoins, BTC ETF and ETH ETF
The three major US stock indexes also experienced a downward revision during this period, with the Nasdaq, Dow Jones and S&P 500 falling 5.13%, 6.49% and 4.39% respectively. The adjustment range of BTC is about 3 times that of the Nasdaq.
The driving force of the stage rally that started on November 4 came from the speculative enthusiasm of the "Trump trade", and this sentiment was quickly cooled by the Fed's lowering of the rate cut expectation on December 18. During this period, BTC adjusted along with the US stock indexes, and the drawdown was at the lower end of the bull market drawdown record before the cutoff date, and the ratio to the Nasdaq volatility was also in a reasonable range.
Currently, there is still ample capital in the market, and there is no major crisis. The focus going forward is whether the US stocks can return to an upward trend after Trump takes office, and whether the capital in the crypto market will return to an inflow state.
However, if the US stocks adjust for a long time and the selling pressure accumulates, BTC may not rule out revisiting new lows. If so, the decline of Altcoins is likely to be even greater.
The Second Sell-off: Liquidity and Historical Laws
According to eMerge Engine, the BTC and cryptocurrency market is currently in a bullish uptrend. The main market activity in this stage is the long position sell-off, while the short positions are continuously increasing, and the continuous increase in liquidity is driving the asset prices to continue to rise.
The long position group conducted the first round of sell-offs in this cycle from January to May this year, and started to accumulate again from June, with their holdings reaching 14,207,303.14 by October. Since October, they have restarted the sell-off, which is the second round of this cycle. Historically, this round of sell-offs will continue until the transition period, i.e., the peak of the bull market.
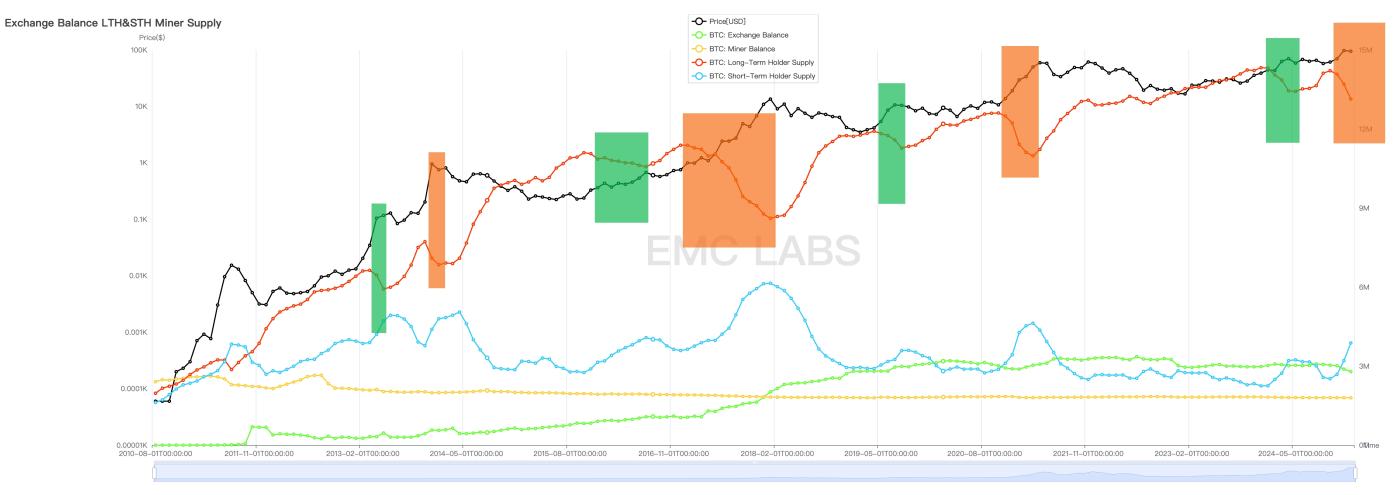
Monthly holdings of long and short positions, CEX, and miners
As of December 31, the long position holdings were 13,133,062.92, and the "sell-off scale" (based on the re-pricing of on-chain UTXO, greater than the actual sell-off volume) has exceeded 1.07 million BTC from the October high point.
The massive sell-off has absorbed the surging inflow of funds, and once the subsequent inflow of funds cannot be sustained, the price can only be revised downward for the market to establish a new balance.
The behavior of the long position group depends on the will of this group and the inflow of funds. Whether the subsequent sell-off will continue or be postponed needs to be observed continuously.
If the funds resume inflow, the selling pressure will be reduced, and the price may resume its upward trend; if the funds cannot resume inflow or only a small amount of inflow, and the long position group continues to sell-off, the price will break through the new consolidation range of $90,000 - $100,000 and revise downward; if the funds cannot resume inflow or only a small amount of inflow, and the long position group postpones the sell-off, the market is most likely to fluctuate within the new consolidation range, waiting for a larger inflow of funds.
Conclusion
The cyclical juggernaut is running as usual. Time, space, and the long-short game all indicate that this stage of adjustment is triggered by the sudden cooling of the long sentiment due to the sharp rise in prices and the downward adjustment of the Fed's rate cut expectations.
The timing and scale of the adjustment first depend on when the mainstream funds in the US stock market resume their long positions, and the sell-off plan of the long position group.
For the broader cryptocurrency market, the most noteworthy issue at the moment is that the second stage of the uptrend has opened, but will the core track-leading, long-lasting Altcoin Season be absent in this bull market!
EMC Labs was founded in April 2023 by cryptocurrency investors and data scientists. It focuses on blockchain industry research and Crypto secondary market investment, with industry foresight, insight, and data mining as its core competitiveness, committed to participating in the thriving blockchain industry through research and investment, and promoting blockchain and cryptocurrencies to bring welfare to humanity.
For more information, please visit: https://www.emc.fund